

Лабораторная работа №5
.docx
ФЕДЕРАЛЬНОЕ АГЕНТСТВО СВЯЗИ
Ордена Трудового Красного Знамени
федеральное государственное бюджетное образовательное учреждение
высшего образования
Московский технический университет связи и информатики
----------------------------------------------------------------------------------------------
Кафедра Математической кибернетики и информационных технологий
ЛАБОРАТОРНАЯ РАБОТА № 5
по дисциплине
ОПЕРАЦИОННЫЕ СИСТЕМЫ
«Архитектура памяти Windows»
Выполнил:
студент Алгазин П.В.
группа БФИ1601
Проверил:
Королькова Т.В.
ст. пр. кафедры МКиИТ
Дата ___________________________
Москва 2018
Название работы: Архитектура памяти Windows.
Цель работы: получение практических навыков по использованию Win32 API для исследования памяти Windows
Задание: создать программное обеспечение для приложения, которое:
выдает информацию, получаемую при использовании API GlobalMemoryStatus. При выводе информации использовать диаграммы.
Составляет карту виртуальной памяти для любого процесса.
Исходный код:
#pragma once #include <windows.h> #include <stdio.h> #include <tchar.h> #include <list> #include <tlhelp32.h> #define DIV 1024 #define WIDTH 7 DWORD ID[9999]; namespace Лабораторнаяработа№5 { using namespace System; using namespace System::ComponentModel; using namespace System::Collections; using namespace System::Windows::Forms; using namespace System::Data; using namespace System::Drawing; /// <summary> /// Сводка для Form1 /// </summary> public ref class Form1 : public System::Windows::Forms::Form { public: Form1(void) { InitializeComponent(); // //TODO: добавьте код конструктора // } protected: /// <summary> /// Освободить все используемые ресурсы. /// </summary> ~Form1() { if (components) { delete components; } } protected: private: System::Windows::Forms::Button^ button1; private: System::Windows::Forms::DataVisualization::Charting::Chart^ chart4; private: System::Windows::Forms::DataVisualization::Charting::Chart^ chart3; private: System::Windows::Forms::DataVisualization::Charting::Chart^ chart2; private: System::Windows::Forms::ListBox^ listBox1; private: System::Windows::Forms::TextBox^ textBox1; private: System::ComponentModel::IContainer^ components; protected: private: /// <summary> /// Требуется переменная конструктора. /// </summary> #pragma region Windows Form Designer generated code /// <summary> /// Обязательный метод для поддержки конструктора - не изменяйте /// содержимое данного метода при помощи редактора кода. /// </summary> void InitializeComponent(void) { System::Windows::Forms::DataVisualization::Charting::ChartArea^ chartArea1 = (gcnew System::Windows::Forms::DataVisualization::Charting::ChartArea()); System::Windows::Forms::DataVisualization::Charting::Legend^ legend1 = (gcnew System::Windows::Forms::DataVisualization::Charting::Legend()); System::Windows::Forms::DataVisualization::Charting::Series^ series1 = (gcnew System::Windows::Forms::DataVisualization::Charting::Series()); System::Windows::Forms::DataVisualization::Charting::Title^ title1 = (gcnew System::Windows::Forms::DataVisualization::Charting::Title()); System::Windows::Forms::DataVisualization::Charting::ChartArea^ chartArea2 = (gcnew System::Windows::Forms::DataVisualization::Charting::ChartArea()); System::Windows::Forms::DataVisualization::Charting::Legend^ legend2 = (gcnew System::Windows::Forms::DataVisualization::Charting::Legend()); System::Windows::Forms::DataVisualization::Charting::Series^ series2 = (gcnew System::Windows::Forms::DataVisualization::Charting::Series()); System::Windows::Forms::DataVisualization::Charting::Title^ title2 = (gcnew System::Windows::Forms::DataVisualization::Charting::Title()); System::Windows::Forms::DataVisualization::Charting::ChartArea^ chartArea3 = (gcnew System::Windows::Forms::DataVisualization::Charting::ChartArea()); System::Windows::Forms::DataVisualization::Charting::Legend^ legend3 = (gcnew System::Windows::Forms::DataVisualization::Charting::Legend()); System::Windows::Forms::DataVisualization::Charting::Series^ series3 = (gcnew System::Windows::Forms::DataVisualization::Charting::Series()); System::Windows::Forms::DataVisualization::Charting::Title^ title3 = (gcnew System::Windows::Forms::DataVisualization::Charting::Title()); this->button1 = (gcnew System::Windows::Forms::Button()); this->chart4 = (gcnew System::Windows::Forms::DataVisualization::Charting::Chart()); this->chart3 = (gcnew System::Windows::Forms::DataVisualization::Charting::Chart()); this->chart2 = (gcnew System::Windows::Forms::DataVisualization::Charting::Chart()); this->listBox1 = (gcnew System::Windows::Forms::ListBox()); this->textBox1 = (gcnew System::Windows::Forms::TextBox()); (cli::safe_cast<System::ComponentModel::ISupportInitialize^ >(this->chart4))->BeginInit(); (cli::safe_cast<System::ComponentModel::ISupportInitialize^
>(this->chart3))->BeginInit(); (cli::safe_cast<System::ComponentModel::ISupportInitialize^ >(this->chart2))->BeginInit(); this->SuspendLayout(); // // button1 // this->button1->Location = System::Drawing::Point(12, 12); this->button1->Name = L"button1"; this->button1->Size = System::Drawing::Size(1262, 84); this->button1->TabIndex = 2; this->button1->Text = L"Вывести список процессов"; this->button1->UseVisualStyleBackColor = true; this->button1->Click += gcnew System::EventHandler(this, &Form1::button1_Click); // // chart4 // this->chart4->BackColor = System::Drawing::SystemColors::Control; chartArea1->BackColor = System::Drawing::SystemColors::Control; chartArea1->Name = L"ChartArea1"; this->chart4->ChartAreas->Add(chartArea1); legend1->BackColor = System::Drawing::SystemColors::Control; legend1->Font = (gcnew System::Drawing::Font(L"Microsoft Sans Serif", 13.8F, System::Drawing::FontStyle::Regular, System::Drawing::GraphicsUnit::Point, static_cast<System::Byte>(204))); legend1->IsTextAutoFit = false; legend1->Name = L"Legend1"; this->chart4->Legends->Add(legend1); this->chart4->Location = System::Drawing::Point(852, 518); this->chart4->Name = L"chart4"; this->chart4->Palette = System::Windows::Forms::DataVisualization::Charting::ChartColorPalette::Bright; series1->ChartArea = L"ChartArea1"; series1->ChartType = System::Windows::Forms::DataVisualization::Charting::SeriesChartType::Pie; series1->Font = (gcnew System::Drawing::Font(L"Microsoft Sans Serif", 13.8F, System::Drawing::FontStyle::Regular, System::Drawing::GraphicsUnit::Point, static_cast<System::Byte>(204))); series1->IsValueShownAsLabel = true; series1->LabelForeColor = System::Drawing::Color::White; series1->Legend = L"Legend1"; series1->Name = L"Series1"; this->chart4->Series->Add(series1); this->chart4->Size = System::Drawing::Size(414, 156); this->chart4->TabIndex = 6; this->chart4->Text = L"chart4"; title1->Font = (gcnew System::Drawing::Font(L"Microsoft Sans Serif", 13.8F, System::Drawing::FontStyle::Regular, System::Drawing::GraphicsUnit::Point, static_cast<System::Byte>(204))); title1->Name = L"Title1"; this->chart4->Titles->Add(title1); // // chart3 // this->chart3->BackColor = System::Drawing::SystemColors::Control; chartArea2->BackColor = System::Drawing::SystemColors::Control; chartArea2->Name = L"ChartArea1"; this->chart3->ChartAreas->Add(chartArea2); legend2->BackColor = System::Drawing::SystemColors::Control; legend2->Font = (gcnew System::Drawing::Font(L"Microsoft Sans Serif", 13.8F, System::Drawing::FontStyle::Regular, System::Drawing::GraphicsUnit::Point, static_cast<System::Byte>(204))); legend2->IsTextAutoFit = false; legend2->Name = L"Legend1"; this->chart3->Legends->Add(legend2); this->chart3->Location = System::Drawing::Point(432, 518); this->chart3->Name = L"chart3"; this->chart3->Palette = System::Windows::Forms::DataVisualization::Charting::ChartColorPalette::Bright; series2->ChartArea = L"ChartArea1"; series2->ChartType = System::Windows::Forms::DataVisualization::Charting::SeriesChartType::Pie; series2->Font = (gcnew System::Drawing::Font(L"Microsoft Sans Serif", 13.8F, System::Drawing::FontStyle::Regular, System::Drawing::GraphicsUnit::Point, static_cast<System::Byte>(204))); series2->IsValueShownAsLabel = true; series2->LabelForeColor = System::Drawing::Color::White; series2->Legend = L"Legend1"; series2->Name = L"Series1"; this->chart3->Series->Add(series2); this->chart3->Size = System::Drawing::Size(414, 156); this->chart3->TabIndex = 5; this->chart3->Text = L"chart3"; title2->Font = (gcnew System::Drawing::Font(L"Microsoft Sans Serif", 13.8F, System::Drawing::FontStyle::Regular, System::Drawing::GraphicsUnit::Point, static_cast<System::Byte>(204))); title2->Name = L"Title1"; this->chart3->Titles->Add(title2); //
// chart2 // this->chart2->BackColor = System::Drawing::SystemColors::Control; chartArea3->BackColor = System::Drawing::SystemColors::Control; chartArea3->Name = L"ChartArea1"; this->chart2->ChartAreas->Add(chartArea3); legend3->BackColor = System::Drawing::SystemColors::Control; legend3->Font = (gcnew System::Drawing::Font(L"Microsoft Sans Serif", 13.8F, System::Drawing::FontStyle::Regular, System::Drawing::GraphicsUnit::Point, static_cast<System::Byte>(204))); legend3->IsTextAutoFit = false; legend3->Name = L"Legend1"; this->chart2->Legends->Add(legend3); this->chart2->Location = System::Drawing::Point(12, 518); this->chart2->Name = L"chart2"; this->chart2->Palette = System::Windows::Forms::DataVisualization::Charting::ChartColorPalette::Bright; series3->ChartArea = L"ChartArea1"; series3->ChartType = System::Windows::Forms::DataVisualization::Charting::SeriesChartType::Pie; series3->Font = (gcnew System::Drawing::Font(L"Microsoft Sans Serif", 13.8F, System::Drawing::FontStyle::Regular, System::Drawing::GraphicsUnit::Point, static_cast<System::Byte>(204))); series3->IsValueShownAsLabel = true; series3->LabelForeColor = System::Drawing::Color::White; series3->Legend = L"Legend1"; series3->Name = L"Series1"; this->chart2->Series->Add(series3); this->chart2->Size = System::Drawing::Size(414, 156); this->chart2->TabIndex = 4; this->chart2->Text = L"chart2"; title3->Font = (gcnew System::Drawing::Font(L"Microsoft Sans Serif", 13.8F, System::Drawing::FontStyle::Regular, System::Drawing::GraphicsUnit::Point, static_cast<System::Byte>(204))); title3->Name = L"Title1"; this->chart2->Titles->Add(title3); // // listBox1 // this->listBox1->FormattingEnabled = true; this->listBox1->ItemHeight = 29; this->listBox1->Location = System::Drawing::Point(12, 102); this->listBox1->Name = L"listBox1"; this->listBox1->Size = System::Drawing::Size(455, 410); this->listBox1->TabIndex = 8; this->listBox1->SelectedIndexChanged += gcnew System::EventHandler(this, &Form1::listBox1_SelectedIndexChanged); // // textBox1 // this->textBox1->Location = System::Drawing::Point(473, 102); this->textBox1->Multiline = true; this->textBox1->Name = L"textBox1"; this->textBox1->ScrollBars = System::Windows::Forms::ScrollBars::Vertical; this->textBox1->Size = System::Drawing::Size(793, 410); this->textBox1->TabIndex = 9; // // Form1 // this->AutoScaleDimensions = System::Drawing::SizeF(14, 29); this->AutoScaleMode = System::Windows::Forms::AutoScaleMode::Font; this->ClientSize = System::Drawing::Size(1286, 709); this->Controls->Add(this->textBox1); this->Controls->Add(this->chart4); this->Controls->Add(this->button1); this->Controls->Add(this->listBox1); this->Controls->Add(this->chart3); this->Controls->Add(this->chart2); this->Font = (gcnew System::Drawing::Font(L"Microsoft Sans Serif", 13.8F, System::Drawing::FontStyle::Regular, System::Drawing::GraphicsUnit::Point, static_cast<System::Byte>(204))); this->Margin = System::Windows::Forms::Padding(5); this->Name = L"Form1"; this->Text = L"Лабораторная работа №5"; this->Load += gcnew System::EventHandler(this, &Form1::Form1_Load); (cli::safe_cast<System::ComponentModel::ISupportInitialize^ >(this->chart4))->EndInit(); (cli::safe_cast<System::ComponentModel::ISupportInitialize^ >(this->chart3))->EndInit(); (cli::safe_cast<System::ComponentModel::ISupportInitialize^ >(this->chart2))->EndInit(); this->ResumeLayout(false); this->PerformLayout(); } #pragma endregion private: System::Void button1_Click(System::Object^ sender, System::EventArgs^ e) { listBox1->Items->Clear(); HANDLE Snapshot = CreateToolhelp32Snapshot(TH32CS_SNAPPROCESS, 0); PROCESSENTRY32 entry; entry.dwSize = sizeof(PROCESSENTRY32); BOOL fRepeat = Process32First(Snapshot, &entry); int i = 0; while (fRepeat)
{ ID[i]=entry.th32ProcessID; listBox1->Items->Add(gcnew String(entry.szExeFile)); i++; fRepeat = Process32Next(Snapshot, &entry); } CloseHandle(Snapshot); } private: System::Void listBox1_SelectedIndexChanged(System::Object^ sender, System::EventArgs^ e) { textBox1->Text=""; wchar_t buf1[100],buf2[100]; MEMORY_BASIC_INFORMATION mbi; int i=0; ZeroMemory(&mbi, sizeof(MEMORY_BASIC_INFORMATION)); int index = listBox1->SelectedIndex; HANDLE process = OpenProcess(PROCESS_ALL_ACCESS, TRUE, ID[index]); if (!VirtualQueryEx(process,NULL,&mbi,sizeof(mbi))); else do { swprintf(buf1,100,L"&H%Xh",(int)mbi.BaseAddress); swprintf(buf2,100,L"%d Bytes",(int)mbi.RegionSize); textBox1->Text+=L"\r\n\r\nBase address = "+gcnew String (buf1)+L"\r\nRegion Size = "+gcnew String (buf2); if (mbi.State==MEM_FREE) { textBox1->Text+=L"\r\nState = Free"; } else { switch(mbi.State) { case MEM_RESERVE: textBox1->Text+=L"\r\nState = Reserved"; break; case MEM_COMMIT: textBox1->Text+=L"\r\nState = Commited"; break; } switch(mbi.Type) { case MEM_IMAGE: textBox1->Text+=L"\r\nType = Image"; break; case MEM_MAPPED: textBox1->Text+=L"\r\nType = Mapped"; break; case MEM_PRIVATE: textBox1->Text+=L"\r\nType = Private"; break; } switch(mbi.AllocationProtect) { case PAGE_READONLY: textBox1->Text+=L"\r\nAllocation Protect = ReadOnly"; break; case PAGE_READWRITE: textBox1->Text+=L"\r\nAllocation Protect = ReadWrite"; break; case PAGE_NOACCESS: textBox1->Text+=L"\r\nAllocation Protect = NoAccess"; break; case PAGE_WRITECOPY: textBox1->Text+=L"\r\nAllocation Protect = WriteCopy"; break; case PAGE_EXECUTE: textBox1->Text+=L"\r\nAllocation Protect = Execute"; break; case PAGE_EXECUTE_READ: textBox1->Text+=L"\r\nAllocation Protect = ExecuteRead"; break; case PAGE_EXECUTE_READWRITE: textBox1->Text+=L"\r\nAllocation Protect = ExecuteReadWrite"; break; case PAGE_EXECUTE_WRITECOPY: textBox1->Text+=L"\r\nAllocation Protect = ExecuteReadCopy"; break; case PAGE_GUARD: textBox1->Text+=L"\r\nAllocation Protect = Guard"; break; case PAGE_NOCACHE: textBox1->Text+=L"\r\nAllocation Protect = Nocache"; break; } } i++; }while(VirtualQueryEx(process,(LPCVOID)((int)mbi.BaseAddress+mbi.RegionSize),&mbi,sizeof(MEMORY_BASIC_INFORMATION))&& ((LPCVOID)mbi.BaseAddress<(LPCVOID)0x1FFFFFFF) && (i<50)); } private: System::Void Form1_Load(System::Object^ sender, System::EventArgs^ e) { chart2->Series[0]->Points->Clear(); chart2->Titles[0]->Text="Физическая память в MB"; chart3->Series[0]->Points->Clear(); chart3->Titles[0]->Text="Файл подкачки в MB"; chart4->Series[0]->Points->Clear(); chart4->Titles[0]->Text="Виртуальная память в MB"; MEMORYSTATUSEX statex; statex.dwLength = sizeof (statex); GlobalMemoryStatusEx (&statex); chart2->Series[0]->Points->Add(statex.ullTotalPhys/(1024*1024)-statex.ullAvailPhys/(1024*1024)); chart2->Series[0]->Points->Add(statex.ullAvailPhys/(1024*1024)); chart2->Series[0]->Points[0]->LegendText="Используется"; chart2->Series[0]->Points[1]->LegendText="Свободно"; chart3->Series[0]->Points->Add(statex.ullTotalPageFile/(1024*1024)-statex.ullAvailPageFile/(1024*1024)); chart3->Series[0]->Points->Add(statex.ullAvailPageFile/(1024*1024)); chart3->Series[0]->Points[0]->LegendText="Используется";
chart3->Series[0]->Points[1]->LegendText="Свободно"; chart4->Series[0]->Points->Add(statex.ullTotalVirtual/(1024*1024)-statex.ullAvailVirtual/(1024*1024)); chart4->Series[0]->Points->Add(statex.ullAvailVirtual/(1024*1024)); chart4->Series[0]->Points[0]->LegendText="Используется"; chart4->Series[0]->Points[1]->LegendText="Свободно"; } }; }
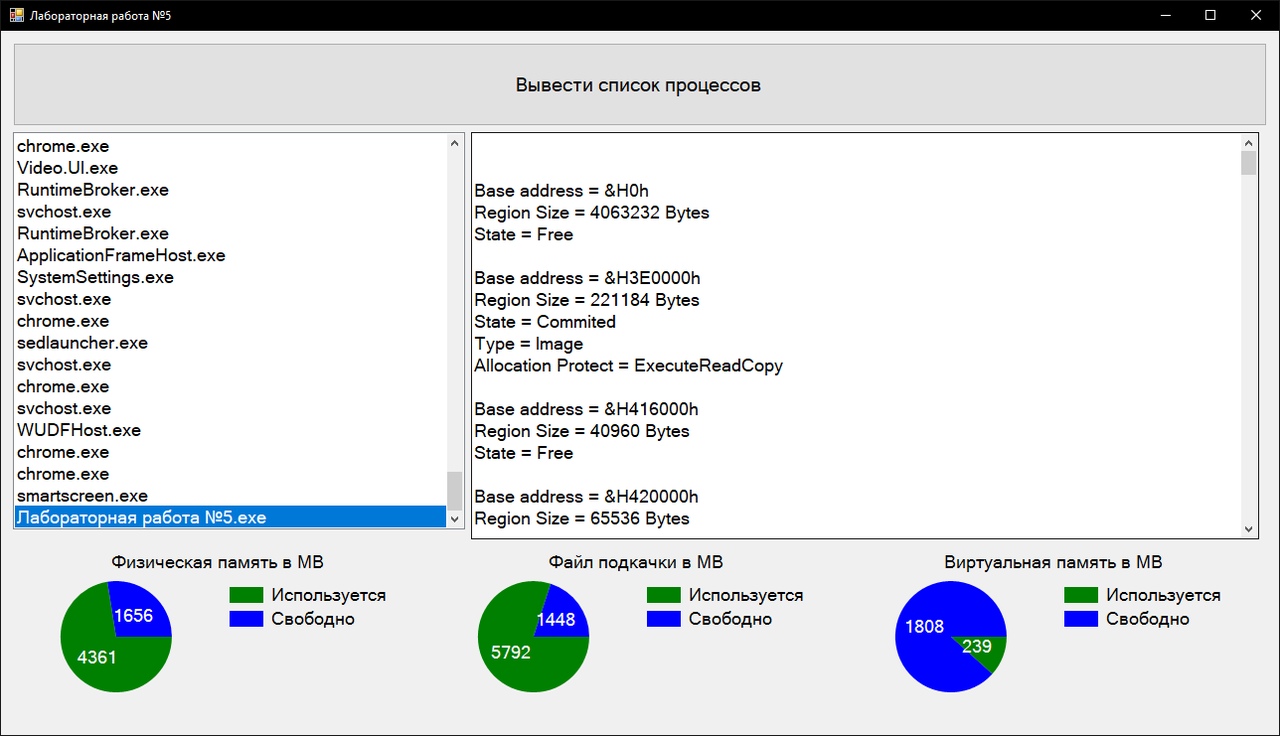
Рисунок 1 - Результат выполнения