

В папку для зачета / CO-MILLING GREEN WOOD CHIPS (Сивков)
.pdfCO-MILLING GREEN WOOD CHIPS AT
ALABAMA POWER COMPANY’S PLANT GADSDEN UNIT 2
Doug Boylan
Keith Roberts
Bill Zemo
Tom Johnson
EXECUTIVE SUMMARY
Biomass co-firing is the burning of biomass together with coal in an existing coal-fired power plant. Burning biomass is generally considered carbon neutral, and the co-firing technology may represent one of the lowest cost options for generating renewable energy in the Southeast United States.
Therefore Southern Company has been conducting a series of performance and operational tests on several co-firing technologies and fuels. This report describes tests on green wood chips processed from whole and from approximately needle free pine trees. Partners with Southern Company in this project include the USDA Forest Service, National Forests in Alabama, Forest Products Lab and Southern Research Station; Auburn University, Forest Products Development Center; Precision Husky; CAWACO RC&D; Forest Based Economic Development Services;, Center of Economic Development, University of Alabama; Reynolds Wood Products; and Temple Inland. The goal was to determine what level of processing of whole trees is required to successfully co-fire the chips in a boiler, and to evaluate the benefits and costs of wood processing compared with the effect of the fuel on the power plant.
Green wood chips were successfully co-fired in blends with coal between 8% and 15% wood by weight. Of the input fuel energy, 2.8% and 5.5% was from wood, and represented about 2.0 MW to 3.8 MW biomass power.
Sulfur emissions were reduced, and particulates were no higher with co-firing. There are questions yet to be resolved regarding the effect of co-firing on carbon monoxide. The measured impact on NOx emissions was small.
With 10% co-firing, boiler efficiency was about the same as coal alone, while there was a slight reduction in efficiency with 15% wood. This result was unexpected because of the high moisture content of the wood chips (50%-67%). However, higher moisture losses were offset or nearly offset by reduced dry gas losses up the stack.
There were operational problems which will require further assessment. High moisture of the wood coal mixtures resulted in low mill temperatures and high mill bowl under pressures. Consequently, operation at 15% wood co-firing with these fairly coarse and very wet wood chips resulted in a 5 % load derate. However, the most difficult problem was unit operating stability. The coal wood mixtures had much lower fuel energy to volume ratio than the baseline coal. The issues appeared to have been related to the
installation of new automatic controls. Stability issues were corrected in subsequent tests by tuning the fuel-steam pressure automatic controls.
2
INTRODUCTION
Forest managers often need to clear whole trees from their lands, either for thinning, for removal of diseased trees, to reduce fire hazard, or to replace the type of trees growing there. This harvesting can result in large quantities of wood that often find no market for producing either lumber or paper mill chips.
Recently consideration has been given to using whole trees as fuel, particularly for generating electricity. If a market as fuel could be found for the trees, it could offer economic return to the forest owners. Since combustion of the wood would result in essentially no net CO2 addition to the atmosphere and based on a renewable resource, that energy so produced could be considered renewable. This could offer benefits to the power generating company.
A project was initiated by Southern Company, USDA Forest Service, Forest Based Economic Development Services, University of Alabama, and Auburn University to investigate the effect of wood processing on co-milling forest harvested materials in a coal fired power plant. The goal of this project is to evaluate the overall costs and benefits of harvesting forest trees for use as fuel to make renewable energy in existing coal fired power plants. Auburn University and the Forestry Department assessed the harvesting and processing of the wood. Precision Husky Corporation of Leeds, AL designed and constructed a wood chipper for this project to make relatively fine green wood chips at commercial scale rates. Pine trees were harvested from a plot in the Talladega National Forest, and were chipped in a number of ways to provide five types of fuels. Southern Company and Alabama Power evaluated the most economical means of generating electricity using these wood chips with the technology of co-firing.
In co-firing, a percentage of biomass is introduced as fuel into an existing coal fired boiler, often directly blended with the coal itself. The high capital cost of building a stand-alone power plant is avoided, and the technology offers the potential for high efficiency. It is a renewable technology most likely to directly displace coal.
The units, however, are not designed for this mixture of materials. The properties of biomass are quite different from those of coal. The wood density and heating value of the mixture are both less than in coal. Wood has a tendency to break into fibers than can affect material handling. Overall, the extent to which the fuels differ can impact the operations and performance of a power plant. Extensive studies have been conducted by Southern Company and others to quantify the costs and benefits related to co-firing various materials. Generally the drier and the finer the wood fuel, the easier it has been to co-fire.
Wood chips from forestry applications, however, would have larger size, higher moisture, and also include pine needles. These chips could be reduced to fine size and low moisture, but such processing is expensive. Therefore, minimizing the amount of processing would help to reduce final product costs, but the amount of required processing is not well known. The amount of size reduction required for co-firing, the
3
effect of high moisture wood, and the maximum amount a typical coal-fired power plant could co-fire required research.
Therefore, as part of the forestry project, Southern Company and Alabama Power conducted co-firing tests of several wood chip grind sizes and compositions (i.e. with and without needles). About 1100 tons of wood chips from the Talladega National Forest Shoal Creek District were delivered to Plant Gadsden, an Alabama Power Company pulverized coal plant located in Gadsden, Alabama, The plant is served by two nominally 60 MWe Combustion Engineering tangentially fired units.
During October and November of 2007, the chips were co-fired in the Unit 2 boiler, and fifty-five performance, emissions, and operations tests were performed over a period of 3 weeks. This report presents the results of those tests.
OBJECTIVES
The objectives of this study were to determine under what conditions of size, composition, and moisture content that green wood chips can be successfully co-fired with coal, and how co-milling green wood chips affects power plant operations, materials handling, boiler efficiency, and boiler emissions. Test parameters included in the investigation include:
•Chip size of wood product
•Presence of pine needles
•Percentage of wood for co-firing
•Unit load limitations
•Combustion air rate
WOOD
Wood for these tests was harvested as part of a National Forestry Service Project from a field in the Talladega National Forest near Heflin, AL. The trees were nearly all whole loblolly pines of about 8” or less trunk diameter. For some of the tests, whole trees were used (“Whole Tree Chips.”) For several of the tests, most of the pine needles were removed from each tree by pushing the trees top-forward into a small stand of other pine trees. Chips made from pine trees with reduced needles were referred to as “Clean Chips.”
The trees were all chipped with a Precision Husky PH3045 Horizontal Grinder, powered with a 500 hp diesel engine. The machine blades could be adjusted to change the size of the chips produced. In any sample, there is a great variety of chip length, but in essence “Short fiber” chips were roughly 3/8” to ½” minus. Because producing smaller sized chips reduces the machine production and hence increases cost, two other grinder settings
4

were also tried. One setting produced “long fiber” chips of roughly ½” to ¾” minus. In both of these cases, the pine needles when included were sized similarly to the chips. The third chipper setting allowed rapid production of the finer wood chips, but the pine needle pieces were much longer. A limited amount of these “Production Chips” was produced.
Representative samples are shown in Figure 1 to give a rough estimate of the relative chip size for each setting
Wood samples were analyzed for fuel properties at the Alabama Power Company Labs in Calera, AL. Moisture content measurements of chip samples immediately from the field were all within 2% of 50% moisture, including a sample of pure needles. Sample analyses including some density measurements are included in the appendix.
Figure 1 Comparison of wood chip sizes. (Sharer)
5

INSTRUMENTATION AND MEASUREMENTS
Most of the boiler performance and emissions test data were measured and recorded by a test team from Southern Company’s Generating Plant Performance group. The boiler was instrumented with thermocouple grids and gas extraction grids upstream and
downstream of both air preheaters. Temperatures and gas samples were taken three depths on four ports (24 test points). At each of the two air preheater gas outlet ducts, temperatures and gas samples were taken at two depths on four ports (16 test points).
Gas samples were analyzed with continuous analyzers for NOx, CO, CO2 and O2. Gas analysis and temperature data were
Figure 2 Air heater outlet test – fly ash measurement automatically recorded with a
data acquisition system.
Linear potentiometers were installed on each mill to measure the relative deflection of the mill journal with the various fuels. These instruments monitored the bed of fuel in the pulverizer bowls, and were recorded for each test. The mill 6 potentiometer system failed soon after testing started, but the other two provided good information.
Fig 3 Mill showing roller springs |
Fig 4 Linear potentiometer for monitoring |
|
roller displacement |
||
|
Standard plant operations data were also recorded
6
on the plant’s computerized Operator Information System (OIS) during the test period. Control room data recorded manually included pulverizer pressures, pulverizer control settings, and other relevant data not taken on the plant OIS system. The plant continuous emissions monitor (CEMS) recorded CO2, NOx, SO2, opacity, and gas flow at the stack. CEMS data were recorded on OIS.
Fuel samples were taken at the feeder of each of the three mills at the beginning, middle, and end of each 30 to 40 minute test. Bottom ash samples were collected from the furnace bottom at the conclusion of each test. Fly ash samples were taken each test from both air heater gas outlet ducts by traversing in a four port by three depth grid with a high volume fly ash probe.
RESULTS
In all, 55 performance and emissions tests were performed. Data were collected bearing on boiler efficiency, NOx and CO, emissions, and on unit operations.
Results of the testing at the power plant are summarized in Table 1
Analysis was performed on the data relating operating parameters. It should be noted that in these tests, excess oxygen (O2) was measured at the economizer outlet. Air leakage in the ductwork probably will cause the reported values to be somewhat higher than typical expected operating boiler O2 levels.
DISCUSSION
Wood Storage
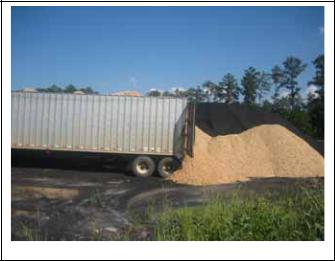
Between August 6 and August 12, 2007, wood chips were delivered in self unloading trailers to a section of the existing coal pile at Plant Gadsden. Each type of wood chip was stored uncovered, segregated in separate and well marked piles.
At the time of delivery, the wood had a very consistent moisture content of 50%. However, in September, 2007, despite a severe ongoing drought, the Gadsden area experienced several days of intense rain which thoroughly soaked the wood piles. Subsequent spot samples tested by the plant showed that many of the piles had a moisture
Fig 5 Wood chip delivery at Plant Gadsden7
Table 1: Test Results Summary
Test |
Wood |
Fuel Feeder |
Wood |
Est. |
Steam Flow |
|
CO |
NOx |
Opaci4ty |
AH Gas In |
AH Gas |
Econ out |
# |
Chip |
Rate |
Wt |
Wood |
(Klb/hr) |
|
(ppm) |
(lb/MMBtu) |
|
Temp (F) |
Out |
O2 |
|
Type |
|
% |
Btu % |
|
|
|
|
|
|
Temp (F) |
(% dry) |
1 |
Coal |
53.57 |
0 |
0 |
564.2 |
|
57 |
0.54 |
0.85 |
713.8 |
387.9 |
4.93 |
2 |
Coal |
54.16 |
0 |
0 |
562.4 |
|
274 |
0.45 |
0.60 |
678.5 |
382.7 |
3.76 |
3 |
Coal |
53.23 |
0 |
0 |
565.3 |
|
40 |
0.70 |
2.30 |
710.4 |
387.2 |
6.06 |
4 |
Coal |
33.54 |
0 |
0 |
340.2 |
|
894 |
0.36 |
-1.20 |
560.7 |
359.9 |
3.91 |
5 |
Coal |
34.06 |
0 |
0 |
338.0 |
|
53 |
0.46 |
-1.14 |
582.1 |
355.9 |
5.00 |
6 |
Coal |
34.03 |
0 |
0 |
344.6 |
|
38 |
0.58 |
-0.95 |
601.6 |
355.0 |
6.15 |
7 |
SFWT |
63.45 |
10 |
2.9 |
558.3 |
|
450 |
0.48 |
0.60 |
682.1 |
367.0 |
4.15 |
8 |
SFWT |
58.05 |
10 |
2.9 |
515.6 |
|
214 |
0.56 |
-0.20 |
674.2 |
371.6 |
5.29 |
9 |
SFWT |
57.02 |
10 |
2.9 |
510.9 |
|
1257 |
0.45 |
-0.35 |
648.1 |
370.8 |
4.06 |
10 |
SFWT |
55.15 |
10 |
2.9 |
513.9 |
|
123 |
0.78 |
3.58 |
696.8 |
378.0 |
7.20 |
11 |
SFWT |
37.60 |
10 |
2.9 |
335.6 |
|
2098 |
0.35 |
-1.15 |
550.8 |
358.2 |
4.12 |
12 |
SFWT |
35.68 |
10 |
2.9 |
335.3 |
|
51 |
0.71 |
-1.00 |
606.3 |
351.9 |
7.25 |
13 |
SFWT |
58.99 |
8 |
2.2 |
537.4 |
|
208 |
0.50 |
- |
657.5 |
367.7 |
4.56 |
14 |
SFWT |
60.58 |
8 |
2.2 |
544.5 |
|
124 |
0.85 |
- |
698.6 |
360.9 |
7.06 |
15 |
SFWT |
60.22 |
8 |
2.2 |
544.0 |
|
87 |
0.59 |
- |
675.2 |
358.1 |
5.58 |
16 |
SFWT |
64.29 |
8 |
2.2 |
569.5 |
|
111 |
0.50 |
- |
668.2 |
358.6 |
4.26 |
17 |
SFWT |
64.85 |
8 |
2.2 |
568.7 |
|
92 |
0.73 |
- |
703.2 |
365.8 |
6.14 |
18 |
SFWT |
63.23 |
8 |
2.2 |
570.0 |
|
162 |
0.50 |
1.90 |
668.4 |
357.6 |
4.47 |
19 |
SFWT |
63.41 |
8 |
2.2 |
549.1 |
|
23 |
0.75 |
1.70 |
695.9 |
366.8 |
6.16 |
20 |
SFWT |
62.70 |
8 |
2.2 |
546.1 |
|
26 |
0.73 |
2.13 |
696.6 |
367.6 |
6.10 |
21 |
SFWT |
38.24 |
8 |
2.2 |
330.7 |
|
1085 |
0.36 |
-0.78 |
547.7 |
346.4 |
4.02 |
22 |
LFWT |
61.61 |
15 |
4.4 |
495.6 |
|
44 |
0.56 |
1.45 |
660.0 |
352.7 |
4.97 |
23 |
LFWT |
61.53 |
15 |
4.4 |
498.9 |
|
57 |
0.68 |
1.50 |
692.8 |
357.8 |
6.28 |
24 |
LFWT |
61.56 |
15 |
4.4 |
495.3 |
|
84 |
0.82 |
1.80 |
711.1 |
363.5 |
7.41 |
25 |
LFWT |
42.70 |
15 |
4.4 |
333.0 |
|
33 |
0.77 |
-0.50 |
607.7 |
329.6 |
7.49 |
26 |
LFWT |
43.36 |
15 |
4.4 |
328.4 |
|
33 |
0.65 |
-0.21 |
586.4 |
330.0 |
6.48 |
27 |
Coal |
51.58 |
0 |
0 |
565.3 |
|
114 |
0.52 |
0.38 |
694.0 |
372.9 |
4.50 |
28 |
Coal |
52.02 |
0 |
0 |
567.3 |
|
128 |
0.52 |
0.80 |
695.3 |
374.6 |
4.44 |
29 |
Coal |
52.20 |
0 |
0 |
566.0 |
|
27 |
0.76 |
1.65 |
710.6 |
373.5 |
5.79 |
30 |
LFWT |
60.90 |
10 |
2.9 |
540.8 |
|
34 |
0.56 |
0.40 |
680.9 |
357.1 |
5.12 |
31 |
LFWT |
60.99 |
10 |
2.9 |
532.7 |
|
27 |
0.56 |
-0.39 |
672.9 |
355.7 |
5.02 |
32 |
LFWT |
62.70 |
10 |
2.9 |
537.3 |
|
55 |
0.81 |
1.15 |
712.6 |
361.7 |
7.12 |
33 |
LFWT |
42.83 |
10 |
2.9 |
345.4 |
|
1554 |
0.40 |
-1.60 |
557.0 |
357.8 |
4.23 |
34 |
LFWT |
43.07 |
10 |
2.9 |
347.9 |
|
41 |
0.66 |
-1.24 |
602.8 |
353.6 |
6.30 |
35 |
PWCT |
66.93 |
15 |
4.4 |
528.2 |
|
101 |
0.66 |
-0.25 |
676.0 |
346.3 |
4.88 |
36 |
PWCT |
51.06 |
15 |
4.4 |
393.3 |
|
695 |
0.57 |
-1.79 |
608.1 |
346.5 |
5.50 |
37 |
PWCT |
50.93 |
15 |
4.4 |
395.7 |
|
124 |
0.61 |
-2.07 |
600.5 |
347.0 |
5.13 |
38 |
PWCT |
43.67 |
15 |
4.4 |
333.6 |
|
315 |
0.51 |
-2.15 |
566.6 |
355.2 |
4.88 |
39 |
PWCT |
45.14 |
15 |
4.4 |
330.8 |
|
85 |
0.68 |
-1.91 |
595.3 |
351.9 |
6.52 |
40 |
SFCTC |
59.11 |
10 |
3.5 |
536.6 |
|
127 |
0.52 |
-0.58 |
675.2 |
360.3 |
4.55 |
41 |
SFCTC |
59.43 |
10 |
3.5 |
535.4 |
|
61 |
0.63 |
-0.85 |
685.8 |
360.9 |
5.48 |
42 |
SFCTC |
59.48 |
10 |
3.5 |
537.4 |
|
71 |
0.69 |
1.88 |
692.1 |
362.0 |
5.92 |
43 |
SFCTC |
39.08 |
10 |
3.5 |
327.2 |
|
147 |
0.50 |
-0.28 |
556.1 |
356.4 |
5.13 |
44 |
SFCTC |
39.24 |
10 |
3.5 |
332.9 |
|
32 |
0.70 |
-2.24 |
589.8 |
353.1 |
6.78 |
45 |
SFCTC |
63.60 |
15 |
5.5 |
537.9 |
|
42 |
0.54 |
-0.48 |
669.2 |
352.6 |
4.38 |
46 |
SFCTC |
63.34 |
15 |
5.5 |
537.6 |
|
73 |
0.65 |
0.13 |
685.4 |
358.2 |
5.37 |
47 |
SFCTC |
63.66 |
15 |
5.5 |
537.9 |
|
104 |
0.78 |
1.00 |
699.3 |
359.4 |
6.66 |
48 |
SFCTC |
41.48 |
15 |
5.5 |
335.9 |
|
26 |
0.72 |
-1.93 |
583.6 |
346.0 |
6.62 |
49 |
SFCTC |
43.63 |
15 |
5.5 |
341.6 |
|
44 |
0.54 |
-2.04 |
559.5 |
348.3 |
4.89 |
50 |
Coal |
51.83 |
0 |
0 |
550.4 |
|
144 |
0.50 |
-1.05 |
671.9 |
363.7 |
4.35 |
51 |
Coal |
51.65 |
0 |
0 |
555.0 |
|
93 |
0.60 |
-1.06 |
693.1 |
368.6 |
5.50 |
52 |
Coal |
52.05 |
0 |
0 |
545.9 |
|
146 |
0.73 |
-0.73 |
719.7 |
375.6 |
6.49 |
53 |
Coal |
31.53 |
0 |
0 |
319.7 |
|
42 |
0.67 |
|
577.1 |
375.0 |
6.01 |
54 |
Coal |
30.98 |
0 |
0 |
304.7 |
8 |
36 |
0.67 |
-1.94 |
575.6 |
375.3 |
6.05 |
55 |
Coal |
31.24 |
0 |
0 |
311.5 |
|
51 |
0.59 |
-2.07 |
566.0 |
381.1 |
5.46 |
|
|
|
|
|
|
|
|
|
|
|
|
|
Table 1: Test Results Summary (Continued)
Test # |
O2Wet |
Mill amps |
Mill Roller |
Amb Air |
Dry Gas |
Moisture |
Hydrogen |
Combust. |
Boiler Eff. |
Fuel HHV |
|
|
total |
meas (“) |
Temp (F) |
Loss (%) |
Loss (%) |
Loss (%) |
Loss (%) |
(%) |
AR (Btu/lb) |
1 |
4.34 |
255.4 |
4.160 |
90.9 |
8.31 |
0.54 |
3.98 |
1.58 |
84.91 |
11968 |
2 |
3.31 |
254.9 |
4.141 |
94.4 |
7.50 |
0.67 |
3.95 |
1.92 |
85.27 |
12111 |
3 |
5.33 |
253.8 |
4.150 |
95.4 |
8.85 |
0.57 |
3.96 |
1.20 |
84.71 |
12278 |
4 |
3.44 |
159.6 |
4.104 |
101.1 |
6.36 |
0.80 |
3.86 |
4.15 |
84.15 |
11557 |
5 |
4.40 |
157.5 |
4.085 |
100.3 |
6.84 |
0.65 |
3.80 |
2.32 |
85.75 |
11975 |
6 |
5.41 |
156.9 |
4.084 |
99.9 |
7.49 |
0.61 |
3.84 |
1.91 |
85.48 |
11920 |
7 |
3.66 |
284.9 |
4.474 |
87.1 |
7.18 |
1.03 |
3.99 |
3.43 |
83.69 |
11184 |
8 |
4.65 |
272.2 |
4.439 |
90.5 |
7.88 |
0.93 |
4.03 |
1.71 |
84.76 |
11898 |
9 |
3.57 |
270.7 |
4.430 |
93.9 |
6.92 |
1.08 |
4.01 |
2.76 |
84.48 |
11585 |
10 |
6.34 |
268.0 |
4.365 |
96.0 |
9.13 |
0.82 |
4.03 |
0.94 |
84.33 |
12112 |
11 |
3.63 |
174.1 |
4.346 |
102.7 |
6.13 |
0.90 |
3.99 |
4.21 |
84.02 |
11541 |
12 |
6.38 |
171.3 |
4.355 |
101.3 |
7.89 |
0.63 |
3.87 |
1.02 |
85.88 |
12461 |
13 |
4.02 |
263.7 |
4.378 |
91.0 |
7.31 |
1.01 |
3.92 |
2.15 |
84.93 |
11664 |
14 |
6.21 |
269.8 |
4.401 |
95.8 |
8.32 |
1.12 |
4.03 |
1.23 |
84.53 |
11258 |
15 |
4.91 |
272.2 |
4.425 |
102.0 |
7.25 |
1.00 |
3.95 |
1.94 |
85.10 |
11303 |
16 |
3.75 |
279.4 |
4.457 |
104.4 |
6.55 |
1.11 |
3.88 |
2.71 |
85.00 |
11358 |
17 |
5.40 |
283.7 |
4.496 |
106.3 |
7.63 |
1.09 |
3.91 |
1.77 |
84.79 |
11270 |
18 |
3.93 |
290.3 |
4.570 |
94.3 |
6.82 |
0.91 |
4.01 |
2.57 |
84.98 |
11934 |
19 |
5.42 |
290.4 |
4.612 |
103.3 |
7.79 |
1.06 |
3.89 |
1.32 |
85.15 |
11731 |
20 |
5.37 |
285.7 |
4.551 |
104.2 |
7.65 |
1.06 |
3.85 |
1.54 |
85.11 |
11564 |
21 |
3.53 |
170.1 |
4.427 |
108.0 |
5.57 |
0.92 |
3.76 |
4.76 |
84.23 |
11819 |
22 |
4.37 |
282.1 |
4.587 |
92.4 |
7.02 |
1.13 |
4.03 |
1.92 |
85.23 |
11420 |
23 |
5.53 |
287.9 |
4.650 |
91.8 |
7.87 |
1.37 |
4.01 |
1.84 |
84.19 |
11193 |
24 |
6.52 |
287.1 |
4.629 |
95.2 |
8.53 |
1.22 |
4.02 |
1.21 |
84.24 |
11348 |
25 |
6.59 |
191.9 |
4.587 |
102.8 |
7.23 |
1.21 |
4.01 |
1.49 |
85.31 |
11209 |
26 |
5.70 |
185.8 |
4.542 |
106.8 |
6.46 |
1.37 |
3.87 |
2.67 |
84.90 |
11015 |
27 |
3.96 |
260.8 |
4.195 |
83.8 |
7.47 |
0.44 |
3.92 |
3.16 |
84.39 |
11955 |
28 |
3.90 |
260.5 |
4.172 |
87.5 |
7.59 |
0.50 |
3.96 |
1.88 |
85.45 |
12390 |
29 |
5.10 |
258.8 |
4.158 |
90.4 |
8.21 |
0.51 |
3.94 |
1.28 |
85.45 |
12558 |
30 |
4.51 |
287.8 |
4.484 |
81.3 |
7.48 |
0.92 |
4.00 |
1.78 |
85.21 |
11843 |
31 |
4.42 |
294.4 |
4.522 |
84.8 |
7.32 |
0.99 |
3.98 |
1.83 |
85.27 |
11733 |
32 |
6.27 |
298.8 |
4.555 |
87.9 |
8.57 |
0.92 |
3.94 |
1.02 |
84.91 |
11851 |
33 |
3.72 |
255.6 |
4.407 |
92.1 |
6.29 |
0.88 |
4.01 |
2.73 |
85.38 |
11826 |
34 |
5.55 |
255.4 |
4.418 |
90.4 |
7.54 |
0.82 |
3.97 |
1.29 |
85.77 |
12109 |
35 |
4.30 |
301.2 |
4.540 |
79.4 |
7.18 |
1.07 |
4.04 |
2.18 |
84.85 |
11407 |
36 |
4.84 |
270.9 |
4.484 |
90.8 |
6.75 |
1.49 |
4.04 |
4.26 |
82.67 |
10312 |
37 |
4.51 |
267.3 |
4.419 |
93.2 |
6.54 |
1.39 |
4.00 |
2.84 |
84.57 |
10558 |
38 |
4.30 |
254.4 |
4.395 |
97.9 |
6.37 |
1.24 |
3.92 |
3.46 |
84.33 |
11010 |
39 |
5.74 |
247.0 |
4.203 |
97.4 |
7.19 |
1.35 |
4.06 |
3.12 |
83.56 |
10821 |
40 |
4.00 |
291.3 |
4.564 |
88.3 |
7.03 |
0.91 |
3.96 |
2.22 |
85.21 |
11622 |
41 |
4.82 |
290.5 |
4.562 |
92.3 |
7.50 |
0.98 |
4.00 |
1.78 |
85.03 |
11426 |
42 |
5.21 |
291.9 |
4.560 |
94.9 |
7.77 |
1.03 |
3.97 |
1.53 |
84.97 |
11385 |
43 |
4.51 |
239.1 |
4.365 |
105.3 |
6.33 |
0.99 |
3.89 |
2.64 |
85.47 |
11496 |
44 |
5.96 |
239.2 |
4.371 |
104.2 |
7.28 |
0.84 |
3.87 |
1.78 |
85.54 |
11819 |
45 |
3.86 |
293.7 |
4.628 |
92.9 |
6.69 |
0.88 |
3.89 |
3.42 |
84.43 |
11491 |
46 |
4.72 |
291.9 |
4.595 |
96.4 |
7.28 |
0.82 |
3.86 |
2.17 |
85.10 |
11851 |
47 |
5.86 |
291.1 |
4.581 |
100.1 |
7.89 |
1.30 |
3.92 |
1.94 |
84.14 |
11128 |
48 |
5.82 |
246.3 |
4.442 |
105.9 |
6.85 |
1.23 |
3.87 |
3.52 |
83.76 |
10665 |
49 |
4.30 |
249.4 |
4.456 |
107.1 |
6.34 |
1.23 |
3.88 |
2.77 |
85.04 |
11257 |
50 |
3.82 |
254.0 |
4.174 |
82.4 |
7.46 |
0.77 |
4.03 |
2.79 |
84.23 |
11701 |
51 |
4.84 |
254.8 |
4.170 |
83.6 |
8.18 |
0.62 |
3.92 |
1.66 |
84.83 |
11975 |
52 |
5.71 |
254.5 |
4.146 |
84.7 |
8.65 |
0.64 |
3.88 |
1.35 |
84.65 |
12035 |
53 |
5.29 |
218.7 |
4.019 |
93.7 |
|
|
|
|
|
- |
54 |
5.32 |
217.7 |
4.017 |
94.5 |
7.76 |
0.60 |
3.86 |
1.60 |
85.37 |
11966 |
55 |
4.80 |
217.8 |
4.016 |
96.8 |
7.60 |
0.68 |
3.90 |
2.70 |
84.33 |
11768 |
|
|
|
|
|
|
|
|
|
|
|
9
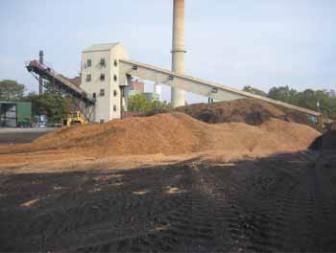
content between 60 and 70%. The exception was a clean wood chip sample, which was
|
in the vicinity of 47%. |
|
|
|
This suggested that the pine |
|
needles rather than the wood |
|
chips might be responsible for |
|
accumulating rain moisture. |
|
Two samples of whole wood |
|
chips were sorted by hand to |
|
separate needles and chips, |
|
which were then all tested for |
|
moisture content. The results, |
|
shown below, indicated that the |
|
needles absorb appreciably |
|
more of their weight in water |
Fig 6. Some of the wood chip storage piles during test |
than the wood chips. |
|
|
|
Sample 1 |
Sample 2 |
|
|
|
Mixed Sample |
64.1 |
56.17 |
Chips Component |
59 |
53.09 |
Needles Component |
69.73 |
63.85 |
Fig 7: Moisture Measurements of Rain Soaked Whole Tree Chips
Per cent wood
It was important in this study to know and control the concentration of wood in each test. Typically, in the past at other plants, these blends have been made by estimating volumes of coal and wood with a bulldozer. However, the Fuel Handling personnel at the plant developed a clever way of producing accurate and reproducible mixtures, using the two available coal reclaim feeders. A reclaim is basically a pit or hopper in the ground into which fuel is pushed from the fuel storage pile, where it is metered onto underground traveling conveyor belts. The amount of coal that is fed onto the belts is adjusted by a slide gate on the feeders. At the Gadsden Plant there are two reclaim feeders under the coal storage yard. For the biomass testing, one of the Gadsden reclaim feeder discharge gates was adjusted to allow wood flow to be controlled independently of the coal flow on the other feeder. The two reclaim feeders provide material flow to a single conveyor belt. Coal was initially loaded on the belt. As the belt then passed the wood reclaim feeder, wood was deposited on top of the coal on the belt.
The maximum rate of the belt was 400 tons/hr. The conveyor system is equipped with a belt scale to measure total weight on the belt at all times. When determining the desired
10