

Microsoft Windows XP Networking Inside Out
.pdf5: Advanced Networking
Part 5: Advanced Networking
Monitoring Network Performance
Network performance monitoring uses a variety of tools and techniques to detect issues with network speed and throughput. Performance monitoring can be performed diagnostically when performance issues have already been noted, or preventatively, by periodically sampling performance to detect trends and aid in planning.
tip Keep in mind that performance monitoring is not the same as troubleshooting network connectivity between hosts on your network or on the Internet. You can learn more about troubleshooting connectivity in Chapter 12, “Solving Connectivity Problems.”
21 Chapter
Understanding Bottlenecks
A bottleneck is a process, device, or other entity that is responsible for reducing performance. For example, if a computer’s network adapter has a hardware fault that causes it to process data slowly, and that computer receives hundreds of requests from network clients every minute, that network adapter will act as a bottleneck on the computer’s ability to serve data because the computer will have to wait for the adapter to service requests. Any computer component, service, or network component can become a bottleneck. In small networks, locating bottlenecks is often easy. In large networks, detection often becomes far more complex.
The Computer as a Network Bottleneck
When monitoring network performance to detect bottlenecks, don’t forget to consider the computer itself as a potential factor. For example, your Windows XP computer might have 128 MB of RAM and an older, slow CPU. Perhaps a printer is attached to the computer and shared over your network. Several folders containing important data are also shared over the network from the computer. You might start receiving reports from network users complaining about slow access to the computer. Most likely, they have to wait to open files, and printing documents on the shared printer is slow. Clearly, in this case, the bottleneck for opening these files and printing to this particular printer is that the computer is simply not powerful enough to serve large numbers of network requests.
If networking to a certain computer or service seems slow, always examine the computer providing the service. The computer’s hardware must be able keep up with the demands placed on it, and if demands exceed its power, the problem will appear to users as though the network is in slow motion. In fact, it is not the network at large,
598
5: Advanced Networking
Chapter 21: Monitoring Windows XP Network Performance
but the computer providing the data that is slow. Performance monitoring can include many factors, so always make sure you are looking at all parts of the picture when you are trying to determine the cause of a problem.
Detecting Bottlenecks with Windows XP Command-line Tools
Windows XP includes a number of command-line tools to diagnose local and remote network issues. These tools are covered in detail in “Using Command-line Tools Included in Windows XP,” page 345. Not only are these tools useful for determining whether computers or networks are functioning, but also for detecting network performance issues.
When a networking problem is first detected, it’s often wise to use Ping and PathPing to begin your troubleshooting process. By pinging a remote computer, you can determine the amount of time required for traffic to travel between the two computers. If this value seems large, you can isolate where the slowdown is taking place by using PathPing, which will ping every host that routes traffic between your computer and the remote target. If all hosts take a long time to respond, the problem most likely lies with your computer, your local network, or with your connection to the Internet. If, however, some hosts respond quickly and others do not, you can determine which are acting as bottlenecks on the particular connection you are trying to troubleshoot.
Netstat is also a powerful tool for network troubleshooting on individual computers. If networking in general on a particular system seems slow, or one network server application such as Internet Information Services (IIS) on a particular computer seems slow, Netstat can determine if that computer is being flooded with connections and requests, and can show which applications are serving each of those requests.
Using Windows Task Manager
Windows Task Manager is a Windows XP tool that enables you to start and stop tasks and processes. You can also get information about logged on users as well as gather some system and network performance statistics.
To launch Windows Task Manager, press Ctrl+Alt+Del. If Use The Welcome Screen is enabled in User Accounts in Control Panel, Windows Task Manager will appear. If it’s not enabled (or if you’re connected to a domain), the Windows Security dialog box will appear, and you’ll need to click its Task Manager button to open Windows Task Manager.
Chapter 21
599

5: Advanced Networking
Part 5: Advanced Networking
In Windows Task Manager, the Networking tab, shown in Figure 21-1, provides you with a real-time graph of network utilization. This allows you to view each network adapter and the percentage of network bandwidth it is consuming. You also see the link speed and its current state, such as operational or disconnected.
21 Chapter
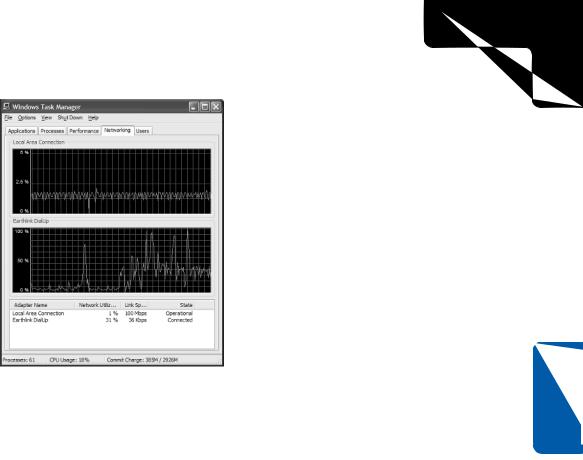
Figure 21-1. The Networking tab gives you real-time information about the bandwidth utilization of your network connections.
Normally, network utilization will fluctuate depending on the traffic on your network. If there is little network activity, the utilization will be low. If users are downloading large files from your computer, or you are using an application on another computer, the network utilization can be high. If utilization is consistently above 80 percent, you might have a bottleneck on your computer or on the network.
note The network utilization graphs only display network utilization used by adapters on your computer. They do not monitor the network as a whole and provide an independent view of total network bandwidth in use.
Aside from LAN connections, the Networking tab also displays Internet connections, VPN connections, and any other active connections found in the Network Connections folder. If several connections are active, the Networking tab divides into several graphical panes so that you can view the network utilization of all connections, This is shown in Figure 21-2.
600
Chapter 21: Monitoring Windows XP Network Performance
Figure 21-2. If several network connections are active, the Networking tab displays them all.
Aside from gathering basic information, some additional settings that you can use on the Networking tab are provided in the following list.
●If you choose View, Update Speed, you can change the speed of data refresh on the graph. The default speed is Normal, but if you want information to be updated more frequently on the graph, choose the High option.
●If you choose View, Network Adapter History, you can choose to see the network utilization in terms of traffic sent and received (in different colors) as well as the total traffic. By default, only the total is displayed. However, you might be able to gather more insight into network performance by comparing the incoming and outgoing traffic.
●If you choose View, Select Columns, shown in Figure 21-3 on the next page, you can select the data that is displayed on the Network tab. By default, you see the network adapter name, network utilization, link speed, and state. However, there are a number of additional columns that you can display including bytes sent and received. If you want
to use any of the additional columns, select the desired columns and click OK.
5: Advanced Networking
Chapter 21
601

5: Advanced Networking
21 Chapter
Part 5: Advanced Networking
Figure 21-3. You can display additional information by selecting the columns you want to view.
The Windows Task Manager Performance tab gives you information about CPU and page file use as well as current memory utilization, as shown in Figure 21-4. If you are having general performance problems on your computer, or you believe that the computer is too busy to properly service network requests, examine the Performance tab. Consistently high readings indicate that the CPU or memory is unable to meet the demands placed on it, or some program or process is consuming CPU cycles and memory. In the latter case, you can also look on the Application and Processes tabs for more information about any programs or processes that are consuming too
many resources.
Figure 21-4. The Performance tab displays statistics about CPU usage and page file usage history as well as memory use.
602
5: Advanced Networking
Chapter 21: Monitoring Windows XP Network Performance
Using the Performance Tool
Windows XP includes a more advanced performance monitoring tool simply called Performance. The Performance tool has been around since the days of Microsoft Windows NT, but the full version of the product is included in both Microsoft Windows XP Professional and Microsoft Windows XP Home Edition. The Performance tool provides you with real-time information about different performance objects, such as the system paging file, the CPU, network interfaces, physical disks, and other system objects.
A performance object is a category of performance monitoring. Under each performance object, performance counters are available to monitor different portions of the performance object. For example, the performance object Memory includes performance counters such as page reads per second, page writes per second, and available bytes. To monitor a counter, select the counter and the objects you want to monitor, and then collect data about those counters. Once that data has been collected, you can analyze the data to make a decision about what action, if any, needs to be taken to increase performance.
Starting Performance
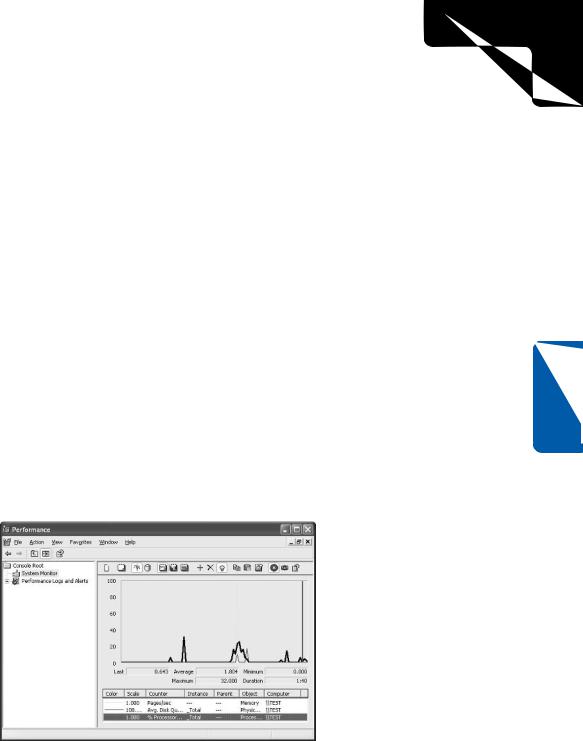
The Performance tool is a Microsoft Management Console (MMC) snap-in located in the Administrative Tools folder in Control Panel. When you start Performance, you see a two-paned view. The snap-in contains the console root in the left pane. The right pane displays a chart view and the counters that are currently being monitored, as shown in Figure 21-5.
Chapter 21
Figure 21-5. Performance is an MMC snap-in that displays a chart view by default.
603

5: Advanced Networking
21 Chapter
Part 5: Advanced Networking
Along the top of the chart window, you see a toolbar that contains buttons for the following items:
Button |
Name |
Function |
|
New |
This option clears any counters that are currently |
|
Counter Set |
being monitored. You can then add new counters. |
|
Clear Display |
This option clears the existing display so that monitor- |
|
|
ing begins again. |
|
View Current |
This option, enabled by default, views current activity. |
|
Activity |
|
|
View Log Data |
You can record a log file of any counter sessions and |
|
|
then open it to view past performance. |
|
View Graph |
This option, enabled by default, shows a graphical |
|
|
view of all current performance counters. |
|
View |
You can view the counter data in a histogram format |
|
Histogram |
rather than a chart format. |
|
View Report |
You can view counter data in a report format rather |
|
|
than a chart format. |
|
Add |
This option adds counters to the chart/histogram/ |
|
|
report. |
|
Delete |
You can select a counter in the counter list and delete |
|
|
the counter from the current counter set. |
|
Highlight |
You can select a counter and then highlight it in the |
|
|
graph by clicking this button. |
|
Copy |
You can copy the properties of a selected counter list |
|
Properties |
for pasting into a different counter set. |
|
Paste |
You can paste any copied counter properties from one |
|
Counter List |
counter set to another. |
|
Properties |
Opens the System Monitor Properties dialog box, |
|
|
which lets you set general properties for the Perfor- |
|
|
mance snap-in. |
|
Freeze Display |
This option freezes all activity so that you can analyze |
|
|
the current view. |
|
Update Data |
This option becomes enabled if you have frozen the |
|
|
data. Click the button to start recording data again. |
|
Help |
Get help with Performance topics. |
604

5: Advanced Networking
Chapter 21: Monitoring Windows XP Network Performance
Creating a Counter Set
To create a counter set, you must first identify what you want to monitor. For example, suppose that your computer becomes congested with network requests. Users complain that accessing shared information on your computer is slow, and you notice that access to shared resources from your computer is also slow. Once you have identified the problem, follow these steps to create a new counter set containing the objects and counters that you want to monitor:
1In Performance, ensure that System Monitor is selected in the left pane of the console.
2In the right pane, click the New Counter Set button, and then click the Add button.
3The Add Counters dialog box appears, as shown here. Notice at the top of the dialog box that you can monitor the local computer or another computer on your network by entering the UNC path. Choose a performance object category from the Performance Object list. The available counters for the object appear in the Select Counters From List box. If the performance object you chose has more than one instance, choose an instance from the list in the right portion of the Add Counters dialog box. For example, the Network Interface object will have an instance for each network adapter you have installed.
Chapter 21
4Select All Counters if you want to monitor all counters in a performance object. Each performance object can include many counters, so you’ll probably want to click Select Counters From List instead and select specific counters from the list. You can click Add after each counter you select, or you can press
605
5: Advanced Networking
Part 5: Advanced Networking
21 Chapter
Ctrl, click multiple counters, and then click Add. Each time you click Add, the counters are immediately activated and monitoring begins in Performance. You can keep the Add Counters dialog box open and add additional counters.
tip If you are not sure what a counter does, click the Explain button and a message box with an explanation will appear.
note You’re not limited to adding counters from a single performance object. At any time, you can select a new performance object from the Performance Object list and then select counters for that object. When you click Add, they will be displayed in addition to any counters you’ve selected from other performance objects.
5 When you have added all the necessary counters, click the Close button.
tip Limiting the Counters to Monitor
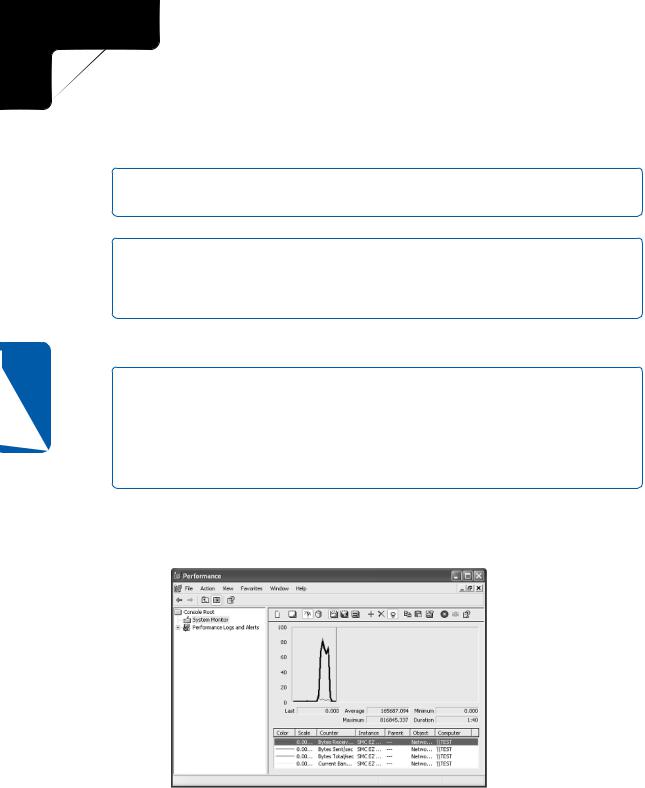
It is important that you only use those counters that you think will help you examine possible performance problems. Adding nonessential counters to the chart, histogram, or report is often more confusing than helpful. Try monitoring a few counters at a time and eliminate the counters that are not giving you any useful data so that you can locate issues that might be causing network performance problems.
In Figure 21-6, several counters from the Network Interface performance object are being monitored. You can switch between chart, histogram, and report view as you examine the data.
Figure 21-6. The counters you selected now appear in the chart area.
606
5: Advanced Networking
Chapter 21: Monitoring Windows XP Network Performance
tip Customize the Performance Display
As you are using System Monitor in Performance, remember that you can click the Properties button and adjust the appearance of charts and histograms as well as the colors that are used to represent the counters. The properties dialog box options are self-explanatory and customizing them might make your chart and histogram easier to interpret.
Logging Data
One difficulty when using the Performance tool is that its usefulness depends on the quality and quantity of data you gather. Monitoring counters for a few minutes will likely not give you a true picture of any performance issues and problems being experienced on your network. If you need to gather data over a certain period of time, such as several hours or even a day, you can log the data, and then open the log file in Performance at a later time. The following steps show you how to create a log file.
1Select Performance Logs And Alerts in the left pane of the console. Rightclick Counter Logs in the right pane and choose New Log Settings.
2In the New Log Settings dialog box that appears, enter a name for the log and click OK.
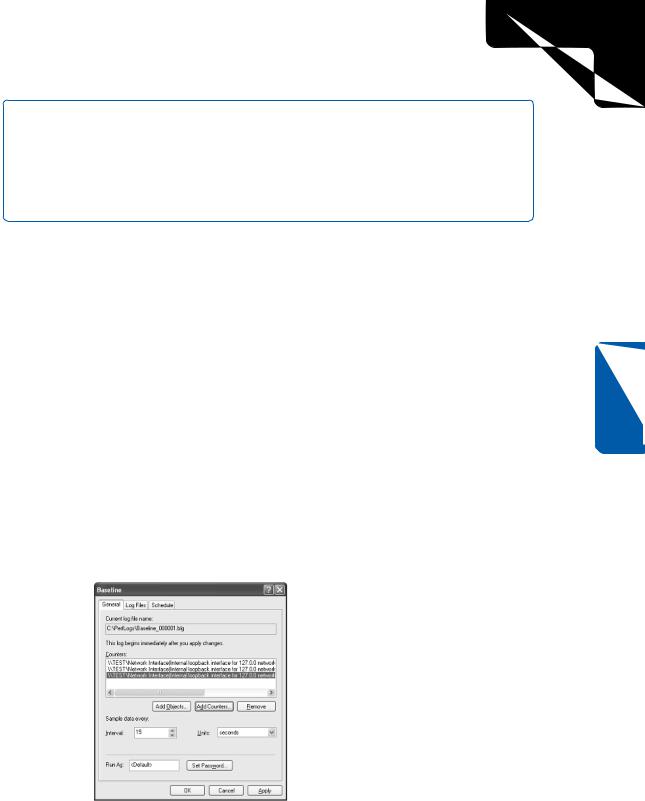
3The properties dialog box for the new log file appears, as shown next. On the General tab, you see the current name and location of the log file, which is stored in C:\Perflogs in a default Windows XP installation. Use the Add Objects and Add Counters buttons to add the counters and objects you want to log. By default, data is sampled every 15 minutes, but you can increase or decrease this value as desired. You can also set an administrative password to prevent access to the log files.
Chapter 21
607