

22.12.11
.docx
|
Dependent Variable: Y |
|
|
||
|
Method: Least Squares |
|
|
||
|
Date: 12/22/11 Time: 10:27 |
|
|
||
|
Sample: 1 33 |
|
|
|
|
|
Included observations: 33 |
|
|
||
|
|
|
|
|
|
|
|
|
|
|
|
|
Variable |
Coefficient |
Std. Error |
t-Statistic |
Prob. |
|
|
|
|
|
|
|
|
|
|
|
|
|
X |
5.577356 |
0.281428 |
19.81808 |
0.0000 |
|
C |
346.3549 |
158.5970 |
2.183868 |
0.0367 |
|
|
|
|
|
|
|
|
|
|
|
|
|
R-squared |
0.926845 |
Mean dependent var |
3369.603 |
|
|
Adjusted R-squared |
0.924485 |
S.D. dependent var |
906.7583 |
|
|
S.E. of regression |
249.1773 |
Akaike info criterion |
13.93290 |
|
|
Sum squared resid |
1924769. |
Schwarz criterion |
14.02360 |
|
|
Log likelihood |
-227.8928 |
Hannan-Quinn criter. |
13.96342 |
|
|
F-statistic |
392.7562 |
Durbin-Watson stat |
0.978581 |
|
|
Prob(F-statistic) |
0.000000 |
|
|
|
|
|
|
|
|
|
|
|
|
|
|
|
|
Dependent Variable: Y |
|
|
||||||
|
Method: Least Squares |
|
|
||||||
|
Date: 12/22/11 Time: 10:31 |
|
|
||||||
|
Sample (adjusted): 4 33 |
|
|
||||||
|
Included observations: 30 after adjustments |
|
|||||||
|
|
|
|
|
|
|
|||
|
|
|
|
|
|
|
|||
|
Variable |
Coefficient |
|
Std. Error |
t-Statistic |
Prob. |
|||
|
|
|
|
|
|
|
|||
|
|
|
|
|
|
|
|||
|
C |
317.3714 |
|
86.74078 |
3.658849 |
0.0011 |
|||
|
PDL01 |
1.563345 |
|
0.085461 |
18.29310 |
0.0000 |
|||
|
PDL02 |
-0.217722 |
|
0.145095 |
-1.500545 |
0.1451 |
|||
|
|
|
|
|
|
|
|||
|
|
|
|
|
|
|
|||
|
R-squared |
0.982284 |
|
Mean dependent var |
3508.893 |
||||
|
Adjusted R-squared |
0.980972 |
|
S.D. dependent var |
828.4528 |
||||
|
S.E. of regression |
114.2782 |
|
Akaike info criterion |
12.40979 |
||||
|
Sum squared resid |
352607.0 |
|
Schwarz criterion |
12.54991 |
||||
|
Log likelihood |
-183.1468 |
|
Hannan-Quinn criter. |
12.45461 |
||||
|
F-statistic |
748.5376 |
|
Durbin-Watson stat |
0.787339 |
||||
|
Prob(F-statistic) |
0.000000 |
|
|
|
|
|||
|
|
|
|
|
|
|
|||
|
|
|
|
|
|
|
|||
|
Lag Distribution of X |
|
i |
Coefficient |
Std. Error |
t-Statistic |
|||
|
|
|
|
|
|
|
|||
|
|
|
|
|
|
|
|||
|
. *| |
|
0 |
1.78107 |
0.22505 |
7.91408 |
|||
|
. * | |
|
1 |
1.56335 |
0.08546 |
18.2931 |
|||
|
. * | |
|
2 |
1.34562 |
0.07788 |
17.2789 |
|||
|
. * | |
|
3 |
1.12790 |
0.21664 |
5.20642 |
|||
|
|
|
|
|
|
|
|||
|
|
|
|
|
|
|
|||
|
|
Sum of Lags |
|
5.81794 |
0.15079 |
38.5842 |
|||
|
|
|
|
|
|
|
|||
|
|
|
|
|
|
|
|||
|
Dependent Variable: Y |
|
|
||||||
|
Method: Least Squares |
|
|
||||||
|
Date: 12/22/11 Time: 10:32 |
|
|
||||||
|
Sample (adjusted): 4 33 |
|
|
||||||
|
Included observations: 30 after adjustments |
|
|||||||
|
|
|
|
|
|
|
|||
|
|
|
|
|
|
|
|||
|
Variable |
Coefficient |
|
Std. Error |
t-Statistic |
Prob. |
|||
|
|
|
|
|
|
|
|||
|
|
|
|
|
|
|
|||
|
C |
287.9856 |
|
80.46967 |
3.578809 |
0.0014 |
|||
|
PDL01 |
1.037760 |
|
0.227178 |
4.568047 |
0.0001 |
|||
|
PDL02 |
-0.735781 |
|
0.248778 |
-2.957582 |
0.0065 |
|||
|
PDL03 |
0.532982 |
|
0.216219 |
2.465006 |
0.0206 |
|||
|
|
|
|
|
|
|
|||
|
|
|
|
|
|
|
|||
|
R-squared |
0.985640 |
|
Mean dependent var |
3508.893 |
||||
|
Adjusted R-squared |
0.983983 |
|
S.D. dependent var |
828.4528 |
||||
|
S.E. of regression |
104.8464 |
|
Akaike info criterion |
12.26644 |
||||
|
Sum squared resid |
285812.1 |
|
Schwarz criterion |
12.45326 |
||||
|
Log likelihood |
-179.9965 |
|
Hannan-Quinn criter. |
12.32620 |
||||
|
F-statistic |
594.8719 |
|
Durbin-Watson stat |
0.969545 |
||||
|
Prob(F-statistic) |
0.000000 |
|
|
|
|
|||
|
|
|
|
|
|
|
|||
|
|
|
|
|
|
|
|||
|
Lag Distribution of X |
|
i |
Coefficient |
Std. Error |
t-Statistic |
|||
|
|
|
|
|
|
|
|||
|
|
|
|
|
|
|
|||
|
. *| |
|
0 |
2.30652 |
0.29677 |
7.77210 |
|||
|
. * | |
|
1 |
1.03776 |
0.22718 |
4.56805 |
|||
|
. * | |
|
2 |
0.83496 |
0.21914 |
3.81017 |
|||
|
. * | |
|
3 |
1.69812 |
0.30499 |
5.56787 |
|||
|
|
|
|
|
|
|
|||
|
|
|
|
|
|
|
|||
|
|
Sum of Lags |
|
5.87737 |
0.14043 |
41.8539 |
|||
|
|
|
|
|
|
|
|||
|
|
|
|
|
|
|
|||
|
Dependent Variable: Y |
|
|
|||||
|
Method: Least Squares |
|
|
|||||
|
Date: 12/22/11 Time: 10:49 |
|
|
|||||
|
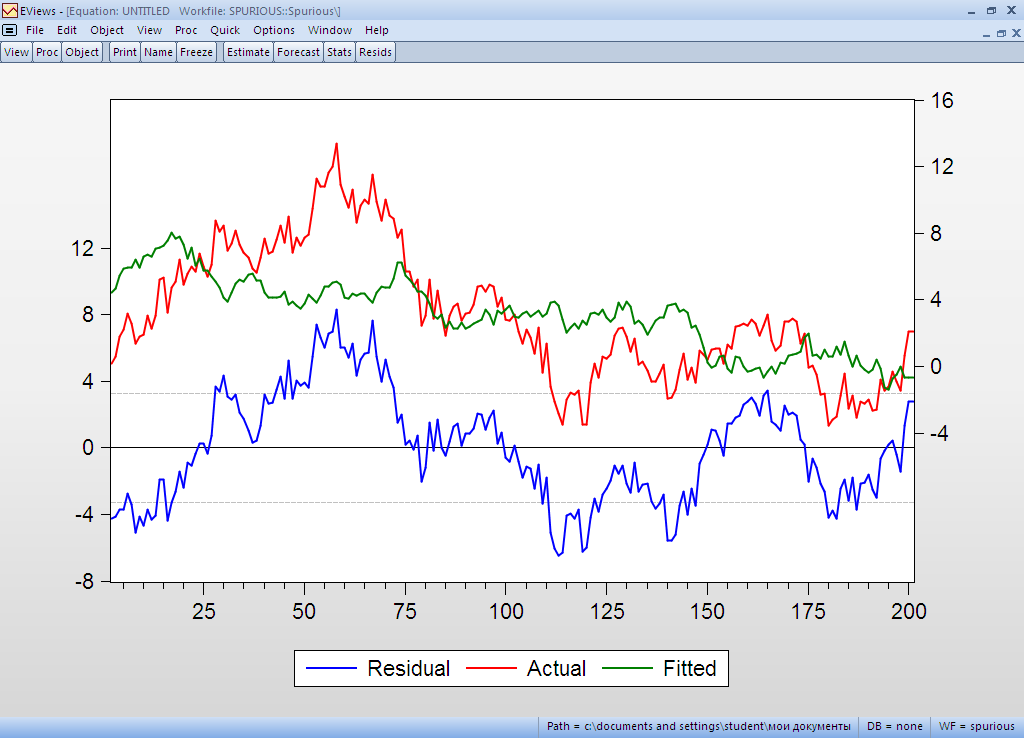
Sample: 2 201 |
|
|
|
||||
|
Included observations: 200 |
|
|
|||||
|
|
|
|
|
|
|||
|
|
|
|
|
|
|||
|
Variable |
Coefficient |
Std. Error |
t-Statistic |
Prob. |
|||
|
|
|
|
|
|
|||
|
|
|
|
|
|
|||
|
X |
-0.443483 |
0.047330 |
-9.370096 |
0.0000 |
|||
|
C |
3.909709 |
0.246185 |
15.88120 |
0.0000 |
|||
|
|
|
|
|
|
|||
|
|
|
|
|
|
|||
|
R-squared |
0.307205 |
Mean dependent var |
3.117509 |
||||
|
Adjusted R-squared |
0.303706 |
S.D. dependent var |
3.918582 |
||||
|
S.E. of regression |
3.269832 |
Akaike info criterion |
5.217304 |
||||
|
Sum squared resid |
2116.976 |
Schwarz criterion |
5.250287 |
||||
|
Log likelihood |
-519.7304 |
Hannan-Quinn criter. |
5.230652 |
||||
|
F-statistic |
87.79871 |
Durbin-Watson stat |
0.133080 |
||||
|
Prob(F-statistic) |
0.000000 |
|
|
|
|||
|
Null Hypothesis: RESID01 has a unit root |
|
|||||
|
Exogenous: Constant |
|
|
||||
|
Lag Length: 1 (Automatic - based on SIC, maxlag=14) |
||||||
|
|
|
|
|
|
||
|
|
|
|
|
|
||
|
|
|
|
t-Statistic |
Prob.* |
||
|
|
|
|
|
|
||
|
|
|
|
|
|
||
|
Augmented Dickey-Fuller test statistic |
-2.139288 |
0.2296 |
||||
|
Test critical values: |
1% level |
|
-3.463405 |
|
||
|
|
5% level |
|
-2.875972 |
|
||
|
|
10% level |
|
-2.574541 |
|
||
|
|
|
|
|
|
||
|
|
|
|
|
|
||
|
*MacKinnon (1996) one-sided p-values. |
|
|||||
|
|
|
|
|
|
||
|
|
|
|
|
|
||
|
Augmented Dickey-Fuller Test Equation |
|
|||||
|
Dependent Variable: D(RESID01) |
|
|||||
|
Method: Least Squares |
|
|
||||
|
Date: 12/22/11 Time: 10:55 |
|
|
||||
|
Sample (adjusted): 4 201 |
|
|
||||
|
Included observations: 198 after adjustments |
|
|||||
|
|
|
|
|
|
||
|
|
|
|
|
|
||
|
Variable |
Coefficient |
Std. Error |
t-Statistic |
Prob. |
||
|
|
|
|
|
|
||
|
|
|
|
|
|
||
|
RESID01(-1) |
-0.054524 |
0.025487 |
-2.139288 |
0.0337 |
||
|
D(RESID01(-1)) |
-0.232328 |
0.069473 |
-3.344132 |
0.0010 |
||
|
C |
0.043393 |
0.081563 |
0.532015 |
0.5953 |
||
|
|
|
|
|
|
||
|
|
|
|
|
|
||
|
R-squared |
0.088284 |
Mean dependent var |
0.034727 |
|||
|
Adjusted R-squared |
0.078933 |
S.D. dependent var |
1.195323 |
|||
|
S.E. of regression |
1.147178 |
Akaike info criterion |
3.127522 |
|||
|
Sum squared resid |
256.6233 |
Schwarz criterion |
3.177344 |
|||
|
Log likelihood |
-306.6247 |
Hannan-Quinn criter. |
3.147689 |
|||
|
F-statistic |
9.441205 |
Durbin-Watson stat |
2.004089 |
|||
|
Prob(F-statistic) |
0.000122 |
|
|
|
||
|
|
|
|
|
|
||
|
|
|
|
|
|
||