ЛАБ 2 1
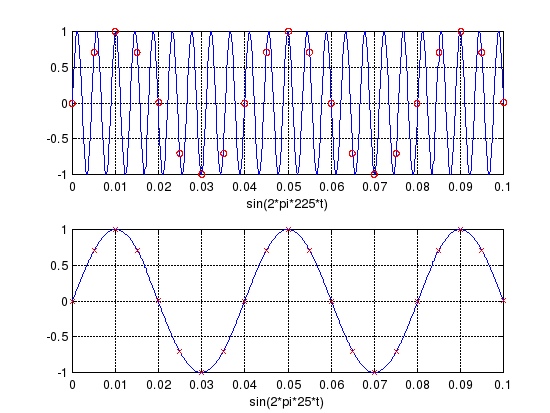
t=0:0.0001:2*0.05;
t1=0:0.005:2*0.05;
x=sin(2*pi*225*t);
y=sin(2*pi*25*t);
x1=sin(2*pi*225*t1);
y1=sin(2*pi*25*t1);
subplot(211); plot(t,x,t1,x1,'or'),
xlabel('sin(2*pi*225*t)'),grid;
subplot(212); plot(t,y,t1,x1,'xr'),
xlabel('sin(2*pi*25*t)'),grid
2
clear;
clf
vd1=3*275;
vd2=1.5*275;
t1=0:1/vd1:0.2;
t2=0:1/vd2:0.2;
f1=sin(2*pi*275*t1);
F1=fft(f1);
f2=sin(2*pi*275*t2);
F2=fft(f2);
f1shift=fftshift(F1);
f2shift=fftshift(F2);
P1=f1shift.*conj(f1shift);
P2=f2shift.*conj(f2shift);
w1=-vd1/2:vd1/length(t1):vd1/2-1/length(t1);
w2=-vd2/2:vd2/length(t2):vd2/2-1/length(t2);
subplot(211); plot(w1,P1);xlabel('fd=3*275');
subplot(212); plot(w2,P2);xlabel('fd=1.5*275')
3
clf;
k=20;
T=0.1;
tnn=0.01;
tm=k*T;
tn=-tm:tnn:tm;
td=-tm:T:tm;
q=sin(2*pi*tn);
qq=2*sin(2*pi*3*tn);
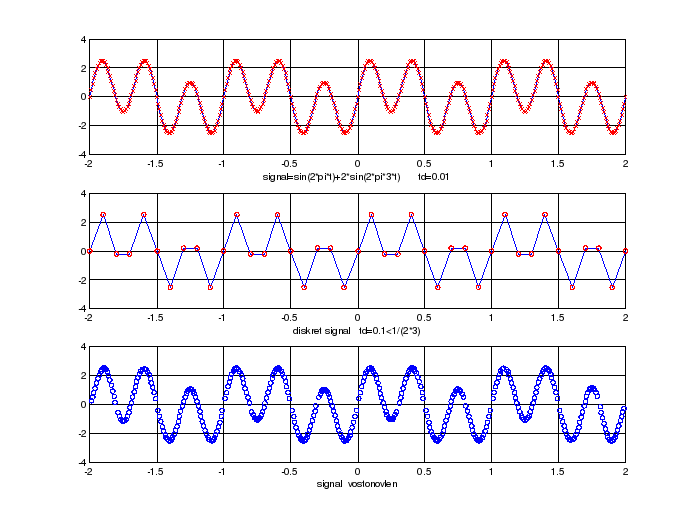
x=sin(2*pi*tn)+2*sin(2*pi*3*tn);
x1=sin(2*pi*td)+2*sin(2*pi*3*td);
subplot(311);
plot(tn,x,tn,x,'xr'), xlabel('signal=sin(2*pi*t)+2*sin(2*pi*3*t) td=0.01'),grid ;
subplot(312); plot(td,x1,td,x1,'or'), xlabel('diskret signal td=0.1<1/(2*3)'),grid
xt=zeros(size(tn));
for n=-k:k;
z=x1(n+k+1)*sin((pi/T)*(tn-n*T))./((pi/T)*(tn-n*T));
xt=xt+z;
end;
subplot(313); plot(tn,xt,'o');xlabel('signal vostonovlen') ; grid