

I N T E R N A T I O N A L E N E R G Y A G E N C Y
KEY WORLD
ENERGY
STATISTICS
2005


KEY WORLD
ENERGY
STATISTICS
S
T
A
T
I
S
T
I
C
S

|
IEA participating |
|
countries are |
|
Australia |
|
Austria |
|
Belgium |
|
Canada |
|
Czech Republic |
|
Denmark |
|
Finland |
|
France |
|
Germany |
|
Greece |
|
Hungary |
|
Ireland |
|
Italy |
|
Japan |
|
Korea |
|
Luxembourg |
|
Netherlands |
|
New Zealand |
|
Norway |
|
Portugal |
|
Spain |
|
Sweden |
|
Switzerland |
|
Turkey |
|
United Kingdom |
2 |
United States |
|
|
|
|

The International
Energy Agency
The IEA, which was established in November 1974, has over the years gained recognition as one of the world’s most authoritative sources for energy statistics. Its massive annual studies of oil, natural gas, coal and electricity are indispensable tools for energy policy makers, companies involved in the energy field and scholars.
In 1997 the IEA produced a handy, pocket-sized summary of key energy data. This new edition responds to the enormously positive reaction to the books over the last years. Key World Energy Statistics from the IEA contains timely, clearlypresented data on the supply, transformation and consumption of all major energy sources. The interested businessman, journalist or student will have at his fingertips the annual American production of coal, the electricity consumption in Thailand, the price of diesel oil in South Africa and thousands of other useful energy facts.
Gathering and analysing statistics is one of the IEA’s important functions. But the Agency – an autonomous body within the Organisation for Economic Co-operation and Development – also:
■administers a plan to guard Member countries against the risk of a major disruption of oil supplies;
■coordinates national efforts to conserve energy and develop alternative energy sources, as well as to limit pollution and energy-related climate change;
■disseminates information on the world energy market and seeks to promote stable international trade in energy.
3

TABLE
TABLE
TABLE
OF
OF OF
CONTENTS CONTENTS
CONTENTS

SUPPLY
TRANSFORMATION
CONSUMPTION
ENERGY BALANCES
PRICES
EMISSIONS
OUTLOOK
ENERGY INDICATORS
CONVERSION FACTORS
1
2
3
4
5
6
7
8
9
GLOSSARY |
10 |
S U P P L Y
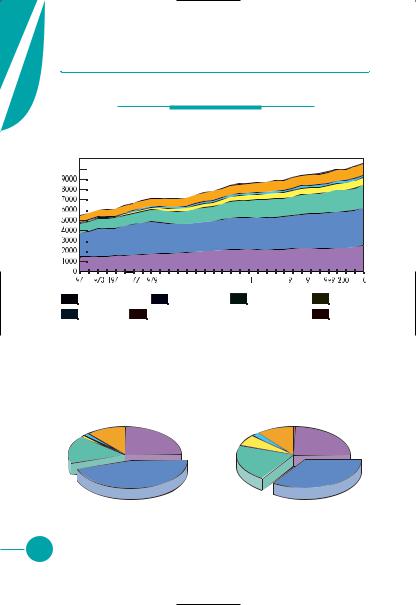
TOTAL PRIMARY ENERGY SUPPLY
The World
Evolution from 1971 to 2003 of World Total Primary Energy Supply* by Fuel (Mtoe)
11000
10000
1 |
|
|
|
5 |
19 |
1981 |
1983 |
1985 |
1987 1989 |
991 |
1993 1 |
95 |
1 |
97 |
1 |
|
|
|
1 |
20 |
3 |
|
||||||||
|
|
|
Coal |
|
|
|
|
|
|
Oil |
|
|
|
|
Gas |
|
|
|
|
|
|
|
Nuclear |
|
|
|||||
|
|
|
|
|
|
|
|
|
|
|
|
|
|
|
|
|
|
|
|
|||||||||||
|
|
|
|
|
|
|
|
|
|
|
|
|
|
|
|
|
|
|
|
|||||||||||
|
|
|
Hydro |
|
|
Combustible Renewables & Waste |
|
|
|
|
|
|
Other** |
|
|
|||||||||||||||
|
|
|
|
|
|
|
|
|
|
|
|
|
||||||||||||||||||
|
|
|
|
|
|
|
|
|
|
|
|
|
||||||||||||||||||
|
|
|
1973 and 2003 Fuel Shares of TPES* |
|
|
|
||||||||||||||||||||||||
|
|
|
|
|
|
|
|
|
|
|
|
|
|
|
|
|
|
|
|
|
|
|
|
|
||||||
|
|
|
|
|
1973 |
|
|
|
|
|
|
|
|
|
|
|
2003 |
|
|
|
|
|
|
|
||||||
|
|
|
|
|
Combustible |
|
|
|
|
|
|
|
|
|
|
Combustible |
|
|
|
|
|
|
|
|
|
|
||||
|
|
|
|
|
|
|
|
|
|
|
|
|
|
|
Renewables |
|
|
|
|
|
|
|
|
|
|
|||||
|
Hydro |
Renewables |
|
|
|
|
|
|
|
Hydro |
|
Other** |
|
|
|
|
||||||||||||||
|
Other** |
|
|
|
& Waste |
|
|
|
|
|
|
|||||||||||||||||||
1.8% |
|
& Waste |
|
|
2.2% |
10.8% |
|
|
|
0.5% |
|
|
|
|
|
|||||||||||||||
|
0.1% |
|
|
|
|
|
|
|
Coal |
|
|
|||||||||||||||||||
uclear |
11.2% |
|
|
Coal |
|
Nuclear |
|
|
|
|
|
|
|
|
|
|
|
|
||||||||||||
|
|
|
|
|
|
|
|
6.5% |
|
|
|
|
|
|
|
|
|
|
|
24.4 % |
|
|
||||||||
.9% |
|
|
|
|
|
|
|
|
|
|
24.8% |
|
|
|
|
|
|
|
|
|
|
|
|
|
||||||
|
|
|
|
|
|
|
|
|
|
|
|
|
|
|
|
|
|
|
|
|
|
|
|
|
|
|
||||
atural |
|
|
|
|
|
|
|
|
|
Natural |
|
|
|
|
|
|
|
|
|
|
|
|
|
|
||||||
|
|
|
|
|
|
|
|
|
|
|
|
|
|
Gas |
|
|
|
|
|
|
|
|
|
|
|
|
|
|
||
2% |
|
|
|
|
|
|
|
|
|
|
|
|
21.2% |
|
|
|
|
|
|
|
|
|
|
|
|
|
|
|
||
|
|
|
|
|
|
|
|
|
|
|
|
Oil |
|
|
|
|
|
|
|
|
|
|
|
|
|
|
|
Oil |
||
|
|
|
|
|
|
|
|
|
|
|
|
45.0% |
|
|
|
|
|
|
|
|
|
|
|
|
|
|
34.4% |
|||
|
|
|
|
|
|
|
|
|
|
|
|
|
|
|
|
|
|
|
||||||||||||
|
|
|
|
|
6 034 Mtoe |
|
|
|
|
|
|
|
10 579 Mtoe |
|
|
|
|
|
||||||||||||
|
*Excludes international marine bunkers and electricity trade. |
6 |
**Other includes geothermal, solar, wind, heat, etc. |
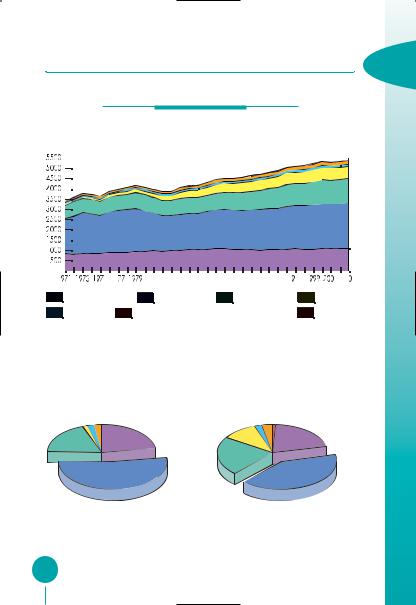
BY FUEL |
1 |
|
The OECD |
from 1971 to 2003 of OECD Total Primary Energy Supply* by Fuel (Mtoe)
|
|
|
|
|
5 |
9 |
98 |
983 |
985 |
987 |
989 |
|
99 |
993 |
995 |
97 |
|
20 |
3 |
||||||
|
|
|
Coal |
|
|
|
|
|
|
Oil |
|
|
|
|
Gas |
|
|
|
|
Nuclear |
|
||||
|
|
|
|
|
|
|
|
|
|
|
|
|
|
|
|
|
|||||||||
|
|
|
|
|
|
|
|
|
|
|
|
|
|
|
|
|
|||||||||
|
|
|
Hydro |
|
|
Combustible Renewables & Waste |
|
|
|
|
Other** |
|
|||||||||||||
|
|
|
|
|
|
|
|
|
|
||||||||||||||||
|
|
|
|
|
|
|
|
|
|
||||||||||||||||
|
|
|
1973 and 2003 Fuel Shares of TPES* |
|
|||||||||||||||||||||
|
|
|
|
|
|
|
|
|
|
|
|
|
|
|
|
|
|
|
|
|
|||||
|
|
|
|
|
1973 |
|
|
|
|
|
|
|
|
|
|
2003 |
|
|
|
|
|||||
|
Hydro |
Combustible |
|
|
|
|
|
|
|
|
|
Combustible |
|
|
|
|
|
|
|||||||
|
Renewables |
|
|
|
|
|
|
Hydro |
Renewables |
|
|
|
|
|
|
||||||||||
2.1% |
|
& Waste |
Other** |
|
|
|
2.0% |
|
|
& Waste |
Other** |
|
|
|
|||||||||||
|
|
|
r |
2.3% |
|
|
|
Nuclear |
|
3.3% |
|
|
|
||||||||||||
|
|
|
|
|
|
|
|
0.1% |
|
|
|
|
|
|
|
0.8% |
|
|
Coal |
|
|||||
|
|
|
|
|
|
|
|
|
|
|
Coal |
|
10.7% |
|
|
|
|
|
|
|
|
|
|
||
|
|
|
|
|
|
|
|
|
|
|
22.4% |
|
|
|
|
|
|
|
|
|
|
|
20.5% |
|
|
1 |
|
|
|
|
|
|
|
|
|
|
|
|
Gas |
|
|
|
|
|
|
|
|
|
|
|
|
|
|
|
|
|
|
|
|
|
|
|
Oil |
22.0% |
|
|
|
|
|
|
|
|
|
|
Oil |
|
|
|
|
|
|
|
|
|
|
|
|
|
|
|
|
|
|
|
|
|
|
|
|
|
|
||
|
|
|
|
|
|
|
|
|
|
|
.0% |
|
|
|
|
|
|
|
|
|
|
|
0.7% |
||
|
|
|
|
|
|
|
|
|
|
|
|
|
|
|
|
|
|
||||||||
|
|
|
|
|
3 763 Mtoe |
|
|
|
|
|
|
|
|
5 395 Mtoe |
|
|
|
||||||||
|
|
|
|
|
|
|
|
|
|
*Excludes electricity trade. |
|
|
|
|
|
|
|
|
|
||||||
|
|
|
|
|
|
**Other includes geothermal, solar, wind, heat, etc. |
|
|
|
|
|
|
|||||||||||||
7
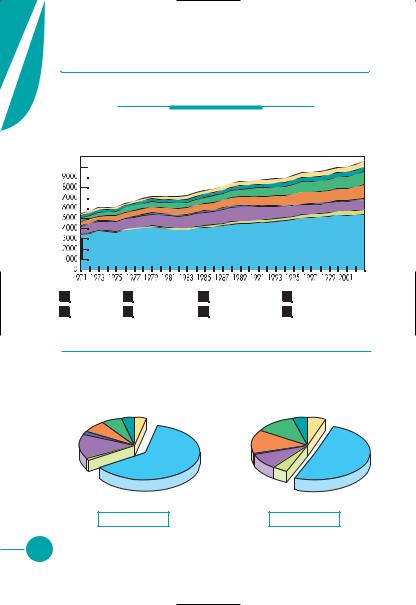
S U P P L Y
TOTAL PRIMARY ENERGY SUPPLY
The World
Evolution from 1971 to 2003 of World Total Primary Energy Supply* by Region (Mtoe)
11000
10000
1 |
|
|
|
|
2003 |
||
|
OECD |
|
Middle East |
|
Former USSR |
|
Non-OECD Europe |
|
|
|
|
||||
|
|
|
|
||||
|
China |
|
Asia** |
|
Latin America |
|
Africa |
|
|
|
|
||||
|
|
|
|
||||
1973 and 2003 Regional Shares of TPES*
|
|
1973 |
|
|
|
|
2003 |
|
|
|
Latin |
|
|
|
|
Latin |
|
China |
Asia** |
America |
|
|
|
Asia** |
America |
Africa |
7.2% |
3.7% Africa |
|
China |
11.6% |
4.4% |
|||
Non- |
6.1% |
3.5% |
|
|
|
5.3% |
||
|
|
13.5% |
|
|
|
|||
OECD |
|
|
|
|
|
|
||
|
|
|
Non- |
|
|
|
|
|
Europe |
|
|
|
|
|
|
|
|
|
|
|
OECD |
|
|
|
|
|
1.6% |
|
|
|
|
|
|
|
|
|
|
|
Europe |
|
|
|
|
|
Former |
|
|
|
|
|
|
|
|
USSR |
|
|
|
1.0% |
|
|
|
|
14.4% |
|
|
|
Former |
|
|
|
|
Middle East |
|
OECD |
USSR |
Middle East |
OECD |
|||
1.1% |
|
62.4% |
9.1% |
50.9% |
||||
|
|
|
|
|
|
4.2% |
|
|
|
6 034 Mtoe |
|
|
|
10 579 Mtoe |
|||
|
*Excludes international marine bunkers and electricity trade. |
8 |
**Asia excludes China. |