

2 - Ophir - тоже камеры
.pdfYOU JUST BOUGHT A NEW LASER. WHAT BEAM SHAPE DID YOU GET?
By Chuck Reagan, Southeastern Sales Manager, Ophir-Spiricon
LASER: 4KW factory new laser, 808nm Diode with lens supplying a 12.5mm X 1mm beam, Robotworx rebuilt Motoman 6 axis robot.
PROCESS: Heat treating and thermal cladding of metal parts primarily for oil and chemical industries and extreme environments.
TOOLS: BGS-USB-SP620, 50mm CCTV lens, using internal aperture but not tightly closed (estimated at 50%), ND 8 (four ND2, Stackable C- mount filters), photographic camera tripod, table mounted, to place the camera near the target and at an angle to see the beam strike the target.
LASER TARGET: one Poco Graphite PLS-2 Purified Graphite Sample .25” Thick x 2” Width x 2” PROBLEM: What happens when your company’s new laser fails to perform according to specifications and your best customers are waiting weeks for delivery? Does the manufacturer send a field service engineer repeatedly to check for problems? What happens when the manufacturer cannot tell you what is wrong after they finally sent their corporate, factory-level engineers to investigate? Do you demand a full refund if the laser still won’t work properly and weeks are passing by? What if you spent a fortune in acquisition, setup, training and labor costs and you thought that you bought the best product available on the market?
Many laser users sympathize with this situation after enduring similar problems with their own lasers. Production line shut-downs, cash-flow disasters, late deliveries, irate customers and irate management are all direct results of having a problem on the production line. It often seems that no one is able to correct the problems quickly or at a reasonable price.
Recently, a manufacturing engineer spoke to OphirSpiricon because he could not diagnose the problems
with his brand-new, robot-mounted, 4KW diode laser. The engineer bought the laser to heat-treat metal parts but the laser would not work properly and the laser company did not know why. His power meter readings and his inspection of the scrap products did not show him why his new laser was not working properly. The parts are made for extreme environments found in the chemical and oil industries and after processing, they did not pass the rigorous quality
control checks.
The laser company advertisements state that the laser delivers a full-power (4KW), focused, linear, flattop beam on the metal parts throughout the duty cycle. The manufacturer-supplied lens should shape the Diode beam into a linear, flat-top beam. The engineer and his technicians suspected that either the laser did not focus properly on the target or the lens did not distribute power correctly on the target surface but all of their checks were inconclusive. The robot did not cause or contribute to the problems and it worked flawlessly throughout the process.
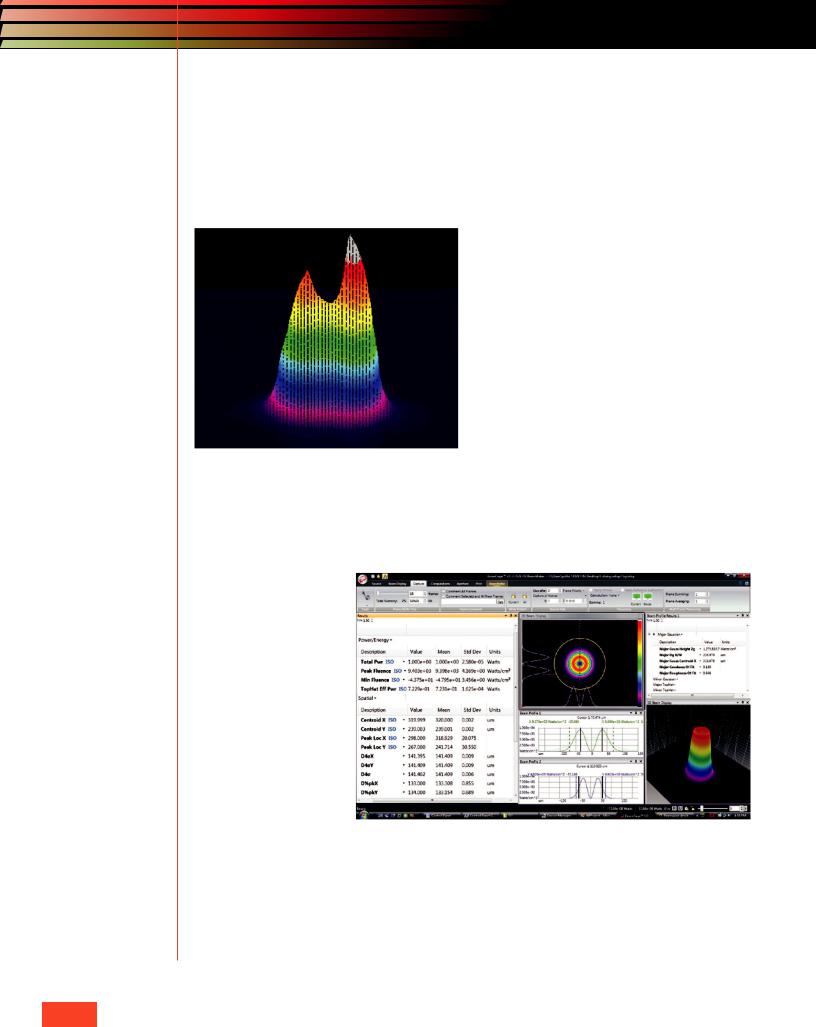
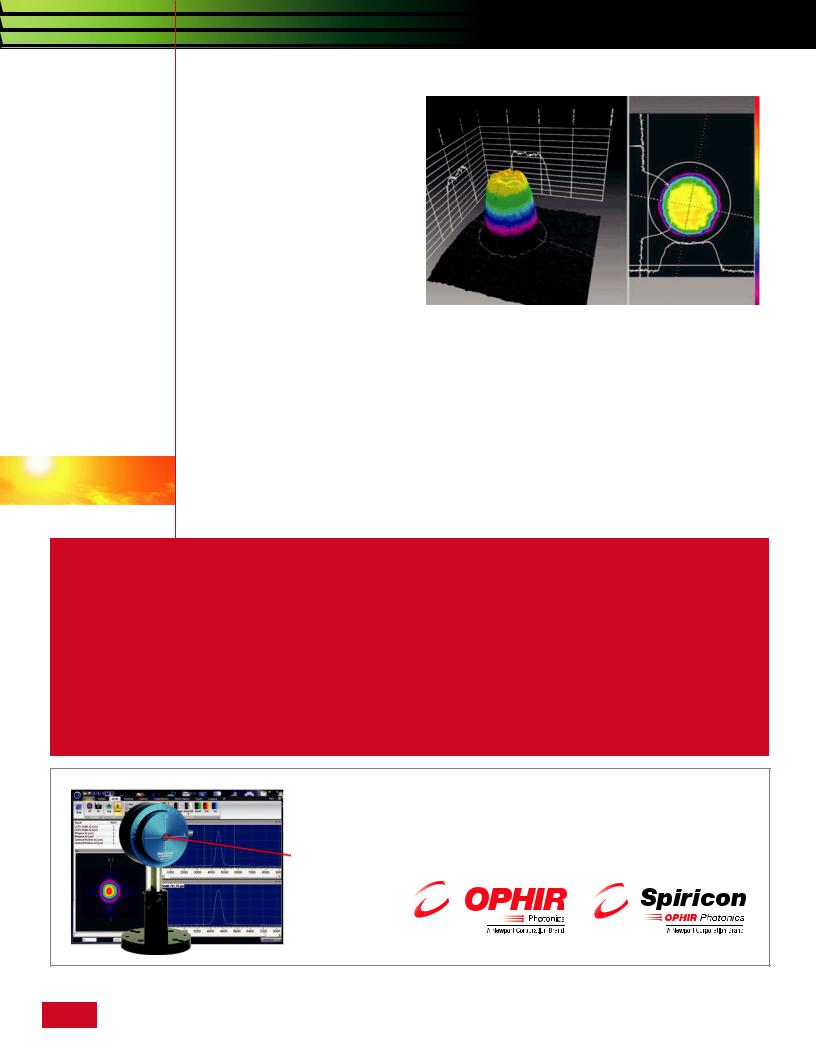
Solution: A visit by an Ophir-Spiricon sales engineer with his BGS-USB-SP620 laser beam diagnostic system found the cause of the faulty laser within a few minutes after setup. The image shown below (see figure one below) captured by the BeamGage software told the story of the faulty laser.
Figure 1
continued on page 12
B E A M P R O F I L I N G PagePage119
WHAT BEAM SHAPE
continued from page 11
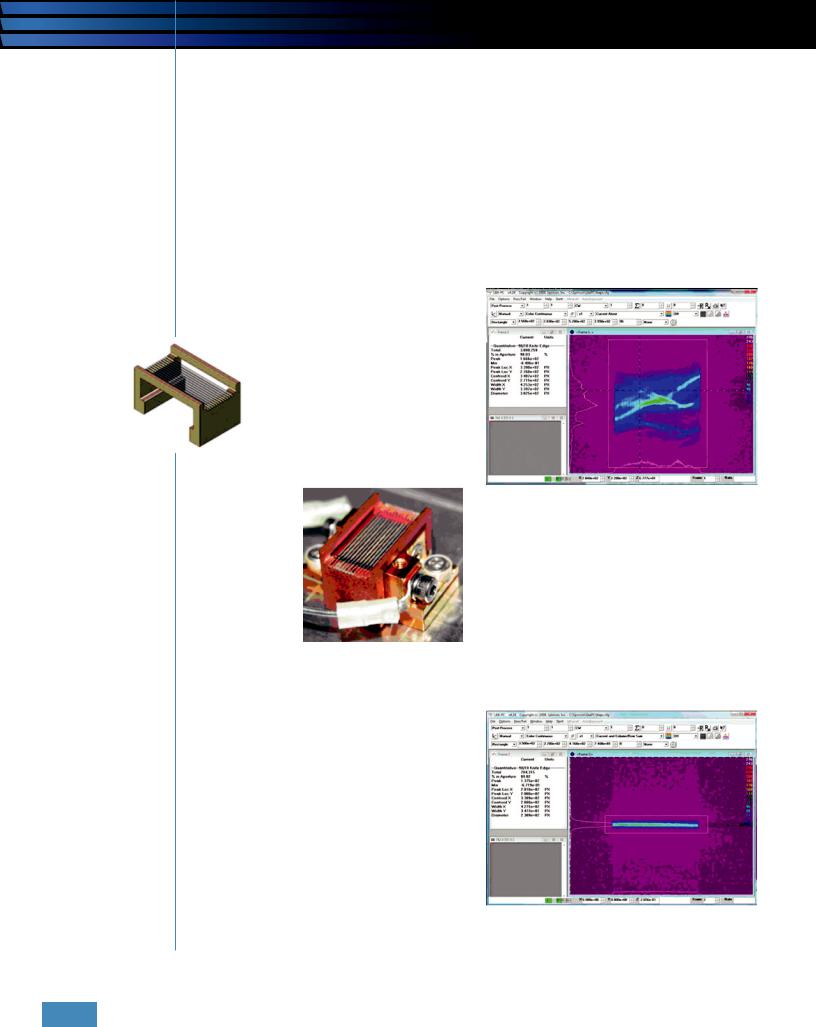
The beam on the target was not flat-top; it was barbell shaped and it had an uneven distribution of power along the long axis. This beam would never pass quality checks for parts processing.
The white portion of both pictures indicates the hottest part of the beam and should not be present during parts manufacturing. The laser delivers the
Figure 2
advertised 4KW of power from the beginning of the duty cycle (as shown by the power meter) but the power was concentrated in two lobes at each end of the beam. (which damages the part) During later testing, the engineer
discovered that the beam displayed other unusual shapes that were equally destructive to the part being processed. Eventually, the beam became stable and the power became evenly distributed but by that time in the duty cycle, the part was ruined.
Figure two is the same as figure one above, (shown from the side), in a threedimensional picture.
As you can see from the two pictures above, the laser heated the parts unevenly and was the reason the parts failed inspection.
The laser manufacturer never came up with a solution to the problem so the laser buyer reprogrammed his robot for an unplanned and unexpected warm-up period (off-target) to allow the laser to stabilize. Once the warm-up period finished, the laser began the heat-treating process and parts began passing the quality inspections.
The laser manufacturer later said that their company tests their diode lasers with scanning slit devices but they could not see the transient problems clearly revealed by the BeamGage system. The BeamGage system allowed the owner to quickly determine the problem with his new laser and determine a cost-effective strategy to overcome that limitation. He is now delivering quality parts ontime and onbudget. He, his management and his customers are very happy.
Find out how to solve your laser problems with the newest and most advanced Beam Analysis System available in the world today, Beam Gage.(figure three below)
Contact your Ophir-Spiricon sales engineer for your free on-site laser check-up by calling 435-753-3729 or check out our website, www.ophiropt.com/photonics
Page 12 O P H I R P H O T O N I C S , W W W . O P H I R O P T . C O M / P H O T O N I C S
Just a Moment in Time:
OLD ACRYLIC BLOCKS ARE A THING OF THE PAST
By Todd Jacobson, Technical Consultant, Laser Maintenance Group, Corp.
If you have been in the laser cutting business long enough you eventually will have one of those days when, no matter what you do, the laser will not cut your
parts cleanly…if at all.
The operators and maintenance personnel check and verify all the usual problem areas and finally conclude that everything looks, measures, and appears correct. Most checks and verifications are really just a moment in time, but the moment in time that you check may not be the same moment in time when the problem arises. The laser beam quality is the single
most important characteristic that determines your laser’s ability to process material at peak performance.
Taking a beam mode shot into an acrylic block lasts only a couple of seconds, but laser cutting a part may last several minutes. There-
fore, when service technicians or maintenance personnel replace optics or tune the mirrors in the resonator, it is a difficult task to view a beam continued on page 14
Laser Beam In
|
|
Pass-Through |
|
|
|
Figure 1 |
|
Beam Out |
|
|
|
B E A M P R O F I L I N G PagePage139

OLD ACRYLIC BLOCKS
continued from page 14
profile with the same properties as a beam that is hot and causing thermal lensing. A laser beam profiler displays the spatial profile of a laser beam at a particular plane transverse to the beam propagation path. The good news is that laser beam profilers are reasonably priced tools that allow us to look at the beam instantaneously and display variations as they occur versus hope that we take a shot at the right moment. Recently, this exact scenario occurred at a customer site. In the past, optics would have been replaced one at a time until the cutting conditions improved. Seems simple but the systems have 10-15 optics each and testing and beam realignment between each optic change could take days to complete. This results in a loss of production, increased price from service technician labor rates, and the cost of 10-15 optics to replace one bad optic. I tested Ophir-Spiricon’s ModeCheck® profiler recently and found the device invaluable. The above scenario is just one of many of its benefits. The setup was quick, the data captured was accurate, and the display of the beam profile updated quickly with the tuning process. Once I gained confidence data gathering and saving profiles, I decided to put the device to the real test. If you have multiple laser systems that are identical except one laser always outperforms the other, the question is, “What’s different?” Mode burn blocks are open to subjective interpretation because of the melted edges around the diameter of the profile shot. Calculating power density and accurately measuring beam diameter, beam width, beam depth, and symmetry are challenging without ModeCheck. With ModeCheck, the saved data contains all the information in one electronic location… no need to label acrylic blocks in one location and data in another.
The first AC kilowatt-hour meter was developed in 1889 by Ottó Bláthy's from Hungary, and has been serving mankind ever since.
Designed to Measure Made for Accuracy
Ophir's Revolution in
Laser Measurement
The New BeamTrack Sensor Measures
Power, Beam Position and Beam Size
• Tracks
beam size
• Measures
beam position
• Models from 3W to 400W
Page 14 O P H I R P H O T O N I C S , W W W . O P H I R O P T . C O M / P H O T O N I C S
BeamCube MEASURES LASER
WELDING IN MEDICAL DEVICES
By John McCauley, Midwest Sales Manager, Ophir-Spiricon
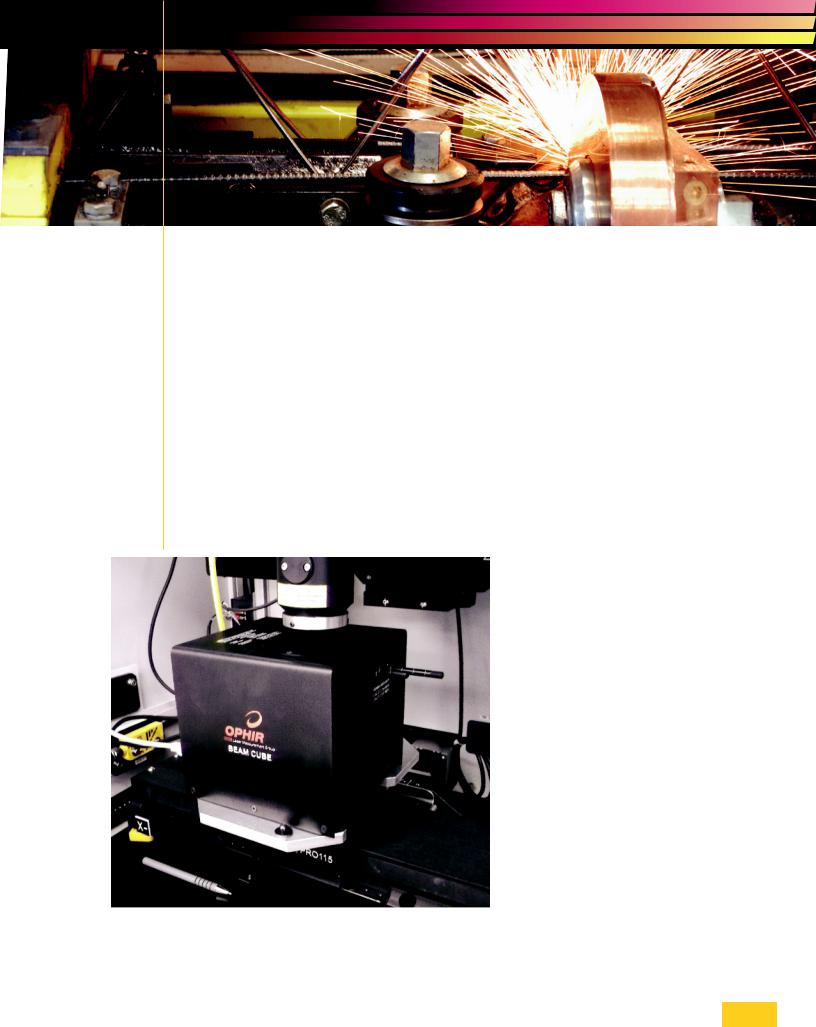
Ophir Photonics’ BeamCube is becoming popular as a one-stop product for measuring the performance of laser welding systems used in the manufacture of medical devices. Low to medium power laser weld parameters can be simultaneously measured, recorded, and monitored for compliance to federal requirements and previously set manufacturing limits. BeamCube uses a CCD camera, Thermopile sensor, and fast photodiode to measure the beam
spatial profile, average power, and temporal pulse profile of the welding laser.
In most cases, BeamCube can measure the spatial profile of the lasers focused spot to enable the user to view the energy distribution of the beam where the weld occurs (or the beam where the work is done). The NIST traceable power sensor provides average power measurements that can be integrated into the beam profiling software for direct readout of power density at the work piece. Welding process performance data is automatically logged and instantly compared to pass/ fail limits to alert the operator of out of tolerance conditions. BeamCube performs as both a laser welding performance monitor as well as a process development tool to help you establish and maintain manufacturing parameters of important laser settings that are critical for your product’s success.
continued on page 16
Figure 1. BeamCube industrial beam profiling system from Ophir Photonics Group.
B E A M P R O F I L I N G PagePage159

BEAMCUBE
continued from page 15
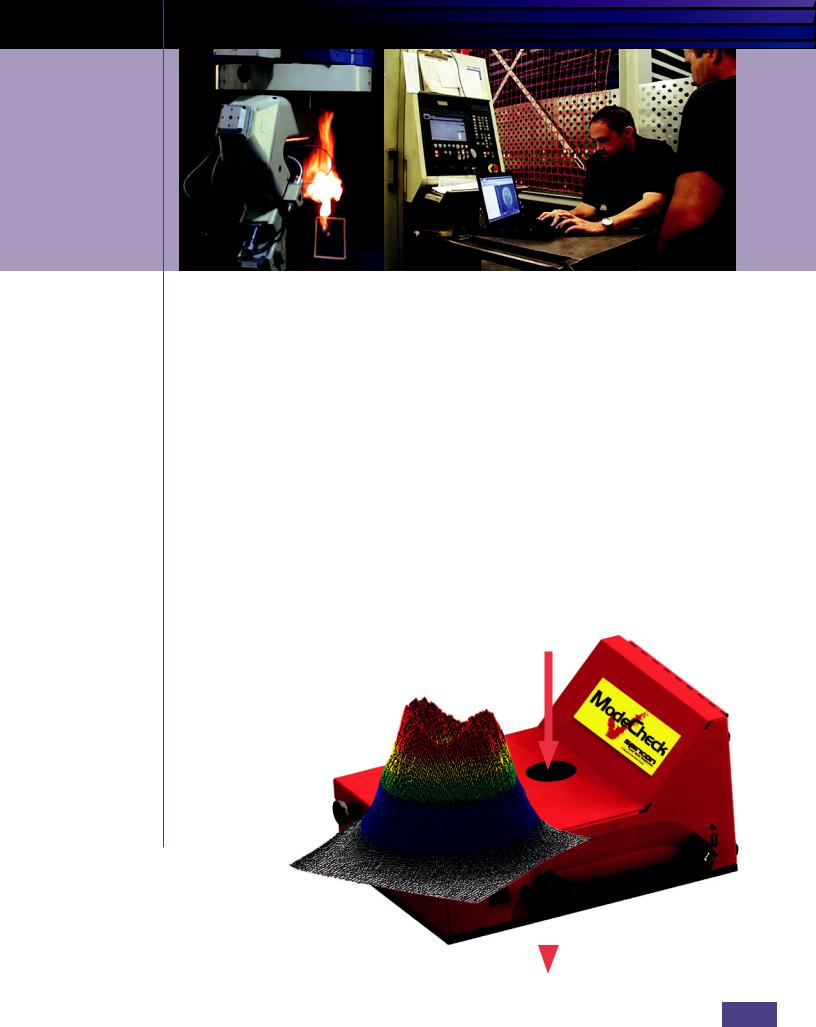
Figure 2. Laptop or desktop PC screen shows spatial beam profile at focus, temporal profile, power, energy, and frequency.
Beam Cube for Consistent
Medical Device Manufacturing
Ophir-Spiricon, the world’s leading provider of laser measuring equipment, introduces Beam Cube to monitor laser beam quality in medical device applications, ensuring consistent and documentable manufacturing quality in precision welding and cutting results. Beam Cube measures beam profile, temporal pulse shape, focal spot position and power up to 150 W for Nd:YAG and diode lasers.
(866) 755-5499 • sales@us.ophiropt.com • www.ophiropt.com/photonics
Page 16 O P H I R P H O T O N I C S , W W W . O P H I R O P T . C O M / P H O T O N I C S
LASERS AND
SOLAR CELL MANUFACTURING
By Dick Rieley, Sales Manager, Mid Atlantic and Southeast Regions, Ophir-Spiricon
The Green movement is encouraging the use of energy efficient technolo-
gies such as solar cells.
This technology has been met with resistance due to its slow return on investment. This is coupled with the challenge of the efficiency of the material used. Reducing the cost of manufacturing solar cells is largely influenced by production efficiencies as well as the type of photovoltaic materials used. Manufacturing efficiencies have been addressed through high speed, nearly fully automated production processes from handling of the panels, deposition of materials, to final packaging. The use of cost effective photovoltaic materials, however, represents a real dilemma. The lower cost deposition materials are less efficient, whereas the higher efficiency materials cost more and can possess carcinogenic elements that are federally controlled.
The solar cell manufacturing community, although addressing more efficient and environmentally safe materials, has concentrated
on reducing costs through automated processes. This requires methods that are consistent and reliable. The risk of these operations, however, is that they can produce a large quantity of low cost, high quality material or, just as quickly, they can produce substandard panels.
One aspect of the manufacturing process that is critical is the scribing of the photovoltaic material on the individual cells on the large panels. Lasers have proven to be highly reliable, consistent, and predictable in their production results. In this high speed manufacturing arena, lasers can easily keep up with production, are silent to use, and typically contribute to a clean manufacturing environment.
LASER BEAM DIAGNOSTICS
However, with all that lasers have to offer and the advantages they can provide, laser beam diagnostics are an essential part of the process, a part that is often overlooked. There are two key diagnostic measurements that are needed to ensure laser consistency from panel to panel: 1) laser beam power, and 2) laser beam diagnostic size,
shape, and intensity.
Laser Power: The first measurement is monitoring the output power of the laser using a NIST calibrated, laser power meter. Regardless of the quality of the laser beam, if the power continued on page 18
B E A M P R O F I L I N G PagePage179
LASER AND
SOLAR CELL MANUFACTURING
continued from page 17
is below specification, the scribing process will be rejected. As most laser scribers operate at KHz rates, measuring average power is sufficient. The laser power detector should have an active area twice the size of the laser beam, with a dynamic measurement range from 100mW to 100W, including the NIST calibration at the specific operational wavelength of the process – typically 1064nm, or 532nm. Laser power, when measured on a regular basis, will provide a benchmark of process stability and uniformity.
When a laser power meter is tied into the manufacturing laser consol using USB, automatic and periodic measurements can be taken with pass/fail criteria established for immediate notification of a measurement out of specification.
Laser Beam Diagnostics: Along with laser power, the spatial information on the laser beam is equally important to measure and control. Laser beam diagnostics typically involve three measurements; the laser beam size, shape, and intensity. In the produc-
tion of solar cells, the laser beam is used to scribe (ablate) the deposited layers of photovoltaic material down to the base glass, thereby establishing the individual electrical circuit cells on the panel. With a controlled base line of spatial measurements, the process can be controlled without allowing deviations in the laser beam that could allow residual material in the scribe area potentially causing an electrical short in the overall panel circuit, resulting in a defective panel.
The most typical measurements that are most informative for process control include:
1 The size of the laser beam. The industry standard for beam measurement is 13.5% of Peak (1/e2). This is useful as the calculation is based on the peak of the beam where the process of ablation is performed and less so on the wings of the beam.
2 The ellipticity (roundness) of the laser beam. Should the beam ellipticity change from round to out of-round then the ablation pattern will change and the uniformity of the scribe lines will not be consistent, producing of out of spec panels.
3 Shape of the overall beam. This can affect the size and effectiveness of the ablation pattern on the glass panel. The above picture is a 3D / 2D image of a typical Top Hat Beam where the energy is uniform across the top portion of the beam pattern. This is quite useful in preparing a uniform scribe of a certain width and depth. Depending upon the process, a Gaussian Beam pattern may be called for as well. In either case a beam diagnostic measurement that compares the Top Hat or Gaussian shape to an ideal fit is a very informative value. Tracking these values to monitor change is essential for close and tight process control of the solar cell laser process.
NanoScan Laser Beam Profiler Adds Enhanced User Interface
Ophir-Spiricon, the world’s leading provider of laser measuring equipment, introduces Photon’s NanoScan v2 software. NanoScan, a NIST-calibrated laser beam profiler, uses moving slits to measure beam sizes from microns to centimeters at beam powers from microwatts to kilowatts, with little to no attenuation. The latest version adds an  enhanced GUI with support for Microsoft ribbon toolbar support for Windows 7 32-/64-bit.
(866) 755-5499 • sales@us.ophiropt.com • www.ophiropt.com/photonics
Page 18 O P H I R P H O T O N I C S , W W W . O P H I R O P T . C O M / P H O T O N I C S

BEAM SHAPING FOR SPACE-BASED ATMOSPHERIC MEASUREMENTS
By Larry Green, Etienne Friedrich
The ESA Living Planet Program is designed to find out more about our changing Earth. The Earth Explorer missions are the research missions of the Living Planet Program employing satellites with new measurement techniques. Among these, LIDAR-based instruments represent a recent promising area for
monitoring wind, aerosols or trace gas pollutants.
One main challenge for any space based LIDAR is to build an efficient and robust laser source. Several technological developments are currently moving toward achieving this goal, like the lightweight high brightness thin-slab laser. The EarthCARE (Earth Clouds, Aerosols and Radiation Explorer) mission is a joint Euro- pean-Japanese mission addressing the need for a better understanding of the interactions between cloud, radiative and aerosol processes that play a role in climate regulation. Enzo Nava, Head of the Electro-optics Section at CESI, reports. “We had to produce a pre-development model for the Atmospheric LIDAR (ATLID) laser transmitter to operate. In this case, we were developing an end-pumped Nd:YAG MOPA laser system with frequency tripling to operate at 355 nm. “The laser had to operate in pulsed Q-switched mode, with a narrow bandwidth and tight frequency control”, said Nava. We selected laser diodes to pump the small rod design that were high power QCW (Quasi Continuous Wave) diode stacks with 1.2
Figure 1
kW peak power at 808 nm. “Since we already had experience with Doric Lenses (Quebec, Canada), we turned to them to develop the collimation optics and to PowerPhotonic (Edinburgh, UK) for the reshaping of the high power laser diodes”. “We were already familiar with Doric microlenses since 2001 on another project, so for this project we decided to add Doric to our team with full responsibility of the Fast Axis Collimation optomechanics”. The design called for pump diodes with a beam profile of only 6 mm by 0.5 mm. It is essential that the source is lightweight, compact and very reliable. A detailed analysis of these requirements led to the selection of a 12-bar conductioncooled QCW diode stack with corrective phaseplates from Quantel Laser Diodes (Nuvonyx), capable of operation at 1.2 kW peak power. These are available in a 500 µm bar pitch, providing the entire pump source within an area of only 6 mm X 10 mm, as shown in Figure 1. These stacks are already used in military applications, so they are robust and well suited to space deployment.
FIGURE 1: Shows the schematic of the twelve bar stack and nomenclature (a) nominal stack geometry (b) deviations from nominal (reference) positions However, the divergence properties of these stacks made them unsuitable for our application unless we could develop a collimation process to fit on the stacks. These were not trivial challenges, because in addition to the divergence angle variations or each diode bar, we had to contend with the small clearance between lenses (as small as tens of microns), and also contend with the distortions of the bars themselves. “Fortunate-
continued on page 20
B E A M P R O F I L I N G PagePage199
BEAM SHAPING
continued from page 19
Figure 2
ly, Doric lenses has experience with this for many years”, reported Jean-Luc Neron, of Doric Lenses. “Our expertise in micro-cylindrical lenses was driven by the needs of laser diode market. As a manufacturer of the finest cylindrical micro lenses with huge stock of different lenses, in-house optical shop and team of photonics engineers, we are perfectly positioned to do “lensing” of individual laser diodes, bars or a stack of bars”. Doric Lenses Inc. has developed a procedure of making FAC lens arrays that match 3D geometry of specific laser diode bar stack. One such array is shown in FIGURE 2. FIGURE 2: Doric Lenses FAC Microlens Array designed to
compensate for diode bar stack aberrations. With this design, Doric was able to custom insert micro cylindrical collimating lenses aligned to each diode bar with tolerance of <+/-5µm.
FIGURE 3: Stack after primary collimation The thin slab architecture of this application places particularly stringent de-
mands on pump beam collimation: the beams from each bar must be almost perfectly parallel, and must each have beam divergence close to the diffraction-lim- it. Achieving this
with primary collimation alone would require lens position tolerances of <+/-0.5µm, which is beyond the capabilities of conventional machining processes. Instead, PowerPhotonic beam correction phaseplates were used to reshape the primary-collimated wavefront in order to achieve the required beam performance. In order to align the optics and characterize the beam, a beam profiler was necessary. Laser beam profilers have been in use in Science and Industry for more than 30 years and Doric and PowerPhotonic are well-acquainted with the Ophir-Spiri- con Inc. (North Logan, UT) Laser Beam Analyzers. “The accuracy and reliability of the Ophir-Spiricon system made them an ideal choice to enable us to both design the correction phaseplate and then
align it to the corrected diode stack in real time”, says Etienne Friedrich or PowerPhotonic. “Live visualization of the entire beam combined with accurate real-time measurement of beam divergence was essential in this application. With the Laser Beam Analyzer we are able to characterize individual bars in the stack and obtain an image for the complete stack”, as shown in Figure 4.
FIGURE 4: Beam far field image of the 12-bar diode stack after fast-axis collimation with the cus-
Figure 4
tom micro-cylindrical lens array. Although the collimated beam is now 30-40 times brighter than the uncollimated stack, residual aberrations from smile and tilt errors can easily be seen in this beam image of all the diodes. When the custom designed correction phaseplate is added, the beam appears as shown in Figure 5.
Figure 5
Page 20 O P H I R P H O T O N I C S , W W W . O P H I R O P T . C O M / P H O T O N I C S