

Seagate Crystal Reports™ 7
User’s Guide
Seagate Software, Inc.
840 Cambie Street
Vancouver, B.C., Canada V6B 4J2
© 1998 (manual and software) Seagate Software, Inc. All Rights Reserved.
Seagate Software, Seagate, and the Seagate logo are registered trademarks of Seagate Technology, Inc., or one of its subsidiaries. Seagate Crystal Reports, Seagate Crystal Info, the Seagate Crystal Reports logo, and Smart Navigation are trademarks or registered trademarks of Seagate Software, Inc. All other product names referenced are believed to be the registered trademarks of their respective companies.
Manual written by:
ELUCIDEX
3600 Meridian St.
Bellingham, WA USA 98225
http://www.elucidex.com/
1992-1998

C |
O |
N |
T |
E |
N |
T |
S |
Welcome to Seagate Crystal Reports |
|
|
|
||||
Welcome ............................................................................................................... |
|
|
|
|
|
|
2 |
Two kinds of Hands-On tutorials ........................................................................... |
|
|
|
|
2 |
||
Command, button, key, and control conventions ................................................... |
|
|
3 |
||||
Using Seagate Crystal Reports documentation ........................................................ |
|
|
|
5 |
|||
Seagate Crystal Reports online Help features .......................................................... |
|
|
|
5 |
|||
Chapter 1 - Installation and Quick Start |
|
|
|
||||
Installation Requirements ..................................................................................... |
|
|
|
|
12 |
||
Installation |
........................................................................................................... |
|
|
|
|
|
12 |
Installing on a network |
........................................................................................ |
|
|
|
|
13 |
|
Upgrading from a previous version ...................................................................... |
|
|
|
|
14 |
||
Quick Start |
.......................................................................................................... |
|
|
|
|
|
15 |
Chapter 2 - What’s New |
|
|
|
|
|
||
New Crystal Query Designer provides greater power and speed .......................... |
|
22 |
|||||
Report Designer Component ................................................................................ |
|
|
|
|
22 |
||
Map Expert helps identify trends .......................................................................... |
|
|
|
|
22 |
||
Enhanced charting capabilities help you analyze data ......................................... |
|
|
23 |
||||
Enhanced cross-tab features make cross-tab reports more powerful than ever ...... |
23 |
||||||
Server-side processing saves time and memory |
.................................................... |
|
|
23 |
|||
Running totals -- one field is all you need ............................................................ |
|
|
|
24 |
|||
Document Import Tool converts old text reports .................................................. |
|
|
24 |
||||
Entering SQL expressions directly helps you create reports faster ........................ |
|
24 |
|||||
Highlighting Expert makes formatting faster and easier ......................................... |
|
|
25 |
||||
Field Mapping provides more database control |
.................................................... |
|
|
25 |
|||
Enhanced Formula Editor makes creating formulas easy ....................................... |
|
|
25 |
||||
Enhanced exporting capabilities ........................................................................... |
|
|
|
|
26 |
||
New and better parameter fields provide greater flexibility |
.................................. |
|
26 |
||||
On-Demand subreports increase report organization ........................................... |
|
|
26 |
||||
Chapter 3 - Learning Seagate Crystal Reports |
|
|
|||||
Learning Seagate Crystal Reports .......................................................................... |
|
|
|
|
28 |
||
User’s Guide ........................................................................................................ |
|
|
|
|
|
28 |
|
Online Help ......................................................................................................... |
|
|
|
|
|
34 |
|
Books Online ....................................................................................................... |
|
|
|
|
|
34 |
|
i
Sample Reports .................................................................................................... |
35 |
Glossary ............................................................................................................... |
35 |
Sample Data - xtreme.mdb .................................................................................. |
35 |
Suggested learning paths ...................................................................................... |
37 |
Chapter 4 - Getting to Know Seagate Crystal Reports |
|
The application window ...................................................................................... |
42 |
Menu bar ............................................................................................................. |
42 |
Standard toolbar .................................................................................................. |
45 |
Formatting toolbar ............................................................................................... |
47 |
Supplementary toolbar ......................................................................................... |
49 |
Analyzer toolbar .................................................................................................. |
50 |
Status bar ............................................................................................................. |
51 |
Shortcut menus .................................................................................................... |
53 |
Cursors ................................................................................................................ |
54 |
Design Tab .......................................................................................................... |
57 |
Preview Tab ......................................................................................................... |
61 |
Analyzer Tab ....................................................................................................... |
65 |
Other fundamentals ............................................................................................. |
66 |
HANDS-ON (Report Design Environment) ..................................... |
70 |
How to move and resize toolbars ......................................................................... |
70 |
How to add, delete, and move guidelines ............................................................ |
72 |
How to move and position objects using guidelines ............................................. |
73 |
How to turn the grid on/off ................................................................................. |
76 |
How to zoom the report in and out ...................................................................... |
76 |
How to undo/redo activities ................................................................................. |
77 |
How to drill-down on summarized data ............................................................... |
78 |
How to disable field clipping ............................................................................... |
78 |
HANDS-ON (Sections and Areas) ................................................... |
79 |
How to add, delete, move, and merge sections ................................................... |
79 |
How to split and resize sections ........................................................................... |
82 |
Chapter 5 - Introduction to Reporting |
|
Basic report design ............................................................................................... |
86 |
How to design a paper prototype ......................................................................... |
93 |
Concepts in reporting ........................................................................................... |
93 |
Beyond basic reports .......................................................................................... |
100 |
ii
HANDS-ON (Report Creation and Design) ................................... |
101 |
How to select data and begin creating a report .................................................. |
101 |
How to add and link multiple tables .................................................................. |
104 |
How to insert database fields ............................................................................. |
105 |
How to insert special fields ............................................................................... |
106 |
How to create an SQL expression field .............................................................. |
107 |
How to insert text objects .................................................................................. |
108 |
How to use a database field in a text object ....................................................... |
108 |
How to insert a picture ...................................................................................... |
109 |
How to select, move, and resize objects ............................................................ |
110 |
How to make an object underlay a following section(s) ..................................... |
111 |
How to hide parts of a report ............................................................................. |
114 |
HANDS-ON (Finishing Your Report) ............................................ |
117 |
How to use page headers and footers ................................................................. |
117 |
How to add a title page to the report .................................................................. |
117 |
How to add summary information to the report ................................................. |
119 |
Chapter 6 - Printing, Viewing, and Exporting |
|
Printing considerations ....................................................................................... |
122 |
Design solutions for printing/distributing ............................................................ |
123 |
Report creation checklist for distributed reports ................................................. |
131 |
Updating printer drivers ..................................................................................... |
131 |
Report distribution ............................................................................................. |
132 |
Compiled reports ............................................................................................... |
132 |
HANDS-ON (Exporting a Report) ................................................. |
133 |
How to export reports ........................................................................................ |
133 |
How to fax a report ............................................................................................ |
138 |
HANDS-ON (Compiled Reports) .................................................. |
138 |
How to compile a report .................................................................................... |
138 |
How to distribute a compiled report .................................................................. |
139 |
How to use a compiled report ............................................................................ |
140 |
HANDS-ON (Viewing reports with a web browser) ..................... |
141 |
How to view reports in a web browser ............................................................... |
141 |
iii
Chapter 7 - Tutorial - Customer List |
|
Overview ........................................................................................................... |
148 |
Getting started ................................................................................................... |
149 |
Record Selection ................................................................................................ |
162 |
Grouping and sorting ......................................................................................... |
165 |
Completing the report ........................................................................................ |
169 |
Chapter 8 - Reporting on OLAP data |
|
Introduction .................................................................................. |
172 |
Working with OLAP data ................................................................................... |
172 |
OLAP Reporting with Seagate Crystal Reports .................................................... |
172 |
OLAP grid objects .............................................................................................. |
173 |
Updating an OLAP database location ................................................................ |
174 |
OLAP Language ................................................................................................. |
175 |
Working with Hyperion Essbase data (Report Script Method) ............................. |
175 |
Working with Informix MetaCube (MetaCube SQL Method) .............................. |
183 |
HANDS-ON (Reporting on OLAP data) ........................................ |
183 |
How to create an OLAP report using the Grid Object ........................................ |
183 |
How to create a MetaCube report ...................................................................... |
190 |
How to apply a filter to a MetaCube report ........................................................ |
191 |
How to create a MetaCube cross-tab report ....................................................... |
191 |
How to add a field to a MetaCube cross-tab report ............................................ |
192 |
How to pivot fields in a MetaCube Cross-Tab report .......................................... |
192 |
How to add a formula to a MetaCube report ...................................................... |
193 |
Chapter 9 - Multiple Section Reports |
|
Using multiple sections in reports ...................................................................... |
196 |
HANDS-ON (Multiple Section Reports) ........................................ |
197 |
How to prevent variable length objects from overwriting each other .................. |
197 |
How to work with text objects ........................................................................... |
197 |
How to create a form letter using a text object ................................................... |
200 |
How to format objects conditionally .................................................................. |
204 |
How to print conditional messages in form letters .............................................. |
205 |
How to alternate background colors for rows ..................................................... |
206 |
How to eliminate blank lines ............................................................................. |
207 |
iv
How to add blank lines conditionally ................................................................ |
208 |
Chapter 10 - Formatting |
|
Formatting concepts ........................................................................................... |
210 |
Absolute formatting ............................................................................................ |
211 |
Types of formatting properties ............................................................................ |
211 |
Conditional formatting ....................................................................................... |
212 |
HANDS-ON (Absolute Formatting) ............................................... |
215 |
How to add color, shading, and borders ............................................................ |
215 |
How to add/edit lines and boxes ........................................................................ |
216 |
How to change margins ..................................................................................... |
217 |
How to add/delete white space between rows .................................................. |
218 |
How to set page orientation and paper size ....................................................... |
220 |
HANDS-ON (Conditional Formatting) .......................................... |
221 |
How to create a footer that appears on all pages but the first ............................. |
221 |
How to conditionally format fields using the Highlighting Expert ....................... |
223 |
How to Use the Highlighting Expert ................................................................... |
224 |
Chapter 11 - Record and Group Selection |
|
Record selection ................................................................................................ |
228 |
Group selection ................................................................................................. |
231 |
Record selection formula templates ................................................................... |
233 |
HANDS-ON (Record and Group Selection) .................................. |
238 |
How to set up record selection using the Select Expert ...................................... |
238 |
How to set up group selection using the Select Expert ........................................ |
239 |
How to create a record or group selection formula ............................................ |
240 |
How to use record/group selection templates ..................................................... |
241 |
How to select the top or bottom N groups ......................................................... |
242 |
Chapter 12 - Sorting, Grouping, and Totaling |
|
Sorting, Grouping, and Totaling Overview ......................................................... |
246 |
Creating custom groups ..................................................................................... |
250 |
HANDS-ON (Sorting, Grouping, and Totaling) ............................. |
252 |
How to do a single field sort .............................................................................. |
253 |
How to do a multiple field sort .......................................................................... |
256 |
v
How to group data ............................................................................................. |
258 |
How to sort records within groups ..................................................................... |
260 |
How to summarize grouped data ....................................................................... |
262 |
How to subtotal grouped data ............................................................................ |
264 |
How to sort based on summarized group values ................................................ |
266 |
How to extend prices and then subtotal the extensions ...................................... |
266 |
How to create multiple levels of subtotals .......................................................... |
270 |
How to group based on the first letter of a company name ................................ |
274 |
How to group data in intervals ........................................................................... |
277 |
How to calculate a percentage of the grand total ............................................... |
282 |
How to create group headers ............................................................................. |
285 |
Chapter 13 - Introduction to Formulas |
|
What are formulas? ............................................................................................ |
292 |
How formulas are created: an introduction to the Formula Editor ...................... |
296 |
Other formula conventions ................................................................................ |
304 |
Formula syntax .................................................................................................. |
306 |
How formulas are evaluated - order of precedence ............................................ |
309 |
HANDS-ON (Formulas) ................................................................ |
309 |
How to insert a formula into a report ................................................................. |
309 |
How to delete formulas from a report ............................................................... |
311 |
How to copy formulas from online Help ............................................................ |
312 |
How to copy formulas from one report to another ............................................. |
313 |
Chapter 14 - Advanced Formulas |
|
How to create If-Then-Else formulas .................................................................. |
316 |
How to print Time or dateTime values conditionally .......................................... |
317 |
How to create multi-condition If-Then-Else formulas ......................................... |
317 |
How to format text with formulas ....................................................................... |
318 |
How to use variables in formulas ....................................................................... |
319 |
How to declare a variable .................................................................................. |
322 |
How to assign a value to a variable .................................................................... |
323 |
How to combine a variable declaration and assignment expression .................. |
325 |
How to declare and assign values to multiple variables ..................................... |
325 |
How to conditionally assign values to variables ................................................ |
325 |
How to use an array in a formula ....................................................................... |
326 |
How to use a range in a formula ........................................................................ |
328 |
vi
How to use semicolons in formulas ................................................................... |
331 |
How to fine-tune group selection formulas ........................................................ |
331 |
How to fine-tune record selection formulas ....................................................... |
333 |
How to debug a formula .................................................................................... |
336 |
Chapter 15 - Running Totals |
|
Introduction ...................................................................................................... |
342 |
HANDS-ON (Running Totals) ....................................................... |
343 |
How to maintain running totals in a list ............................................................ |
343 |
How to create a running total for a group .......................................................... |
345 |
How to create a conditional running total .......................................................... |
346 |
How create a running total in a one to many linking relationship ..................... |
348 |
Chapter 16 - Parameter Fields |
|
Parameter field objects overview ....................................................................... |
352 |
Multiple parameter fields ................................................................................... |
353 |
Parameter field considerations ........................................................................... |
353 |
HANDS-ON (Parameter Field Objects) ......................................... |
354 |
How to create a parameter field ......................................................................... |
354 |
How to set record selection using parameter fields ............................................ |
359 |
How to use a parameter field in a formula ......................................................... |
362 |
How to respond to parameter field prompts ....................................................... |
362 |
How to conditionally format using parameter fields .......................................... |
364 |
How to create a report title using parameter fields ............................................. |
366 |
How to set sort order using parameter fields ..................................................... |
366 |
Chapter 17 - Charting |
|
Charting Overview ............................................................................................. |
370 |
Choosing a chart type ........................................................................................ |
370 |
Where to place a chart ....................................................................................... |
373 |
Analyzer Tab ..................................................................................................... |
374 |
Data you can chart on ....................................................................................... |
374 |
Before you create a chart ................................................................................... |
374 |
HANDS-ON (Charting) ................................................................. |
375 |
How to chart on a summary or subtotal field (group charts) ............................... |
375 |
How to chart on a details field ........................................................................... |
376 |
vii
How to chart on a formula field ......................................................................... |
377 |
How to chart on cross-tab summaries ................................................................ |
379 |
How to chart on an OLAP cube ......................................................................... |
379 |
How to edit a chart using the Chart Expert ......................................................... |
380 |
How to edit charts using PGEditor ..................................................................... |
380 |
How to change chart size and position .............................................................. |
381 |
How to change the border of a chart .................................................................. |
381 |
How to use the underlay feature with charts ...................................................... |
382 |
How to analyze a chart ...................................................................................... |
382 |
Chapter 18 - Mapping |
|
Mapping Overview ............................................................................................ |
386 |
Choosing a map ................................................................................................. |
386 |
Where to place a map ........................................................................................ |
390 |
Analyzer Tab ..................................................................................................... |
391 |
Data you can map on ........................................................................................ |
391 |
For more map information ................................................................................. |
391 |
HANDS-ON (Mapping) ................................................................. |
391 |
How to create and insert a map ......................................................................... |
391 |
How to map on a group ..................................................................................... |
393 |
How to map on a detail field ............................................................................. |
393 |
How to map on a cross-tab ................................................................................ |
394 |
How to map on an OLAP cube .......................................................................... |
396 |
How to map on a subreport ............................................................................... |
396 |
How to edit a map using the Map Expert ........................................................... |
397 |
How to change map size and position ............................................................... |
397 |
How to change the border of a map ................................................................... |
398 |
How to use the underlay feature with maps ....................................................... |
398 |
How to analyze a map ....................................................................................... |
399 |
Chapter 19 - OLE |
|
OLE Objects Overview ...................................................................................... |
404 |
Inserting OLE objects into reports ....................................................................... |
406 |
Linked vs. Embedded Objects ............................................................................ |
406 |
Dynamic OLE menu commands ........................................................................ |
407 |
OLE and the Picture command .......................................................................... |
408 |
General OLE considerations ............................................................................... |
408 |
viii
HANDS-ON (OLE Objects) ........................................................... |
409 |
How OLE objects are represented in a report ..................................................... |
409 |
How to use OLE - General Overview Tutorial .................................................... |
409 |
How to insert a graphic/picture as an OLE object .............................................. |
412 |
Chapter 20 - Subreports |
|
What are subreports? ......................................................................................... |
416 |
Unlinked vs. linked subreports ........................................................................... |
416 |
How subreport linking works ............................................................................. |
417 |
Database links vs. subreports in one-to-many situations ..................................... |
418 |
HANDS-ON (Subreports) .............................................................. |
419 |
How to insert a subreport ................................................................................... |
419 |
How to preview a subreport ............................................................................... |
421 |
How to link a subreport to the data in the primary report ................................... |
421 |
How to link a subreport to the main report without modifying |
|
the selection formula .................................................................................... |
424 |
How to combine unrelated reports by using subreports ..................................... |
425 |
How to use subreports with unlinkable data ...................................................... |
427 |
How to create an on-demand subreport ............................................................. |
429 |
How to add captions to subreports ..................................................................... |
430 |
How to show different views of the same data in one report .............................. |
431 |
How to save a subreport as a primary report ...................................................... |
432 |
Chapter 21 - Document Import Tool |
|
The Document Import Tool ................................................................................ |
434 |
HANDS-ON (Document Import Tool) .......................................... |
435 |
How to use the Document Import Tool .............................................................. |
435 |
How to set report font size ................................................................................. |
441 |
How to define custom colors ............................................................................. |
441 |
How to specify a custom formula ....................................................................... |
442 |
Chapter 22 - Cross-Tab Objects |
|
Cross-tab overview ............................................................................................ |
444 |
Cross-tab components ........................................................................................ |
448 |
HANDS-ON (Cross-Tab Objects) .................................................. |
450 |
ix
How to create a cross-tab object ........................................................................ |
450 |
How to create a cross-tab with multiple rows/columns ..................................... |
453 |
How to create a cross-tab with multiple summary fields ................................... |
456 |
How to format a cross-tab .................................................................................. |
460 |
Chapter 23 - The Crystal SQL Designer |
|
The Crystal SQL Designer .................................................................................. |
466 |
HANDS-ON (Queries) .................................................................. |
468 |
How to use an SQL query that was designed elsewhere .................................... |
468 |
How to create a new query ................................................................................ |
470 |
How to add tables to a query ............................................................................. |
471 |
How to link tables and specify a join type .......................................................... |
472 |
How to add fields to a query .............................................................................. |
474 |
How to identify unique values in a query ........................................................... |
475 |
How to summarize data with aggregate functions .............................................. |
476 |
How to sort records according to field values .................................................... |
477 |
How to specify records to be included in a query .............................................. |
478 |
How to select groups to be included in a query ................................................. |
479 |
How to create an SQL expression ...................................................................... |
481 |
How to create a query from another Crystal Query ............................................ |
483 |
How to select a query for a report ...................................................................... |
484 |
Chapter 24 - Dictionaries |
|
Dictionaries Overview ...................................................................................... |
488 |
HANDS-ON (Dictionaries) .......................................................... |
489 |
How to create a new dictionary ........................................................................ |
489 |
How to add a data file ...................................................................................... |
490 |
How to open an SQL or ODBC data source ...................................................... |
492 |
How to link multiple tables ............................................................................... |
493 |
How to select tables and fields for users ........................................................... |
494 |
How to add/create formulas ............................................................................. |
495 |
How to rename fields, field headings, and formulas ........................................ |
497 |
How to move fields/field headings within the list ............................................ |
498 |
How to update the location of a database table ............................................... |
498 |
How to add a new field heading ....................................................................... |
499 |
How to add Help text ....................................................................................... |
500 |
How to add a graphic ....................................................................................... |
501 |
x
How to create sample data for users to browse ................................................ |
502 |
How to edit an existing dictionary .................................................................... |
503 |
How to convert a 4.x or 5.x dictionary file ......................................................... |
504 |
How to select a dictionary for a report .............................................................. |
504 |
Chapter 25 - Working With Databases |
|
Databases Overview .......................................................................................... |
508 |
Server-side processing ........................................................................................ |
542 |
Remapping database fields ................................................................................. |
545 |
For additional information ................................................................................. |
548 |
HANDS-ON (Working With Databases) ....................................... |
548 |
How to open Access queries through DAO ........................................................ |
548 |
How to open Access queries through ODBC ..................................................... |
550 |
How to open Access parameter queries ............................................................. |
552 |
How to set up an ODBC data source ................................................................. |
556 |
How to check settings for an ODBC data source ................................................ |
558 |
How to log on to an ODBC data source ............................................................. |
559 |
How to add an ODBC database table to a report ............................................... |
560 |
How to log on to MS SQL Server via ODBC ...................................................... |
561 |
How to log off an ODBC data source ................................................................. |
563 |
How to change the ODBC data source accessed by a report .............................. |
563 |
How to select a stored procedure from an SQL database and change |
|
stored procedure parameters ........................................................................ |
566 |
How to set up an A to B, A to C link .................................................................. |
569 |
How to edit an SQL query ................................................................................. |
570 |
How to use an ACT! database ............................................................................ |
571 |
How to open the NT Event Log .......................................................................... |
572 |
How to enable server-side processing ................................................................ |
574 |
How to remap altered database fields ................................................................ |
575 |
How to remap database fields ............................................................................ |
576 |
Chapter 26 - Data Sources |
|
Introduction ....................................................................................................... |
580 |
Four types of data .............................................................................................. |
581 |
Direct access database files ................................................................................ |
581 |
ODBC data sources ........................................................................................... |
601 |
Crystal SQL Designer files .................................................................................. |
615 |
xi
Crystal Dictionary files ...................................................................................... |
617 |
Appendix A - Report Processing Model |
|
Multi-pass reporting .......................................................................................... |
622 |
Appendix B - Product Support |
|
Product support ................................................................................................. |
626 |
Web support ...................................................................................................... |
626 |
E-mail support .................................................................................................... |
627 |
Fax support ........................................................................................................ |
627 |
Technical support .............................................................................................. |
628 |
Knowledge Link ................................................................................................. |
629 |
Product registration ............................................................................................ |
629 |
Product return policy ......................................................................................... |
630 |
Product replacement policy ............................................................................... |
631 |
Appendix C - Seagate Software International |
|
Office Directory |
|
North/South American Head Office ............................................. |
634 |
USA and Latin America ................................................................. |
635 |
Asia/Pacific Offices ....................................................................... |
635 |
Europe/Middle East/Africa Offices ................................................ |
638 |
France – Southern European Head Office ..................................... |
642 |
South Africa Regional Office (Southern & Central Africa) ............ |
644 |
Middle East Regional Office (ME & Northern Africa) .................... |
645 |
Glossary |
|
Index |
|
xii

Welcome to
Seagate Crystal Reports
What you will find in this chapter...
Welcome, Page 2
Two kinds of Hands-On tutorials, Page 2
Command, button, key, and control conventions, Page 3 Using Seagate Crystal Reports documentation, Page 5 Seagate Crystal Reports online Help features, Page 5
If you need more help..., Page 9
Welcome to Seagate Crystal Reports |
1 |

Welcome
Welcome to Seagate Crystal Reports, the most powerful Windows reporting tool available today.
●If you are new to the product, you will soon understand why more than one million users worldwide turn to Seagate Crystal Reports for all their reporting needs.
●If you are upgrading, thanks for your vote of confidence. Every effort has been made to make this release the best ever, offering major improvements over earlier versions.
This manual has been designed to fit the way users say they work. The emphasis is on getting the job done in the easiest way possible. To eliminate confusion, a show-as-you-go style that uses pictures liberally to demonstrate procedures has been adopted.
This manual contains instructions for most of the typical reporting tasks and for some very sophisticated tasks as well. It also contains a great deal of conceptual information to help you better understand databases, reporting, and the program itself.
There are many topics in this manual that deal with general areas of interest such as placing fields, formatting your report, and sorting records, as well as, topics that deal with more specific areas of interest such as advanced formula creation and accessing different types of data.
In most chapters, the Hands-On topics flow from general to more specific areas of interest. Consult What you will find in this chapter... (found on the first page of each chapter) to target the information you need in a hurry.
Two kinds of Hands-On tutorials
|
Hands-On sections in this manual contain two types of tutorials: |
|
|
1. |
Overview, and |
|
2. |
Procedural. |
Overview |
Overview tutorials present an overall view of a process. They are |
|
tutorials |
designed to provide an understanding of the concepts involved and are |
|
cross-referenced to procedural tutorials for step-by-step instructions on completing core procedures contained within them. For example, a typical overview tutorial might discuss how to place three unrelated reports in a single report. One of the process steps is, “Create the first
2 |
Seagate Crystal Reports User’s Guide |

|
subreport”. No details on how to do this are provided in the overview |
|
tutorial; a cross-reference is included to the procedural tutorial that will |
|
explain in a detailed fashion how to create a subreport. |
Procedural |
Procedural tutorials demonstrate core procedures that are used again and |
tutorials |
again. For example, even though you may use subreports in many |
|
different situations, the two detailed procedures you need to understand |
|
are: |
|
1. how to insert a subreport, and |
|
2. how to link a subreport to the data in the primary report. |
|
Each of these is explained in a step-by-step fashion using detailed process |
|
tutorials. |
Command, button, key, and control conventions
Commands and buttons
Key combinations
Dialog box controls
Other conventions
This manual uses the following conventions:
For easy recognition, command names and button names from the Standard, Supplementary, Analyzer, and Formatting toolbars are displayed in small caps. For example: NEW command, PRINT button, etc.
Keyboard shortcuts appear in the following forms:
●Delete means the Del key (either the Delete key, or the Del key on your numeric keypad).
●Enter means the Enter, Return, CR, or key, depending on which of these keys appears on your keyboard.
●Ctrl-Key, Shift-Key, and Alt-Key are examples of the notation for two-key combinations. Press the first key in the combination (Control, Shift, or Alt), and, at the same time, press the second key in the combination (designated above as Key). For example: Ctrl-C means to hold the Control key down and then press the letter C on your keyboard (Ctrl-C is the Windows Copy command).
Buttons, lists, check boxes, and other dialog box elements are displayed in italics. For example, Suppress check box, OK button, etc.
●Text enclosed in double brackets (for example, «information») is intended to expand or explain the information that it follows.
●Computer type indicates data that you are to enter using the computer keyboard. It is also used to show example formulas.
Welcome to Seagate Crystal Reports |
3 |
●Field names appear in the following format:
{file.FIELD}
¾file represents the alias of the table the field comes from.
¾FIELD represents the name of the field in that table.
●Portions of underlined text within normal text require special attention.
●NOTES are used to provide extra or special information regarding the preceding topic.
●\WINDOWS\SYSTEM refers to the System subdirectory of the Windows directory on your computer or network server. By default, this directory is C:\WINDOWS\SYSTEM in Windows 3.1, Windows 95, and Windows 98 and C:\WINNT\SYSTEM32 in Windows NT 3.51 or later. This directory may be different on your system. If you are unsure, contact your network administrator, or refer to your Windows documentation.
●Related Topics lists point to other topics in this manual and online Help systems that deal with related procedures, additional uses for the same command or dialog box, or alternative methods for accomplishing the same task.
●Not all of the pictures used in the Hands-On tutorial sections reflect exactly what you will see on-screen.
¾Some of the example reports have been designed to illustrate concepts only, not the actual look of a finished report.
¾Some menus have been shortened by removing commands that are unrelated to the current discussion.
¾The data in some lists has been abbreviated to focus attention on specific items of interest.
¾In some cases, an individual screenshot illustrates both a before and after picture of a dialog box when such an illustration can be done without confusion.
●In the Hands-On tutorial sections, be sure to pay attention to the callout text accompanying all screenshots and graphics. Often the callouts are steps necessary to complete the tutorial and to pass by one inadvertently may cause undesirable or incorrect results.
4 |
Seagate Crystal Reports User’s Guide |

Using Seagate Crystal Reports documentation
In addition to this User’s Guide, the product includes a comprehensive set of online and printed learning tools to help you when you are getting started with the program and when you need answers fast in your day- to-day reporting.
Whether you are a beginner or an expert, this documentation will provide a clear and easy path to productivity. For a complete description of learning tools and suggested learning paths, see Learning Seagate Crystal Reports, Page 27.
PROFESSIONAL EDITION FEATURES
This User’s Guide is distributed with both the Standard and Professional Editions of the program. The following list identifies features and capabilities discussed in the User’s Guide but available only in the Professional Edition:
●Crystal Web Report Server
●Crystal Report Engine Automation Server
●Crystal Report Engine Object Library
●Active Data Driver
●Crystal Data Object (CDO)
●Crystal Dictionaries
●Crystal Query Designer
●Crystal SQL Designer
●Reading SQL databases
●Reading Microsoft Exchange data files
●Exporting to ODBC data sources
Seagate Crystal Reports online Help features
The online Help systems included with this program are full of useful information.
● Seagate Crystal Reports online Help (CRW.HLP)
Seagate Crystal Reports online Help includes all the information included in the Seagate Crystal Reports User’s Guide, with special emphasis on helping the user understand the interface with hundreds of “How to” tutorials.
Welcome to Seagate Crystal Reports |
5 |
●Crystal Query Designer online Help (CRQUERY.HLP)
Crystal Query Designer online Help provides information about the Crystal Query Designer, a new tool that allows you to design and preview reports and queries from any Java enabled web browser.
●Crystal SQL Designer online Help (CRSQL.HLP)
Crystal SQL Designer online Help includes all the information you need in order to create and edit SQL queries for use in creating reports.
●Developer’s online Help (DEVELOPR.HLP)
Developer’s online Help includes descriptions of all functions and structures, conceptual information, and sample code for:
¾ActiveX
¾Crystal Report Engine Automation Server
¾Active Data Driver
¾NewEra
¾PEPlus
¾Report Designer Component
¾Report Engine API
¾Visual Basic API
¾VBX
¾VCL
¾Web Report Server
●Dictionary online Help (DICTN.HLP)
Dictionary online Help includes all the information you need in order to create, modify, and work with dictionaries.
●Document Import Tool online Help (CRDIT.HLP)
Document Import Tool online Help includes all the information you need in order to convert text reports to Seagate Crystal Reports with the Document Import Tool.
●Mapping online Help (CRMAP.HLP)
Mapping online Help includes all the information you need in order to place complex geographic maps in reports, for better data analysis and trend identification.
●ReadMe online Help (README.HLP)
ReadMe Help includes topics such as the following:
¾Installation Topics
¾Configuration and Setup Topics
6 |
Seagate Crystal Reports User’s Guide |
¾Quick Start
¾Worldwide Office Directory
●Report Designer Component online Help (CRRDC.HLP)
This help file contains descriptions of all the functions and structures, conceptual information, and sample code for the Report Designer Component.
●Reports at a Glance online Help (RPTGLANC.HLP)
Reports at a Glance online Help is a complete online help system for the Reports at a Glance application.
●Runtime File Requirements online Help (RUNTIME.HLP)
Runtime Help including all the distributed DLLs and UFLs, including:
¾the exact name,
¾location, and
¾description.
●Web Report Server online Help (CRWEB.HLP)
Web Report Server online Help includes all the information you need to set up and view reports over an intranet or extranet.
Here is just a sampling of topics you will find in these help files:
●Explanations of error messages and formula compiler errors. Search for Error Messages and Formula Compiler Warnings in Seagate Crystal Reports online Help.
●Runtime information so you will know which files to include when using the Crystal Report Engine with your application. See Runtime File Requirements in Seagate Crystal Reports online Help.
●Tips and Tricks
Dozens of helpful hints for working with Seagate Crystal Reports. Search for Tips and Tricks in Seagate Crystal Reports online Help.
●Formulas for study
A series of complex formulas that showcase the use of Seagate Crystal Reports functions, operators, and the formatting language in solving a number of real-world reporting problems. Search for Formulas in Action Index in Seagate Crystal Reports online Help.
Welcome to Seagate Crystal Reports |
7 |
●Specialized formulas
A collection of formulas that address specific reporting needs. Search for Specialized Formulas in Seagate Crystal Reports online Help.
●Sample formulas
A number of topics contain sample formulas that can be cut and pasted directly into the Formula Editor to save you time. Search for Copying formulas from online Help in Seagate Crystal Reports online Help.
●Formula functions and operators
A complete and detailed list of all functions and operators you can use when creating formulas including specialized financial functions used to design sample reports. Search for Functions or Operators, or for an individual function or operator by name in Seagate Crystal Reports online Help.
●Full documentation of the Report Engine API. Search for Report Engine Functions in Developer’s online Help.
●Sample code for making calls to the Report Engine from your C, Visual Basic, or Delphi application. Use the Copy (Ctrl-C) and Paste (Ctrl-V) commands built into Windows Help to copy this code and paste it as ASCII text into any editor that supports Windows Copy and Paste procedures. Search for Copying code from online Help in Developer’s online Help.
●Full documentation of the Report Engine Class Library, a C++ class library addition to the Microsoft Foundation Class Library. Use the class definition in the Report Engine Class Library to access the Crystal Report Engine from your C++ application. Search for Class Library Index in Developer’s online Help.
●Full documentation for the Crystal Custom Control, the Crystal ActiveX control, and the Crystal VCL you can use when working with development environments that support them. Search for The Crystal Custom Control, The Crystal ActiveX Control, or The Crystal VCL in Developer’s online Help.
●Breakdown of sample applications included with the program. Search for Sample Applications in Developer’s online Help.
Online Help is a warehouse of information that can make reporting more productive and enjoyable. A comprehensive indexing system and hundreds of search terms provide a variety of avenues for finding the help you need, right from your computer. Once you see what is in the help system, you will most definitely return to it often.
8 |
Seagate Crystal Reports User’s Guide |
If you need more
help...
WEB SITE
http://www.seagatesoftware.com/
E-mail address: support@webacd.seagatesoftware.com.
Send a blank e-mail first to obtain a support template and follow the instructions in the e-mail, or submit your questions by web browser at:
http://webacd.seagatesoftware.com.
E-MAIL NOTIFICATION SERVICE
http://maillist.seagatesoftware.com/subscribe.asp
FAX SUPPORT
Fax Support (604) 681-7163
TELEPHONE SUPPORT
Telephone Number (604) 669-8379
For more information on these services, please see Product Support, Page 625.
Welcome to Seagate Crystal Reports |
9 |
10 |
Seagate Crystal Reports User’s Guide |

1 |
Installation and Quick Start |
What you will find in this chapter...
Installation Requirements, Page 12 16-bit version, Page 12 32-bit version, Page 12
Installation, Page 12
Windows 3.1 or NT 3.51, Page 12
Windows 95, Windows 98 or NT 4.0, Page 13 Installing on a network, Page 13
Upgrading from a previous version, Page 14 Windows 95, Windows 98 or NT 4.0, Page 13
Upgrading from a previous version, Page 14 Quick Start, Page 15
Installation and Quick Start |
11 |

Installation Requirements
16-bit version
32-bit version
The 16-bit version of the program has the following installation requirements:
●Microsoft Windows 3.1 or higher
●Minimum RAM: 16 MB (32 MB for Windows NT 3.51 or higher)
●Minimum hard drive space required: 10 MB (Full Install 120 MB)
●Maximum hard drive space required:
¾75 MB for the Standard Edition
¾108 MB for the Professional Edition
The 32-bit version of the program has the following installation requirements:
●Microsoft Windows 95, Windows 98 or Microsoft Windows NT 3.51 or higher
●Minimum RAM: 16 MB (32 MB for Windows NT)
●Recommended RAM: 32 MB
●Minimum hard drive space required: 24 MB (Full Install 172 MB)
●Maximum hard drive space required:
¾ 90 MB for the Standard Edition
¾ 148 MB for the Professional Edition
If your system does not meet these requirements, the program may not run correctly.
Installation
|
Insert the CD or diskette into the appropriate disk drive. |
|
Windows |
1 |
Choose the RUN command from the File Menu. |
3.1 or NT 3.51 |
2 |
When the Run dialog box appears, type: |
x:\setup
«x represents the appropriate drive letter.»
12 |
Seagate Crystal Reports User’s Guide |

Windows 95, Windows 98 or NT 4.0
For example, if the CD is in drive D:, type:
D:\setup
3Click OK or press Enter to activate the installation program. The Installation dialog box appears.
4Follow the directions on the screen to set up the program.
During the installation procedure, you can choose a Typical or Custom installation.
●If you select Typical, the program will be installed with the most common options.
●If you select Custom, you will be given the opportunity to select which program files are installed to the hard drive.
1Choose RUN from the Start Menu.
2When the Run dialog box appears, type: x:\setup
«x represents the appropriate drive letter.» For example, if the CD is in drive D:, type:
D:\setup
3Click OK or press Enter to activate the installation program. The Installation dialog box appears.
4Follow the directions on the screen to set up the program.
During the installation procedure, you can choose a Typical or Custom installation.
●If you select Typical, the program will be installed with the most common options.
●If you select Custom, you will be given the opportunity to select which program files are installed on your hard drive.
Installing on a network
To run Seagate Crystal Reports from a server you will need to install it to the server and then run a workstation setup application on each workstation that will run Seagate Crystal Reports.
Installation and Quick Start |
13 |

The workstation setup application is installed in the \CRW16\CLIENT16 (16-bit) or \Program Files\Seagate Software\Crystal Reports (32-bit) directory on the network drive.
To install on the server:
1Choose a Custom install.
2When the Custom Installation Options dialog box appears, verify that the Workstation Setup option is checked.
To set up a workstation:
1From the Program Manager, choose Run from the File Menu (Windows 3.x or NT 3.51), or choose Run from the Start Menu (Windows 95 and 98 or NT 4.0). The Run dialog box appears.
2In the Run dialog box, highlight the network drive and directory in which the Workstation Setup resides and run the SETUP.EXE application.
3Follow the directions on the screen to set up your workstation.
Upgrading from a previous version
If you are upgrading from a previous version, the installation routine ensures that there will be no conflict between different versions of the program running on the same machine. When the setup application finds a previous version of the program on a system, it:
●installs the program to the specified directory,
●installs the new CRPE.DLL into the \WINDOWS\SYSTEM directory,
●renames DLLs installed by the previous version in the WINDOWS\CRYSTAL directory, with *.OLD extensions (if, for some reason, you need to use the older versions of the files later on, you only need to rename them back to a *.DLL extension),
●installs the PD*.DLLs and UX*.DLLs (16-bit) or the P2*.DLLs and U2*.DLLs (32-bit), and several other DLL files required by the program into the WINDOWS\CRYSTAL and WINDOWS\SYSTEM directory and changes their extensions from *.DLL to *.OLD, and
●installs any common third party DLLs such as CTL3DV2.DLL or WBTRCALL.DLL to the WINDOWS\SYSTEM directory.
14 |
Seagate Crystal Reports User’s Guide |
Quick Start
If you are an experienced Windows user who wants to get right into the program, follow these steps to set up a report for the first time.
NOTE: If you are not an experienced user, please refer to Learning Seagate Crystal Reports, Page 27.
1In Windows 3.1 and NT 3.51, start the program by double-clicking the Seagate Crystal Reports icon in the Program Manager.
●In Windows 95, Windows 98 and NT 4.0, click Start, then select Seagate Crystal Reports from the Seagate Crystal Reports program folder.
2Click the NEW button on the Standard toolbar. The Report Gallery appears.
3To build the report:
●select one of the eight Experts,
●click Another Report to use a template, or
●click Custom to build a custom report. If you click Custom, the Report Gallery expands, and you can then select a Report Type and Data Type for a custom report.
4If you choose Custom and select:
●Data File, the Choose Database File dialog box appears. Select the first database you want to activate for the report.
●SQL/ODBC, the Log On Server dialog box appears. Highlight the data source you want, click OK, and when the Choose SQL Table dialog box appears, highlight the first table you want to use.
●Dictionary, the File Open dialog box appears. Highlight the dictionary you want to use for the report.
The Design Tab appears with Report Header, Page Header, Details, Page Footer, and Report Footer areas. A report is created by inserting and formatting items in each of these areas.
NOTE: To use additional database tables for a report and match them up on a record-by-record basis, click the LINK EXPERT button on the
Supplementary toolbar, select the table(s), and then set up the links in the Visual Linking Expert when it appears. Search for Visual Linking Expert in
Seagate Crystal Reports online Help.
Installation and Quick Start |
15 |

5Each of the default report areas contains a single section. To add additional sections, click the SECTION EXPERT button on the Standard toolbar and use the Section Expert to add the desired sections.
Once you have added sections to an area, you can move, merge, and delete them in the Section Expert. See How to add, delete, and move guidelines, Page 72.
6To toggle the grid on and off, choose the OPTIONS command on the File Menu and make your changes in the Options dialog box when it appears. See How to turn the grid on/off, Page 76.
7If you are working with the grid off and you want to use snap-to guidelines for positioning objects, click the top or left ruler wherever you want guidelines to appear.
●Drag a field to a guideline until it snaps to the guideline.
●Drag the guideline arrow to move the guideline (and any objects that are snapped to it).
●Drag the guideline arrow away from the ruler to remove the guideline. See How to add, delete, and move guidelines, Page 72, and How to move and position objects using guidelines, Page 73.
8If the Insert Fields dialog box is not visible, click the INSERT FIELDS button on the Standard toolbar. The Insert Fields dialog box appears with the Database Tab active, and displays a list of the fields in the active database table(s). To speed the entry of multiple fields, the box remains on-screen until you click Close. This dialog box can be moved to a new location or resized, if you wish. See How to insert database fields, Page 105.
9Select the field(s) you want to appear on the report. You can select and place them one at a time, or you can use the Shift-click combination to select a number of contiguous fields, or the Ctrl-click combination to select fields from the list at random. Drag and drop is also active. Place the fields in the Details section where you want them to appear.
10When you place multiple fields, they will appear in the same order that they appear in the Insert Fields dialog box. The program marks the position of each field with a rectangular frame. The characters in the frame indicate whether the field is text (xxx...), number (555...), currency ($555...), date (12/31/99), time (00:00:00), dateTime (12/31/ 99 00:00:00), or Boolean (T/F).
NOTE: The field names and field types can be viewed by toggling the Show Field Names check box on in the Options dialog box (Layout Tab). Search for Setting up Seagate Crystal Reports in Seagate Crystal Reports online
Help.
16 |
Seagate Crystal Reports User’s Guide |
NOTE: The program automatically places field titles in the Page Header section unless the Insert Detail Field Titles check box is toggled off in the Options dialog box (Layout Tab). Search for Configuring Seagate Crystal Reports in Seagate Crystal Reports online Help.
NOTE: If additional Details sections are added to the report, please note that field titles will only be placed in the Page Header section for fields in the Details A (the original) section of your report.
11Once the objects are in place, you may want to adjust the report sections somewhat. To do this, right-click the shaded area to the left of the section ruler and use the shortcut menu that appears.
●To expand a section to accommodate an additional line, choose the INSERT LINE command.
●To have the program automatically align the objects in the section horizontally, choose the ARRANGE LINES command.
●To reduce the size of a section to eliminate unnecessary white space above and below objects, choose the FIT SECTION command. See How to add/delete white space between rows, Page 218.
12To create a report title, you must first enter the title in the Document Properties dialog box. Choose the SUMMARY INFO command from the File Menu. Enter a title in the Title text box of the Document Properties dialog box. Click OK.
13Choose the REPORT TITLE command from the Insert|Special Fields Menu. A rectangular placement frame appears when you move the cursor over your report. Click once in the Report Header (RH) section to place the report title. The report title field contains the text that you typed in the Title text box of the Document Properties dialog box. See How to add a title page to the report, Page 117.
14To see how the results will print, click the PRINT PREVIEW button on the Standard toolbar.
To speed processing time while building a report, you can preview the report using only a small subset of the available data. To do this, choose the PREVIEW SAMPLE command from the File|Print Menu. See
Preview Tab, Page 61.
In either case, the program takes you to the Preview Tab. You can finetune a report in the Preview Tab while viewing the results as actual report data. You can also close the Preview Tab and continue working on the report in the Design Tab.
Installation and Quick Start |
17 |
15If you want to:
●format a field,
●change the placement or width of a field, or
●insert a subtotal or grand total,
click the field to select it. Handles appear on the top, bottom, and sides of each selected field.
●To change the placement of the field(s), use the mouse to drag the field placement frame to its new position.
●To change the width of the field, use the mouse to drag the right or left handle.
●Right-click the field to format font, alignment within field, number, currency, date display, border, color, indentation, or to summarize the field. A shortcut menu appears listing various commands for formatting and summarizing the field.
NOTE: To apply formatting only under certain conditions, click Conditional Formula next to the formatting property in the Format Editor, and create a formula that defines those conditions. See Conditional formatting, Page 212.
NOTE: Many of the font and formatting options are available on the formatting toolbar. See Status bar, Page 51, for more information on the options available.
16To create a formula that makes data calculations or comparisons, click the INSERT FIELDS button on the Standard toolbar. When the Insert Fields dialog box appears, click the Formula Tab to activate it.
17Click New. The Formula Name dialog box appears. Enter a name for the formula and click OK. The Formula Editor appears.
18Enter the formula in the Formula Editor. Enter fields, operators, and functions by selecting them from their respective scroll lists or by typing them in. You can check the formula syntax by clicking Check.
19When you are finished editing, click Close to return to the Insert Fields dialog box. Click Insert to place the formula just like you would a database field. See Introduction to Formulas, Page 291, and Advanced Formulas, Page 315, or search for Functions and Operators and Variables in Seagate Crystal Reports online Help.
20To insert a subreport (a report within a report), click the INSERT SUBREPORT button on the Supplementary toolbar and choose an existing report to import as a subreport or use the Create Report Expert to create a new subreport. See How to insert a subreport, Page 419.
●If you want the records in a subreport to match up with the records in a primary report, click the Link Tab of the Insert
18 |
Seagate Crystal Reports User’s Guide |
Subreport dialog box and specify the link in the Subreport Links dialog box when it appears. See How to link a subreport to the data in the primary report, Page 421.
21To insert a cross-tab object in a report, click the INSERT CROSS-TAB button on the Supplementary toolbar and set up the cross-tab in the Cross-Tab dialog box when it appears. See Cross-Tab Objects, Page 443.
22To create a parameter field (a field that prompts you for a value whenever you retrieve data for a report), click the INSERT FIELDS button on the Standard toolbar, then click the Parameter Tab in the Insert Fields dialog box when it appears. Click New to set up a parameter field. Once created, you can insert the parameter field in a report like a database field or select it from the Fields list in the Formula Editor.
Parameter fields can be used in reports (as title or label prompts), in selection formulas (as selection criteria prompts), and in formulas (for a variety of purposes including specifying sort fields). See Parameter Fields, Page 351.
23To add a chart, click the INSERT CHART button on the Standard toolbar. See Charting, Page 369.
24To insert a spreadsheet, picture, or other OLE object that you can edit from within Seagate Crystal Reports using the tools from the object’s native application, choose the OBJECT command from the Insert menu. See OLE, Page 403, and How to insert a graphic/picture as an OLE object, Page 414.
25To change the record sort order, click the SORT ORDER button on the Standard toolbar. The Record Sort Order dialog box appears. Select the field(s) you want to use for sorting the report data and the sort direction. See How to do a single field sort, Page 253.
26To limit the report to specific records (for example, the records of California customers who have year-to-date sales greater than $10,000), click the first field on which you want your selection to be based and then click the SELECT RECORDS button on the Standard toolbar. When the Select Expert appears, set up the record selection criteria.
27To print the report, click the PRINT button on the Standard toolbar.
That’s it! It is that easy to build a report. To practice concepts introduced in this Quick Start, proceed to Tutorial - Customer List, Page 147.
Installation and Quick Start |
19 |
20 |
Seagate Crystal Reports User’s Guide |

2 |
What’s New |
What you will find in this chapter...
New Crystal Query Designer provides greater power and speed, Page 22
Report Designer Component, Page 22
Map Expert helps identify trends, Page 22
Enhanced charting capabilities help you analyze data, Page 23
Enhanced cross-tab features make cross-tab reports more powerful than ever,
Page 23
Server-side processing saves time and memory, Page 23
Running totals -- one field is all you need, Page 24
Document Import Tool converts old text reports, Page 24
Entering SQL expressions directly helps you create reports faster, Page 24
Highlighting Expert makes formatting faster and easier, Page 25
Field Mapping provides more database control, Page 25
Enhanced Formula Editor makes creating formulas easy, Page 25
Enhanced exporting capabilities, Page 26
New and better parameter fields provide greater flexibility, Page 26
On-Demand subreports increase report organization, Page 26
What’s New |
21 |

New Crystal Query Designer provides greater power and speed
With an easy-to-use interface and web-enabled design capabilities, Seagate Crystal Reports new Crystal Query Designer allows you to quickly design and preview ad hoc reports. The Query Designer gives you the basic formatting and charting capabilities of Seagate Crystal Reports, but does not burden you with the more advanced features. Plus, the tool uses page-on-demand technology. Now you can create ad hoc reports quickly and easily, letting the program do most of the work for you. The Crystal Query Designer is a 100% Java client. You don’t need any plug-ins to install and maintain it. For more information, see Crystal Query Designer online Help (CRQUERY.HLP).
Report Designer Component
Seagate Crystal Reports now includes the Report Designer Component, a powerful ActiveX designer for Visual Basic. The Report Designer Component allows you to design reports using all of the advanced reporting features of Seagate Crystal Reports all within the Visual Basic development environment. The Report Designer Component also provides a complete object model, allowing you to design custom interfaces for user input that controls report data. For more information, see the Report Designer Component online Help (CRRDC.HLP).
Map Expert helps identify trends
This version of Seagate Crystal Reports provides a new Map Expert that allows you to insert geographic maps into your reports. A map is a powerful analysis tool. You can map on summary fields, subtotal fields, and cross-tab summaries, then drill-down on the map to view organized sets of data (such as sales by state). Seagate Crystal Reports provides four map layouts and five map types. The program also offers a new view called the Analyzer Tab, which allows you to set the properties for an individual instance of a map, independently of the rest of the report. This new mapping feature makes it easier than ever to identify trends in data. For more information about the Map Expert, see Mapping, Page 385.
22 |
Seagate Crystal Reports User’s Guide |

Enhanced charting capabilities help you analyze data
The Chart Expert is now much more powerful, providing maximum charting flexibility by offering 11 chart types and 47 chart templates (as well as an editor for creating custom charts). Now you can create Bubble charts, Radar charts, and XYZ Scatter charts, among others. The program also offers a new view called the Analyzer Tab, which allows you to set the properties for an individual instance of a chart, independently of the rest of the report. This new charting feature makes it easier than ever to organize and analyze data. For more information about the Chart Expert, see Charting, Page 369.
Enhanced cross-tab features make cross-tab reports more powerful than ever
Many advanced options have been added to cross-tabs in this version.
With these advanced options, you can:
●Suppress empty rows and columns,
●Suppress subtotals and grand totals,
●Split wide cross-tabs over page breaks and repeat the row labels,
●Specify separate background colors for row and column grand totals,
●Conditionally format the contents of individual cross-tab cells, and
●Specify order grouping for rows and columns.
For more information about advanced cross-tab options, see Cross-Tab
Objects, Page 443.
Server-side processing saves time and memory
You can now choose to have the program perform its grouping on the server. In this event, Seagate Crystal Reports pushes as much of the report processing as possible to the server. The benefits of this functionality include:
●less time connected to the server,
●less memory needed to process the report on your computer, and
●lower transfer time from the server to the client.
What’s New |
23 |

In short, server-side processing is the newest feature in quick, expedient reporting. For more information, see Server-side processing, Page 542.
Running totals -- one field is all you need
You no longer need to bother with cumbersome running total formulas: Seagate Crystal Reports offers an easy-to-use dialog box for creating running totals quickly. The program will take care of all the formulas, all you need to do is tell it which field to total, when to total it, and when to reset. Then simply place the running total on the report and you’re set to go. For more information, see Running Totals, Page 341.
Document Import Tool converts old text reports
Have you ever wished you could use Seagate Crystal Reports formatting and grouping abilities in old text reports? Well, now you can. With the Document Import Tool, Seagate Crystal Reports offers a powerful new reporting functionality. By simply highlighting the various sections of a report and then compiling, you can easily convert a plain ASCII text report to Seagate Crystal Reports.
With this new tool, you can:
●convert old ASCII text reports into Seagate Crystal Reports,
●map the report fields to the original database, and then
●generate the report whenever you want, from within Seagate Crystal Reports.
Now you can use Seagate Crystal Reports for all your reporting needs.
For more information, see Document Import Tool, Page 433.
Entering SQL expressions directly helps you create reports faster
SQL expressions are a means of querying databases for specific data. These requests are written in Structured Query Language (SQL). Seagate Crystal Reports lets you enter SQL expressions directly from the Insert Fields dialog box. From there, the program provides an editor much like the Formula Editor, allowing you to create new SQL expressions quickly and easily. Then you can insert the SQL expressions into a report just like database fields. For more information, see How to create an SQL expression field, Page 107.
24 |
Seagate Crystal Reports User’s Guide |

Highlighting Expert makes formatting faster and easier
With the Highlighting Expert, Seagate Crystal Reports offers powerful highlighting functionality that allows you to quickly apply conditional formatting to currency and number fields. From just one dialog box, you can apply:
●font color,
●background color, and
●border style.
You can also specify multiple sets of formatting specifications, each one dependent on a separate condition. For more information, see How to Use the Highlighting Expert, Page 224.
Field Mapping provides more database control
Seagate Crystal Reports provides a dialog box for mapping altered database fields. If the database is edited or changed, and causes errors in a report, you no longer need to delete and replace the affected fields. Now, you can remap them. This lets you get your reports up and running again in a very short amount of time.
The program will automatically generate the Map Fields dialog box when you need it. For more information about mapping altered database fields, see Working With Databases, Page 507.
Enhanced Formula Editor makes creating formulas easy
The Formula Editor has been updated to include advanced features, including bookmarks (which allow you to navigate through long formulas), search and replace (also useful for long formulas), and the ability to edit more than one formula before closing the editor. Plus, you can rearrange the elements of the Formula Editor so that you can work more efficiently. In short, the Formula Editor has an entirely new look, allowing for faster manipulation of your formulas. For more information, see How formulas are created: an introduction to the Formula Editor, Page 296.
What’s New |
25 |

Enhanced exporting capabilities
This version of Seagate Crystal Reports allows you to export reports to applications, such as MS Word and MS Excel. When a report is exported to an application, Seagate Crystal Reports saves the report as a temp file and will automatically open it in the appropriate application. This new feature extends the range of reporting capabilities. For more information, see How to export reports, Page 133.
New and better parameter fields provide greater flexibility
Seagate Crystal Reports includes new functionality that lets you create even more powerful parameter fields than before. With multiple default prompting values, you can allow for a wide range of options when entering parameter values. With range limiting, you can specify a minimum/maximum range for parameter values. With edit masks, you can limit the values entered to certain characters. For more information, see Parameter Fields, Page 351.
On-Demand subreports increase report organization
Seagate Crystal Reports now allows you to create on-demand subreports, where the subreport data remains hidden until the user requests it. The subreport is represented on the report by an object frame, but the actual data remains hidden until the user drills-down on the frame. This way, the user will not be burdened with extraneous data. The user can choose when and if they want to drill-down and view the subreport. This feature can be especially useful if you want to include several subreports in the same primary report, but you don’t want all the data displayed at once. In this case, you can specify that the subreports are on-demand so that only an object frame will appear for each subreport. This makes the subreports much more manageable. For more information about ondemand subreports, see Subreports, Page 415.
26 |
Seagate Crystal Reports User’s Guide |
3 |
Learning Seagate Crystal Reports |
What you will find in this chapter...
Learning Seagate Crystal Reports, Page 28
User’s Guide, Page 28
Online Help, Page 34
Books Online, Page 34
Sample Reports, Page 35
Glossary, Page 35
Sample Data - xtreme.mdb, Page 35 Suggested learning paths, Page 37
Learning Seagate Crystal Reports |
27 |

Learning Seagate Crystal Reports
Seagate Crystal Reports comes with a wide variety of tools and a comprehensive sample database to help you learn the program and use it efficiently.
The purpose of this chapter is to:
●explore the various learning sections in this manual,
●introduce the other tools that come with the program, and
●suggest learning paths based on your background.
User’s Guide
The following is a short description of each chapter in this manual for easy reference. It is recommended that you read through these brief descriptions in order to familiarize yourself with the content and design of the manual. This will make locating information later more efficient.
CHAPTER I, INSTALLATION AND QUICK START
Installation and Quick Start, Page 11, includes everything you need to get up and running with Seagate Crystal Reports. Intended for experienced users and new users who like to “learn by doing”, the Quick Start covers all the key elements of working with the program in a few short pages.
CHAPTER 2, WHAT’S NEW
Seagate Crystal Reports has been enhanced for this release. What’s New, Page 21, identifies and describes the new features, and points you to those sections of the manual where they are discussed in depth. Users who are familiar with earlier versions of Seagate Crystal Reports will benefit the most from this chapter.
CHAPTER 3, LEARNING SEAGATE CRYSTAL REPORTS
Learning Seagate Crystal Reports, Page 27, introduces you to the various tools available for learning Seagate Crystal Reports. It also suggests learning paths that you might follow based on your background.
CHAPTER 4, GETTING TO KNOW SEAGATE CRYSTAL REPORTS
Getting to Know Seagate Crystal Reports, Page 41, introduces you to Seagate Crystal Reports. In this chapter you will learn about the tools, pointers, and tabs used to design, preview, and analyze reports. This chapter
28 |
Seagate Crystal Reports User’s Guide |
explains what to do, then shows how to do it. Users at all levels will benefit from reading this chapter.
CHAPTER 5, INTRODUCTION TO REPORTING
Introduction to Reporting, Page 85, concentrates on the basic concepts of report design, and then explains, in simple terms, the concepts you should understand in order to:
●select database tables,
●select fields,
●place objects on a report,
●sort, group, and total data, and
●select records to be included in a report.
This chapter is written for users new to reporting, but also contains background information that users at all skill levels may find useful. Armed with this kind of information, you will be well-prepared to create powerful reports that run efficiently and provide exactly the information you need.
CHAPTER 6, PRINTING, VIEWING, AND EXPORTING
Printing, Viewing, and Exporting, Page 121, details the ways finished reports can be viewed, printed, and exported. It shows how to use report viewers (including the ActiveX and Java viewers that work in web browsers), introduces a number of printing considerations, and explains how to export reports in various formats to a variety of destinations, such as e- mail, Lotus Notes, and Microsoft Exchange.
CHAPTER 7, TUTORIAL - CUSTOMER LIST
Tutorial - Customer List, Page 147, is the primary tutorial for Seagate Crystal Reports. It is a product introduction that leads you step-by-step through the process of creating a report, while at the same time introducing many of the key features of the program. This tutorial has been written for the new user. No prior knowledge of reporting is necessary. By the time you finish this tutorial, you should have enough understanding of the program to feel comfortable getting started on your own report.
CHAPTER 8, REPORTING ON OLAP DATA
Reporting on OLAP data, Page 171, demonstrates how to create reports with OLAP data. Although the procedures are similar to working with PC and SQL data, there are several additional tools in Seagate Crystal Reports for working with multi-dimensional data sources.
Learning Seagate Crystal Reports |
29 |
CHAPTER 9, MULTIPLE SECTION REPORTS
Multiple Section Reports, Page 195, introduces the various types of sophisticated reporting available when using the multiple section reporting capabilities in Seagate Crystal Reports. These capabilities enable you to create reports that treat individual values differently based on sets of criteria you establish. With multiple-section reports, you can:
●format objects and sections differently based on field values,
●put conditional messages in form letters,
●add blank lines automatically when certain conditions are met, and
●perform many other reporting tasks.
CHAPTER 10, FORMATTING
Formatting, Page 209, leads you through the steps that are necessary to format a report. Formatting refers to those things that are done to change the layout and design of a report, as well as the appearance of text, objects, or entire report sections. Using the formatting tools in Seagate Crystal Reports, you can:
●call attention to certain data,
●change the presentation of dates, numbers, and other values,
●hide unwanted sections, and
●perform a variety of other formatting tasks to give a report a professional appearance.
CHAPTER 11, RECORD AND GROUP SELECTION
Record and Group Selection, Page 227, shows you how to filter which records and groups of records you want to be included in a report. Using the record and group selection tools included in Seagate Crystal Reports, you can do such things as include records for a specific group of customers only, a specific range of account numbers, or records that fall within a particular date range.
CHAPTER 12, SORTING, GROUPING, AND TOTALING
No other program has the sorting, grouping, and totaling capabilities of Seagate Crystal Reports. Sorting, Grouping, and Totaling, Page 245, describes and demonstrates the types of sorting, grouping, and totaling you can do within a report. This chapter is an excellent overview for both beginners, who may not understand sorting, grouping, and totaling, and advanced users, who may want to know more about these options.
30 |
Seagate Crystal Reports User’s Guide |
CHAPTER 13, INTRODUCTION TO FORMULAS
Seagate Crystal Reports is equipped with a powerful formula language. Once you become comfortable working with formulas, your reporting capabilities are virtually endless. Introduction to Formulas, Page 291, gets you started creating simple formulas. It familiarizes you with the tools of the Formula Editor and leads you step-by-step through the formula creation process. This chapter has been written for people who are inexperienced with formulas and demonstrates exactly how to perform each step. It is a chapter intended to get you beyond the mystery of formulas and into using them for your everyday reporting needs.
CHAPTER 14, ADVANCED FORMULAS
Advanced Formulas, Page 315, gets into the realm of “what is possible” with Seagate Crystal Reports. It shows you how to create and use variables, how to “tweak” formula evaluation times so the formula is evaluated against the “right” data, and how to perform complex conversions. Written for the advanced user, this chapter shows how to use Seagate Crystal Reports to create customized formulas for all your reporting needs.
CHAPTER 15, RUNNING TOTALS
Running Totals, Page 341, introduces the Running Total field. Seagate Crystal Reports, always a leader in sorting, grouping, and totaling, includes a special Running Total field that enables you to perform sophisticated running total activities with ease. The tutorials included in this chapter demonstrate techniques that use Running Total fields to produce reports that total running amounts in a list, groups, and other special cases.
CHAPTER 16, PARAMETER FIELDS
Parameter Fields, Page 351, shows how to use parameter fields effectively for formulas, record selection formulas, and other reporting needs. Parameter fields are fields that prompt you to specify a value each time the data is refreshed in a report. When a value is supplied, the program runs the report using that value. By using parameter fields in formulas, selection formulas, and in the report itself, you can create one report that can be modified quickly as your needs change.
CHAPTER 17, CHARTING
Seagate Crystal Reports enables you to present summarized data in colorful, easy-to-read charts and graphs. Charting, Page 369, demonstrates how to create charts and how to use them in reports to make report data more meaningful and easier to digest quickly. Users can even drill-down to see the details behind the graphical summaries.
Learning Seagate Crystal Reports |
31 |
CHAPTER 18, MAPPING
Seagate Crystal Reports allows professional geographic maps to be inserted into reports. Mapping, Page 385, demonstrates how to create maps and how to use them in reports to make it even easier to view and analyze data. Mapping makes reports more dynamic. You can even drilldown to see the details behind the various geographic areas, or launch the Analyzer Tab to customize and rearrange the appearance of a map.
CHAPTER 19, OLE
Often when a graphic, spreadsheet, or some other object is inserted into a report, it may be necessary later to change that object. Normally, to make any changes, you have to go through a number of steps, including saving files, opening additional applications, etc. All of these steps can be avoided using Object Linking and Embedding (OLE). OLE allows OLE objects to be inserted into a report from other OLE server applications, and then allows those applications to be used from within Seagate Crystal Reports to edit the objects, as needed. OLE, Page 403, shows what is possible with OLE in Seagate Crystal Reports and how to implement it.
CHAPTER 20, SUBREPORTS
A subreport is a report within a report. With subreports, unrelated reports can be combined into a single report, coordinate data that can’t be otherwise linked, and present different views of the same data in a single report. Subreports, Page 415, shows what can be done with subreports in Seagate Crystal Reports, and demonstrates how to create them.
CHAPTER 21, DOCUMENT IMPORT TOOL
The Document Import Tool is a conversion utility that allows old ASCII text reports to be converted into Seagate Crystal Reports. You can accomplish this by highlighting the various report sections (headers, footers, Details section, etc.) from within the Seagate Document Import Tool. You can then generate the report within Seagate Crystal Reports. Document Import Tool, Page 433, leads you step-by-step through the conversion process.
CHAPTER 22, CROSS-TAB OBJECTS
A cross-tab is an object that summarizes data and then presents the summaries in a compact row and column format that makes it easy to perform comparisons and identify trends. For reports that use the word “by” in the report description (sales by state, orders by customers, etc.), cross-tabs generally present data in a more compact easier-to-understand form than other reporting methods. Cross-Tab Objects, Page 443, introduces the cross-tab reporting tools, and shows how to create crosstab reports quickly and easily.
32 |
Seagate Crystal Reports User’s Guide |
CHAPTER 23, QUERIES
The Crystal SQL Designer, Page 465, shows how to create queries that can be used for ad-hoc analysis or result sets for creating reports. The Crystal SQL Designer can be used to create, modify, and optimize complex SQL queries with ease.
CHAPTER 24, DICTIONARIES
Dictionaries are structured and simplified views of data that can be created for some or all of the individuals in an organization. When working with Dictionaries, users see only the information they need and that you want them to see. They reduce support costs and time, increase user productivity, and reduce data misuse, loss, and damage. Dictionaries, Page 487, shows how to set up and use Dictionaries to improve organizational efficiency and security.
CHAPTER 25, WORKING WITH DATABASES
Understanding database concepts, relational database design, and performance considerations can help you get the most out of Seagate Crystal Reports. Working With Databases, Page 507, leads you through the basics and provides a detailed explanation of the way the program accesses linked data. The information in this chapter will help you optimize reporting for maximum efficiency. This chapter contains information for both the beginner and the advanced user.
CHAPTER 26, DATA SOURCES
Seagate Crystal Reports works with all kinds of data, from simple text files to advanced client-server SQL databases. Data Sources, Page 579, shows how the program connects to various data sources and what files have to be in place in order to make the connection. This is an in-depth chapter for advanced users who need to know how Seagate Crystal Reports operates beneath the surface.
APPENDIX A, REPORT PROCESSING MODEL
Seagate Crystal Reports uses a sophisticated multi-pass reporting model for processing reports. Understanding when different parts of the reporting process take place can help you design more efficient reports and solve reporting problems. Report Processing Model, Page 621, is written for the advanced user.
APPENDIX B, PRODUCT SUPPORT
Product Support, Page 625, introduces the various methods for obtaining product support.
Learning Seagate Crystal Reports |
33 |

APPENDIX C, SEAGATE SOFTWARE INTERNATIONAL OFFICE
DIRECTORY
Seagate Software International Office Directory, Page 633, lists the contact information for Sales, Product Support, and Product Registration at each Seagate Software office, worldwide.
Online Help
Online Help includes all of the information from the manual, as well as a description of each command, dialog box, formula function, and operator included with the program. Sample formulas, sample records, group selection formulas, and hundreds of topics on virtually anything related to reporting - online Help has it all.
In learning to use menu commands, for example, online Help gives an explanation of what the command does, a thorough explanation of any dialog boxes the menu command activates, and finally, tutorials for performing tasks using the menu command. By working through the topics for any menu command, you can find out why you would use it and become an expert in its use.
The Contents Tab can be used to navigate through online Help, the Search facility can look up topics by keywords, or the full-text Find facility can be used to pinpoint topics that contain the word of interest. It is suggested that you take advantage of the online Help often while learning Seagate Crystal Reports.
For more information on the help systems, see Using Seagate Crystal
Reports documentation, Page 5.
Books Online
Books Online are hypertext documents with hundreds of jumps that go directly to topics of interest, related topics, and technical information. Books Online contains the full text of this manual and several other documents and can be found on the Crystal Reports CD under the \Docs folder. These documents have been created with Adobe Acrobat. Acrobat Reader has a full text search capability, allowing you to find any topic of interest if you can think of just one unique word it might contain. With electronic search and jump capabilities, Books Online provides the tools needed to find information in a hurry.
Books Online can be set up in a variety of ways to suit your needs. Consult the Acrobat Reader Help System for a complete explanation of the available options.
34 |
Seagate Crystal Reports User’s Guide |
Sample Reports
Seagate Crystal Reports comes with two kinds of professionally designed sample reports:
1.General departmental reports cover a wide range of reporting needs for many of the departments in an organization.
2. Financial reports address the specific needs of financial institutions and corporate finance departments. Financial reports are available with the Professional edition only.
The sample reports are valuable learning tools.
●By studying the content of the reports, you can see the kind of information that is needed and how it is presented.
●By studying the layout and design of the reports, you can see how the information is arranged for clarity.
Glossary
This manual comes with a comprehensive glossary explaining basic database and reporting concepts, as well as, issues specific to the program. Unlike some glossaries which offer little substance, this glossary gives indepth explanations of terms used by Seagate Crystal Reports.
Reading the glossary is an excellent warm-up before you start working with the other training aids.
Sample Data - xtreme.mdb
Seagate Crystal Reports comes with xtreme.mdb, a sample database you can use when learning the program. Xtreme.mdb is a Microsoft Access database and all of the necessary drivers are included. You should be able to open the database directly and begin designing reports. Virtually all of the examples in this manual are based on xtreme.mdb data.
Xtreme.mdb is a database that contains data for Xtreme Mountain Bikes, a fictitious manufacturer of mountain bikes and accessories. The database includes the following tables:
●Xtreme Info
Company data for the Xtreme Mountain Bike company, including the company logo.
Learning Seagate Crystal Reports |
35 |
●Credit
Information from customer credit memos, such as credit authorization IDs and amounts.
●Customer
Data for the customers served by the company.
●Employee
Company-oriented data for the employees of Xtreme Mountain Bikes.
●Employee Addresses
Personal data for Xtreme Mountain Bikes employees.
●Financials
Financial data for Xtreme Mountain Bikes.
●Orders
Identifying and tracking data for orders.
●Orders Detail
Line item data for orders.
●Product
Descriptive data for Xtreme Mountain Bike products.
●Product Type
Category data for Xtreme Mountain Bike products, including product pictures.
●Purchases
Identifying and tracking data for product purchases.
●Supplier
Data for suppliers who serve Xtreme Mountain Bikes.
36 |
Seagate Crystal Reports User’s Guide |
The links (relationships) between the tables are as follows:
Xtreme.mdb also includes:
●a query (Top Customers),
●a parameter query (Credit_Limits) that you can use to learn how to report on those kinds of data sets, and
●the Xtreme Info table which is not linked to any other table. This table contains company information for Xtreme Mountain Bikes.
NOTE: The sample data has been designed to illustrate various reporting concepts in a training environment, not to teach database design. While there are alternative ways of designing a database, this design was selected to keep the tutorials and examples focused on reporting, not on data manipulation.
Suggested learning paths
There is no correct learning path for everyone; you have your own needs, and will learn in your own way, at your own speed. What follows are simply suggested learning paths for several kinds of users.
The order of the elements in each path is one that has been carefully structured to speed the learning process. To get the best results, locate the category that best describes your reporting experience and follow the path from start to finish.
Learning Seagate Crystal Reports |
37 |
New user (business)
Business user upgrading from an earlier version
New power user
The following learning path is suggested for new users who expect to use Seagate Crystal Reports on a casual basis.
●Give the Glossary, Page 647, a quick read.
●Read Getting to Know Seagate Crystal Reports, Page 41.
●Read Introduction to Reporting, Page 85.
●Read Printing, Viewing, and Exporting, Page 121.
●Work through Tutorial - Customer List, Page 147.
●Read Record and Group Selection, Page 227.
●Scan Sorting, Grouping, and Totaling, Page 245.
●Read Introduction to Formulas, Page 291.
●Review Sample Reports, Page 35.
●Refer to online Help and the Hands-On tutorials, as needed.
The following learning path is suggested for users who are upgrading from an earlier version of Seagate Crystal Reports.
●Scan the Glossary, Page 647, for new terms.
●Read Installation and Quick Start, Page 11.
●Read What’s New, Page 21.
●Read Getting to Know Seagate Crystal Reports, Page 41.
●Scan Introduction to Reporting, Page 85.
●Scan Printing, Viewing, and Exporting, Page 121.
●Scan Multiple Section Reports, Page 195.
●Scan Record and Group Selection, Page 227.
●If you have limited formula experience, read Introduction to Formulas, Page 291.
●If you have a working knowledge of formulas, read Advanced Formulas, Page 315.
●Scan Subreports, Page 415.
●Review Sample Reports, Page 35.
●Refer to Hands-On tutorials, as needed.
The following learning path is suggested for new users who expect to use many of the sophisticated features of Seagate Crystal Reports.
● Read Installation and Quick Start, Page 11.
38 |
Seagate Crystal Reports User’s Guide |
Power user upgrading from an earlier version
New MIS user
●Read What’s New, Page 21.
●Read Getting to Know Seagate Crystal Reports, Page 41.
●Scan Introduction to Reporting, Page 85.
●Scan Printing, Viewing, and Exporting, Page 121.
●Read Multiple Section Reports, Page 195.
●Scan Record and Group Selection, Page 227.
●Scan Sorting, Grouping, and Totaling, Page 245.
●Scan Introduction to Formulas, Page 291.
●Read Advanced Formulas, Page 315.
●Read Running Totals, Page 341.
●Read Parameter Fields, Page 351.
●Read Charting, Page 369.
●Read Mapping, Page 385.
●Read Subreports, Page 415.
●Read Performance considerations for all reports, Page 520.
●Read Report Processing Model, Page 621.
●Review Specialized Formulas in online Help.
●Refer to the Glossary, Page 647, and Hands-On tutorials, as needed.
The following learning path is suggested for power users who are upgrading from an earlier version of the program.
●Read What’s New, Page 21.
●Read Getting to Know Seagate Crystal Reports, Page 41.
●Read Advanced Formulas, Page 315.
●Read Charting, Page 369.
●Read Mapping, Page 385.
●Read Performance considerations for all reports, Page 520.
●Read Report Processing Model, Page 621.
●Review Power Formulas in online Help.
●Refer to the Glossary, Page 647, and Hands-On tutorials, as needed.
The following learning path is suggested for Management Information Systems (MIS) professionals who are using Seagate Crystal Reports for the first time.
Learning Seagate Crystal Reports |
39 |
MIS user upgrading from an earlier version
●Read Installation and Quick Start, Page 11.
●Read What’s New, Page 21.
●Read Getting to Know Seagate Crystal Reports, Page 41.
●Read Multiple Section Reports, Page 195.
●Read Advanced Formulas, Page 315.
●Read Running Totals, Page 341.
●Read Parameter Fields, Page 351.
●Scan Subreports, Page 415.
●Read Performance considerations for all reports, Page 520.
●Read Report Processing Model, Page 621.
●Review Power Formulas in online Help.
The following learning path is suggested for MIS users who are upgrading from an earlier version of Seagate Crystal Reports.
●Read What’s New, Page 21.
●Read Getting to Know Seagate Crystal Reports, Page 41.
●Read Multiple Section Reports, Page 195.
●Scan Sorting, Grouping, and Totaling, Page 245.
●Read Advanced Formulas, Page 315.
●Read Running Totals, Page 341.
●Read Parameter Fields, Page 351.
●Read Subreports, Page 415.
●Read Dictionaries, Page 487.
●Read Performance considerations for all reports, Page 520.
●Read Data Sources, Page 579.
●Read Report Processing Model, Page 621.
40 |
Seagate Crystal Reports User’s Guide |

4 |
Getting to Know Seagate Crystal |
|
Reports |
What you will find in this chapter...
The application window, Page 42
Menu bar, Page 42
Standard toolbar, Page 45
Formatting toolbar, Page 47
Supplementary toolbar, Page 49
Analyzer toolbar, Page 50
Status bar, Page 51
Shortcut menus, Page 53
Cursors, Page 54
Design Tab, Page 57
Preview Tab, Page 61
Analyzer Tab, Page 65
Other fundamentals, Page 66
HANDS-ON (Report Design Environment), Page 70
HANDS-ON (Sections and Areas), Page 79
Getting to Know Seagate Crystal Reports |
41 |
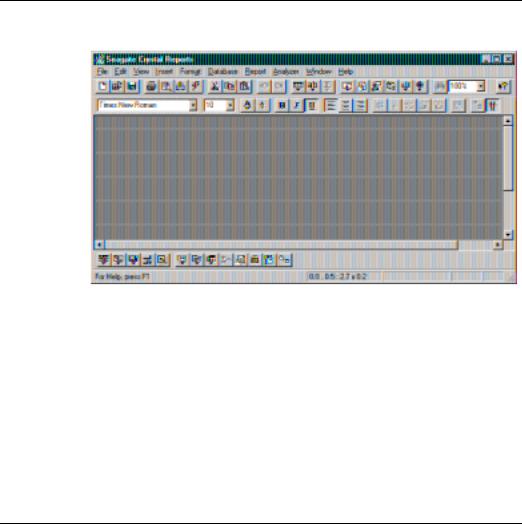
The application window
The application window is clear and easy to understand.
●The Title bar identifies the current report and contains the standard Windows buttons.
●The Menu bar appears just below the title bar.
●The Standard toolbar appears just below the menu bar.
●The Formatting toolbar appears just below the standard toolbar.
●If toggled on, the Analyzer toolbar appears just below the formatting toolbar.
●If toggled on, the Supplementary toolbar appears just above the status bar.
●The Status bar appears at the bottom of the window.
Menu bar
The Menu bar is the command center of Seagate Crystal Reports. Each option on the menu bar activates a drop-down list of commands used to create, modify, print, and save reports.
42 |
Seagate Crystal Reports User’s Guide |
File Menu
Edit Menu
View Menu
The Menu bar contains the following menus:
●File,
●Edit,
●View,
●Insert,
●Format,
●Database,
●Report,
●Analyzer,
●Window, and
●Help Menu.
The File Menu includes commands used to open, close, and save files, save files under a different file name, create new reports, mailing labels, and cross-tabs, as well as several other kinds of reports. It also includes a command to exit the program. Additionally, it contains commands that enable you to change page margins, preview a report before printing, send a report to a printer, select a printer if you want the report to print on something other than the default printer, and export a report to a disk file in a variety of formats. You can also add summary information to help you identify a report, as well as, change the default settings so that the program works the way that is the most efficient for you. Search for File Menu Commands in online Help.
The Edit Menu includes commands used to modify aspects of a report. It includes commands to undo and redo actions, edit fields, formulas, summaries, subreport links, OLAP members, OLE objects and OLE links, to view a sample of the data in a selected field, and to cut, copy, and paste report and OLE objects. You can also use the Edit Menu commands to show, hide, move, merge, or delete report sections, delete groups, and convert static OLE objects into editable bitmaps. Search for Edit menu commands in online Help.
The View Menu includes commands used to modify the user interface of the program. View Menu commands enable you to show or hide the toolbars, zoom in and out on a report to view it at different magnifications, and to turn guidelines, the grid, and the rulers on and off. The Group Tree view can be toggled on and off from the View Menu. Search for View Menu commands in online Help.
Getting to Know Seagate Crystal Reports |
43 |
Insert Menu
Format Menu
Database Menu
Report Menu
Analyzer Menu
The Insert Menu includes commands used to insert database fields, text objects, formula fields, parameter fields, cross-tab objects, subtotals, grand totals, summaries (counts, averages, etc.), groups, and sections. This menu also includes commands that enable you to insert group name fields, subreports, graphics, lines, boxes, charts, and OLE objects into a report. Search for Insert Menu commands in online Help.
The Format Menu includes commands used to change the look of the elements in a report. It includes commands for changing fonts and for adding field borders, background color, and drop shadows. The Format Menu has commands for formatting fields that are embedded in text objects, for formatting individual paragraphs in those text objects, and for entire sections of the report as well. There are also commands for formatting charts, as well as, formatting and pivoting cross-tabs. Finally, Format Menu commands can be used to have the program automatically arrange report objects, apply professionally-designed styles to the entire report, and move individual objects within a stack of objects forward and backward. Search for Format Menu commands in online Help.
The Database Menu includes commands used to add and delete tables for use with reports, to change the alias used to identify a table, and to link and unlink tables. It has commands for logging on and off SQL and ODBC servers, for showing Essbase report scripts, showing and editing SQL queries, and modifying parameters for stored procedures. The Database Menu also has commands that direct the program to look for tables in new locations, change database drivers used in a report, remove tables from a report, and adapt reports appropriately if there are minor changes in table structure. Search for Database Menu commands in online Help.
The Report Menu includes commands used to select the records or groups to be included in a report, select the order in which report data is to be sorted (by record or by group), specify subreport links, and specify a print date for a report. It has commands for updating the data used in a report and for gathering all the files needed for distributing reports. You can also use one of the Report Menu commands to create an executable version of the report, which you can share with others who do not have Seagate Crystal Reports. Search for Report Menu commands in online Help.
The Analyzer Menu includes commands used to launch the Analyzer Tab and customize your charts and maps. The menu includes commands for changing the group order, series order, and viewing angles for charts, for zooming, centering, and panning maps, for changing map and chart titles, for drilling-down on maps, and for changing the map style and the organization of the map layers. There is also a command for formatting
44 |
Seagate Crystal Reports User’s Guide |

Window Menu
Help Menu
the field you are currently charting or mapping, and a command for restoring all the original settings for the modified chart or map. Search for
Analyzer Menu commands in online Help.
The Window Menu includes commands used to rearrange icons and windows. It also lists the report windows that are open and includes a command that closes all report windows at once, if desired. Search for
Window Menu commands in online Help.
The Help Menu includes commands used to access Seagate Crystal Reports online Help index and the search facility that provides context sensitive Help. It has commands for registering the program, accessing technical information about your computer system, and creating a technical support request. You can toggle the Welcome dialog box on and off, and if connected to the Internet, you can access several key pages of the Seagate web site using commands on the Help Menu. One other command provides information about the version of the program in use. Search for Help Menu commands in online Help.
Standard toolbar
Seagate Crystal Reports groups several commonly used commands on the Standard toolbar, which remains on-screen at all times (unless you decide to toggle it off in the Toolbars dialog box).
The Standard toolbar eliminates some of the steps needed to activate the commands and can thus greatly speed your work in creating reports. Each command available via the Standard toolbar is discussed in online Help (search for each command by name).
NOTE: In the 32-bit version of Seagate Crystal Reports, you can move the Standard toolbar to another fixed location within the window or set it up as a floating palette. See How to move and resize toolbars, Page 70.
If you are not sure about the function of a button on the Standard toolbar, place the pointer over the button and hold it there. A Tool Tip appears, providing a description of the button.
The buttons on the Standard toolbar perform the following functions:
Getting to Know Seagate Crystal Reports |
45 |

Creates a new report.
Opens an existing report.
Saves the report.
Sends the report to a printer.
Previews the report in the Preview Tab.
Exports the report to a file or e-mail.
Refreshes report data.
Cuts selected object/data to the Clipboard.
Copies the selected object/data to the Clipboard.
Pastes object/data from Clipboard to the report.
Undoes an action.
Repeats an action.
Inserts database, formula, parameter, running total and other group name fields.
Inserts a text object.
Inserts a summary.
46 |
Seagate Crystal Reports User’s Guide |
Activates the Report Expert.
Formats any section of the report.
Sets record/group selection criteria.
Sets record sort order.
Inserts a chart.
Inserts a Map.
Searches for a specific record.
Sets the magnification factor for viewing your report.
Activates context-sensitive Help.
Formatting toolbar
The Formatting toolbar enables you to access many popular formatting options with the click of a button or a selection from a drop-down list. You simply select the data you want to format, then click the appropriate button or list option to format the data.
Two edit boxes with drop-down lists appear at the left side of the
Formatting toolbar.
Use these drop-down lists to select new fonts and font sizes to use something other than the default font and font size.
The buttons on the Formatting toolbar perform the following functions:
Getting to Know Seagate Crystal Reports |
47 |

Increases the font size of the selected data one point each time the button is clicked.
Decreases the font size of the selected data one point each time the button is clicked.
Changes the selected data to boldface.
Italicizes the selected data.
Underlines the selected data.
Aligns the selected data flush left.
Centers the selected data.
Aligns the selected data flush right.
When a number field is selected, places a currency symbol with the number.1
When a number field is selected, places a thousands separator in the number.1
When a number field is selected, places a percentage sign with the number.1
When a number field is selected, adds one decimal place to the number.1
When a number field is selected, subtracts one decimal place from the number.1
Activates the Highlighting Expert. See Highlighting Expert in the online Help.
Toggles the Group Tree’s Smart Navigation on/off in the Preview Tab. See Group Tree view, Page 63.
48 |
Seagate Crystal Reports User’s Guide |
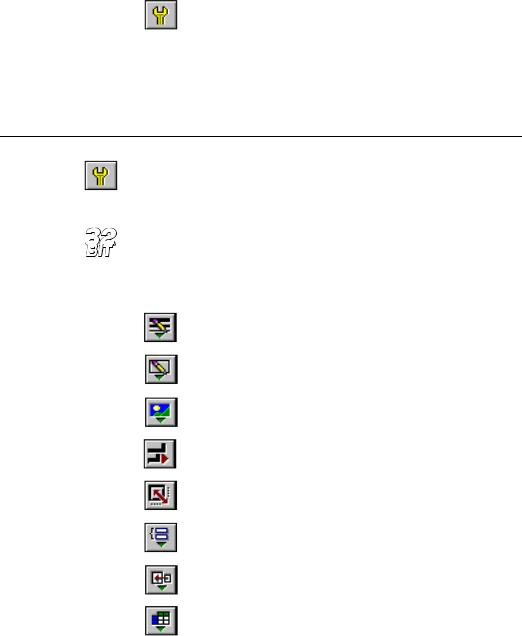
Toggles the Supplementary toolbar on/off. See
Supplementary toolbar, Page 49.
7KH SURJUDP UHIHUV WR WKH VHWWLQJV LQ WKH ,QWHUQDWLRQDO VHFWLRQ RI WKH &RQWURO 3DQHO :LQGRZV [ DQG :LQGRZV 17 RU LQ WKH 5HJLRQDO 6HWWLQJV VHFWLRQ RI WKH &RQWURO 3DQHO :LQGRZV :LQGRZV DQG :LQ 17
Supplementary toolbar
The Supplementary toolbar provides quick access to many advanced, report-enhancing experts and features. Activate the Supplementary toolbar by clicking the SUPPLEMENTARY TOOLBAR button, found on the far-right end of the Formatting toolbar.
NOTE: The Supplementary toolbar only appears in the 32-bit version of
Seagate Crystal Reports.
The buttons on the Supplementary toolbar perform the following functions:
Inserts a line.
Inserts a box.
Inserts a picture.
Arranges report elements automatically to best fit the page.
Activates Style Expert to apply a professionally-designed style to a report.
Inserts a group.
Inserts a subreport.
Inserts a cross-tab object.
Getting to Know Seagate Crystal Reports |
49 |
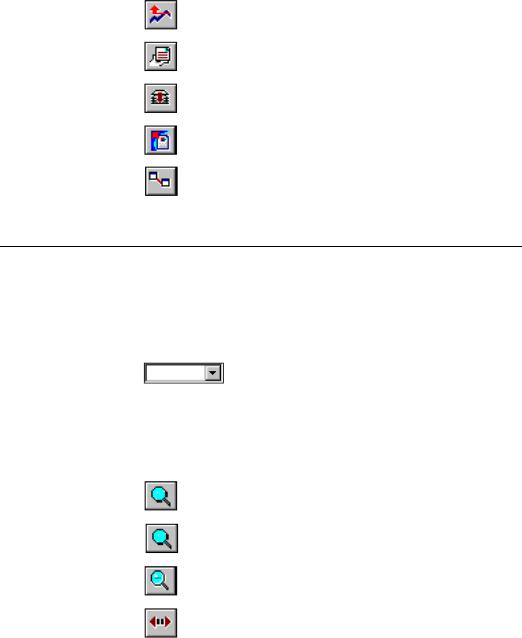
Finds Top/Bottom N records or sorts on summary information.
Activates the Format Editor to modify object properties.
Compiles the report.
Activates the Report Distribution Expert.
Defines links between tables.
Analyzer toolbar
The Analyzer toolbar allows you to quickly view and customize maps and charts on the Analyzer Tab. To activate this toolbar, choose the TOOLBARS command from the View menu and then toggle the Analyzer check box on in the Toolbars dialog box.
One drop-down list appears at the left-hand side of the Analyzer toolbar.
Use this drop-down list to change the color of a single data item on a chart (for example, to change the color of one of the bars on a bar chart).
The buttons on the Analyzer toolbar perform the following functions for maps:
Activates the drill-down mode, and changes the cursor to a
Drill-down cursor.
Activates the Zoom In mode, and changes the cursor to a
Zoom cursor.
Activates the Zoom Out mode, and changes the cursor to a
Zoom cursor.
Activates the Pan mode, and changes the cursor to a
Panning cursor.
50 |
Seagate Crystal Reports User’s Guide |
Centers the map on the Analyzer Tab.
Opens the Customize Map dialog box, for changing the style and appearance of the map on the Analyzer Tab.
Opens the Layer Control dialog box, for re-arranging the layers of the map on the Analyzer Tab.
Status bar
The status bar at the bottom of the application window displays valuable information to help users work with the program more efficiently.
TOOLBAR FUNCTIONS
When the cursor is over a toolbar button, the status bar displays a short description of the button’s function.
MENU COMMAND DESCRIPTIONS
When a menu command is highlighted, the status bar displays a short description of the command.
CURRENT SELECTIONS
When you highlight or place an object, the status bar displays the name of the object (or its object type) plus its location and sizing information.
To identify objects, the status bar displays:
●the words OLE Object for a picture or other OLE object,
●the alias and field name for a field,
●the words Line for a line, Box for a box, and Text for a text object,
●the field type for special fields (Print Date, Record Number, and so forth),
●the summary name for a summary or subtotal,
●the formula name for a formula,
●the parameter field name for a parameter field, and
●the running total field name for a running total field.
Getting to Know Seagate Crystal Reports |
51 |
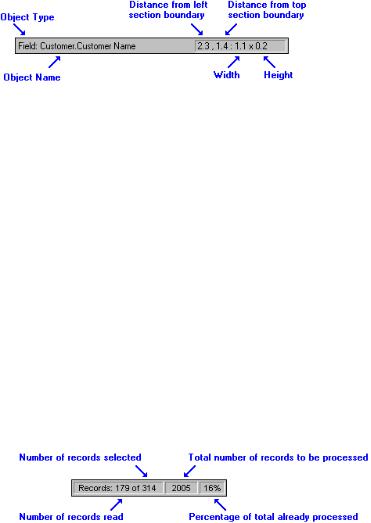
The status bar also displays:
●how far the object is from the left and top boundaries of a section, and
●how big the object is.
With this information, you can easily move and resize objects with precision.
DATA RETRIEVAL INFORMATION
When you preview a report for the first time or refresh the data in the Preview Tab, the status bar displays four figures that describe the data retrieval processing.
1.The first number displays the number of records selected out of the number of records read.
2.The second number displays the number of records read. If a report:
●has a selection formula, the records selected figure will typically be smaller than the records read figure.
●does not have a selection formula, records selected will always be equal to records read.
3.The third number displays the total number of records that will be processed. If the report is based on:
●a single table, the figure that is displayed should remain constant.
●linked tables, and if any one-to-many situations exist, the figure will typically increase as the program identifies all the linked records.
4.The final number is the percentage of the total records that have been processed.
52 |
Seagate Crystal Reports User’s Guide |

Once the report has finished processing, the program displays only the number of records selected and the percentage processed.
Shortcut menus
When you are working in either the Design or Preview Tab, you can speed up your work considerably by using shortcut menus. When you right-click a report element (a picture, section, field, etc.), the program displays a shortcut menu next to the element. Unlike the program’s standard menus that group commands by function (editing, inserting, etc.), shortcut menus are element-specific; they contain only those commands that are available for use with the selected element.
Shortcut menus are useful because they:
●display the name and source (alias) of the element at the top of the menu so you can identify the elements on your report with a single click,
●make it easier to learn the program because they eliminate the need to remember where to find a command,
●make working with the program more efficient because you are dealing with only a compact list of commands, which makes it easier to pick the right one, and
●spotlight the things you can do with an element making the program more intuitive to use.
Getting to Know Seagate Crystal Reports |
53 |
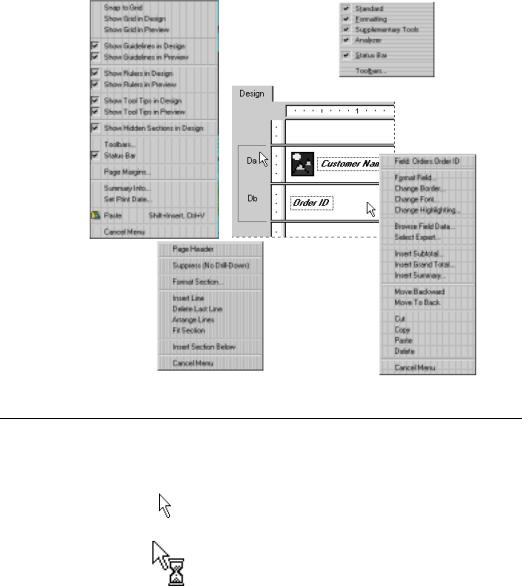
Right-click the Design Tab itself and a menu like this appears.
Right-click the gray area of the Details section and a menu like this appears.
Right-click the gray area of a toolbar and a menu like this appears.
Right-click a field and a menu like this appears.
Cursors
Seagate Crystal Reports uses a number of different cursors at different points in its operation:
The Arrow cursor is the primary cursor, used for making menu choices, selecting options from dialog boxes, working with scroll bars, clicking buttons and objects, and so on.
The Hourglass or Background Processing cursor appears whenever the program is processing a command. Whenever the hourglass is visible, you can not choose any commands or proceed further with the report.
54 |
Seagate Crystal Reports User’s Guide |

The double-arrow Resizing cursor changes to one of a number of different double-arrow cursors whenever it is placed over a resizing handle on a bit-mapped graphic, graphic box, graphic line, or field.
The Move cursor appears whenever a single object is being dragged to another location in a report.
The single-unit Drag and Drop cursor appears whenever a single item is dragged over an area where it can be dropped.
The multi-unit Drag and Drop cursor appears whenever multiple items are dragged over an area where they can be dropped. It is also used to copy multiple items at one time.
The Stop cursor appears whenever a dragged item is over an area where it can not be dropped.
The Copy cursor appears whenever a single item is being copied.
The Section Sizing cursor changes from the Arrow cursor whenever it is positioned over the boundary of any report section. This cursor is used to drag a section boundary line in order to expand or reduce the size of a section.
The Section Splitting cursor appears when the pointer is positioned over the left boundary of a report section. Click, and a horizontal line appears, to position where the section should be split.
The Link cursor appears when links are manually created in the Visual Linking Expert. Search for Visual Linking Topics Index in Seagate Crystal Reports online Help.
The Drill-down cursor appears when the pointer is positioned over a summary value or a chart in the Preview Tab. Double-click a summary value or chart element with the Drill-down cursor, and the program displays the details behind the summary.
The Pencil cursor is a drawing cursor. It appears whenever boxes and lines are inserted. The point of the pencil marks the spot where the drawing begins and is used to define the size and shape of the object drawn.
Getting to Know Seagate Crystal Reports |
55 |

The Help cursor appears when the HELP button on the Standard toolbar is clicked. Use the Help cursor to access the online Help system. Simply click the report element or dialog box to bring up context-sensitive Help for that item.
The Tiny Hand cursor is available in the online Help system. The Arrow cursor changes to the Tiny Hand cursor whenever it is positioned over text or a graphic that jumps to another topic in online Help.
The 2-Dimensional Panning or Anchor cursor appears as an IntelliMouse feature for scrolling through your report in any direction in the Preview Tab.
The Scroll cursor appears as an Intellimouse feature for scrolling a report up/down in the Preview Tab.
The Pan cursor appears as an Intellimouse feature for panning a report right/left in the Preview Tab.
The North panning cursor appears as an Intellimouse feature for panning North (up) in a document.
The South panning cursor appears as an Intellimouse feature for panning South (down) in a document.
The East panning cursor appears as an Intellimouse feature for panning East (to the right) in a document.
The West panning cursor appears as an Intellimouse feature for panning West (to the left) in a document.
The Northeast panning cursor appears as an Intellimouse feature for panning Northeast (up and to the right) in a document.
The Northwest panning cursor appears as an Intellimouse feature for panning Northwest (up and to the left) in a document.
The Southeast panning cursor appears as an Intellimouse feature for panning Southeast (down and to the right) in a document.
The Southwest panning cursor appears as an Intellimouse feature for panning Southwest (down and to the left) in a document.
56 |
Seagate Crystal Reports User’s Guide |
Design Tab
Design Tab
Areas
When working with Seagate Crystal Reports, you will probably use the Design Tab more than any other part of the program.
The Design Tab is the place you do most of the initial work when creating a report. It designates and labels the various sections of the report. You can place objects in these sections where you want them to appear, specify sorting, grouping, and totaling needs, do the initial formatting, and so forth. See Area printing characteristics, Page 59.
The Design Tab provides a very efficient environment for designing a report because you work in the tab with data representations, not with data itself. When a field is placed on the report, the program uses a frame to identify the field on the tab; it does not retrieve the data. Thus, you can add and delete fields and other objects, move them around, set up complex formulas, and more, without tying up the computer or network resources needed to gather the data.
The report created in the Design Tab is a kind of virtual report; it has the structure and instructions for creating the final report, but it is not the report itself. To turn the Design Tab report into a final report or into a report that you can fine-tune, you “just add data.” You do this whenever you preview the report, print it, or output it in any other way. The actual data will now appear in the report.
When you first begin creating a report, Seagate Crystal Reports automatically creates five areas in the Design Tab.
1.Report Header
This section is generally used for the report title and other information you want to appear at the beginning of the report. It can also be used for charts and cross-tabs that include data for the entire report.
Getting to Know Seagate Crystal Reports |
57 |
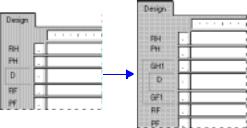
2.Page Header
This section is generally used for information that you want to appear at the top of each page. This can include such things as chapter names, the name of the document, and other similar information. This section can also be used to display field titles above the fields on a report.
3.Details
This section is used for the body of the report, and is printed once per record. The bulk of the report data generally appears in this section.
4.Report Footer
This section is used for information you want to appear only once at the end of the report (such as grand totals) and for charts and crosstabs that include data for the entire report.
5.Page Footer
This section usually contains the page number and any other information you want to appear on the bottom of each page.
If a group, summary, or subtotal is added to the report, the program creates two additional sections:
1.Group Header
This section typically holds the group name field, and can be used to display charts or cross-tabs that include data specific to the group. It is printed once at the beginning of a group.
2.Group Footer
This section generally holds the summary value, if any, and can be used to display charts or cross-tabs. It is printed once at the end of a group.
When a group, summary, or subtotal is added, the Group Header area appears directly above the Details area and the Group Footer area appears directly below the Details area.
If you set up additional groups, the program creates new group areas between the Details area and the existing Group Header and Group Footer area(s).
58 |
Seagate Crystal Reports User’s Guide |
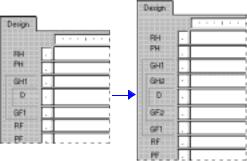
Area printing characteristics
Like the original areas, each of these newly added areas can contain one or more sections. By default, they each contain a single section.
Each report area has its own printing characteristics. It is important to understand these characteristics because they affect when and how often different report objects get printed.
WHEN AREAS PRINT
Areas print in the order they appear on the Design Tab (top to bottom). If there is more than one section in an area, the sections print in the order they appear within the area. Thus, if you have three Report Header sections, all three of those sections will print, in order, before the section(s) in the Page Header area begin to print.
HOW OFTEN OBJECTS PRINT
The decision on where to place objects on the Design Tab is made easier if you understand how often each of the areas prints. Once you understand this, most of your reporting decisions are straightforward. This information becomes most useful, however, when you are trying to decide where to place charts, cross-tabs, and formulas to get specific results.
Objects print in the following ways:
●Objects placed in the Report Header area print once, at the beginning of the report.
¾Charts and cross-tabs placed in this area contain data for the entire report.
¾Formulas placed in this area are evaluated once, at the beginning of the report.
Getting to Know Seagate Crystal Reports |
59 |
Identifying and working with areas and sections
●Objects placed in the Page Header area print at the beginning of each new page.
¾Charts or cross-tabs can not be placed in this section.
¾Formulas placed in this area are evaluated once per page, at the beginning of each new page.
●Objects placed in the Group Header area print at the beginning of each new group.
¾Charts and cross-tabs placed in this area contain data just for the group.
¾Formulas placed in this area are evaluated once for each group, at the beginning of the group.
●Objects placed in the Details area print with each new record.
¾Charts or cross-tabs can not be placed in this area.
¾Formulas placed in this area are evaluated once for each record.
●Objects placed in the Group Footer area print at the end of each group.
¾Charts and cross-tabs placed in this area contain data just for the group.
¾Formulas placed in this area are evaluated once for each group, at the end of the group.
●Objects placed in the Report Footer area print once at the end of the report.
¾Charts and cross-tabs placed in this area contain data for the entire report.
¾Formulas placed in this area are evaluated once, at the end of the report.
●Objects placed in the Page Footer area print at the bottom of each page.
¾Cross-tabs and charts can not be placed in this area.
¾Formulas placed in this area are evaluated once per page, at the beginning of each new page.
By default, each area contains only a single section. The name for that section appears directly to the left of the section. If you have multiple sections in an area, the sections are designated as a, b, c, and so forth.
60 |
Seagate Crystal Reports User’s Guide |
NOTE: Initials, such as RH, PH, D, PF, RF, and so on, are used to identify each section if you have toggled the Show Short Section Names in Design check box on in the Options dialog box. Search for Options dialog box in
Seagate Crystal Reports online Help.
NOTE: If you right-click the shaded area containing a section name, a shortcut menu appears with section-specific options. If you right-click the shaded area to the left of the section names, a shortcut menu appears with area-specific options.
The program displays a section ruler immediately to the left of each section. The section ruler is used to add, remove, and move guidelines, and to provide a visual reference when you are placing objects. See How to add, delete, and move guidelines, Page 72.
Section ruler.
Other Design Tab capabilities
Preview Tab
Whenever a new section is added, the program creates a ruler for that section. See How to add, delete, move, and merge sections, Page 79.
There are several other capabilities built into the Design Tab. With the Design Tab, you can:
●resize a section by dragging its boundary. See How to split and resize sections, Page 82.
●split a section (create two sections from one) by clicking its left boundary. See How to split and resize sections, Page 82.
●add horizontal and vertical guidelines by clicking the rulers. See
How to add, delete, and move guidelines, Page 72.
●zoom in and out on a report at any magnification from 25% to 400% of the original size. See How to zoom the report in and out, Page 76.
To preview a report before printing it, click the PRINT PREVIEW button on the Standard toolbar.
Getting to Know Seagate Crystal Reports |
61 |
The program gathers the data, makes the necessary calculations, and displays the report in the Preview Tab on electronic “paper.” With the data in place, you can review the spacing and formatting of your report and see the actual results of all your summaries, formula calculations, and record and group selections.
In true WYSIWYG (What You See Is What You Get) fashion, you can work directly on this live data, fine-tuning it until the report has the exact look you want.
The program works with data in the following manner:
●The first time the Preview Tab is used, it retrieves data from your underlying data source(s) and saves it with the report (unless you have set up the program not to save data).
●From that point on, the program uses the saved data whenever you preview the report unless you specifically refresh it or add a field that requires the program to retrieve new data.
Seagate Crystal Reports provides two views for previewing a report:
1.Standard view, and
2.Group Tree view.
Standard view
In standard view, the report is displayed a page at a time. Using the navigation buttons in the Preview Tab, you can move to the beginning or end of the report, or you can move backward and forward through the report one page at a time. For shorter reports or reports in which you're primarily interested in seeing the “bottom line” totals, standard view provides all of the functionality that you need.
62 |
Seagate Crystal Reports User’s Guide |
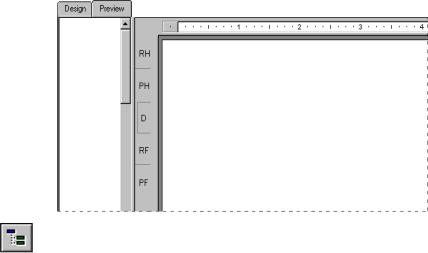
Group Tree view
Similarities/ differences from Design Tab
THE DATA AGE INDICATOR
The Data Age indicator indicates the date the data was last refreshed or initially retrieved, whichever is the most recent. If the data was initially retrieved or refreshed today, it indicates the time it happened. Search for Save Data with Report command in Seagate Crystal Reports online Help.
The Group Tree view can be toggled on/off using the TOGGLE GROUP TREE button on the Formatting toolbar.
The Group Tree view presents a split screen.
●The right pane displays the report.
●The left pane displays a high level outline of the report, showing the hierarchy of groups and subgroups in a familiar tree format.
When you click the tree node for the group that interests you, the program jumps immediately to the part of the report that contains the information for that group. For longer reports or reports in which you wish to jump back and forth between different groups, the Smart Navigation features of the Group Tree view make your work extremely efficient.
You have the same formatting capabilities in the Preview Tab as you do in the Design Tab. Menus (both menu bar and shortcut menus), the standard and supplementary toolbars, rulers, and the Formatting toolbar remain active, giving you essentially the same functionality you have when working with a report in the Design Tab. However, when you are making numerous changes, it is quicker to make the changes in the Design Tab.
Getting to Know Seagate Crystal Reports |
63 |
●The Design Tab and Preview Tab are tied together internally. Any changes made in one are reflected in the other.
●The Preview Tab has a single vertical ruler at the left of the tab rather than the individual section rulers seen in the Design Tab. The functionality of the ruler is the same.
●The Preview Tab identifies report sections in the shaded area to the left of the data. With a quick look you can tell which report section the data is printing from. While section names appear only once in the Design Tab, they print each time a section prints in the Preview Tab.
●The Record counter (see DATA RETRIEVAL INFORMATION, Page 52, the Data Age indicator (see THE DATA AGE INDICATOR, Page 63, and the Page Forward/Page Back controls (see Preview Tab, Page 61), are all active in the Preview Tab.
●The Preview Tab highlights every value when you select a field; whereas, only the field frame is highlighted in the Design Tab.
A DIFFERENT FEEL
Working in the Preview Tab has a different feel from working in the Design Tab.
Each field in a database contains dozens, hundreds, or even thousands of values, depending on the number of records in the database. When you place a field in the Design Tab, a single field frame represents all those values. When you highlight the field, sizing handles appear on the frame and the frame changes color.
In the Preview Tab, however, you are working with the actual data. Instead of a field frame representing many field values, the values themselves appear.
●When you highlight a field or formula field value, you are actually selecting every value in the field.
¾The program places a sizing frame around the specific value you select.
¾It highlights every other value in the field.
●Likewise, when you select a summary value, you are actually selecting all the related summary values.
¾The program places a sizing frame around the specific value you select.
¾It highlights all the related summary values.
64 |
Seagate Crystal Reports User’s Guide |

Aside from the differences in appearance, the process of building and modifying a report is the same in both the Design Tab and the Preview Tab. You should find it easy to work with your reports in both places.
Analyzer Tab
Working with charts
The program provides a separate Analyzer Tab that allows you to examine your charts and maps independently of the main report. You can use this tab to rearrange chart and map elements, and to customize the appearance of the chart or map for more efficient analysis and trend identification.
To analyze a chart object or a map object in-depth, right-click the object in question and choose LAUNCH ANALYZER from the shortcut menu.
When viewing a chart on the Analyzer Tab, you can perform the following operations by using the commands on the shortcut menu:
●change the title of the chart,
●change the X-Axis title, Y-Axis title, and Z-Axis title,
●reverse the order in which the series appear on the chart,
Working with maps
●reverse the order in which the groups appear on the chart, as well as
●any additional operations specific to the specific chart type.
When viewing a map on the Analyzer Tab, the shortcut menu can be used to perform the following operations:
●center the map,
●zoom in, zoom out, and pan the map,
●change the map type and set options for the overall style of the map,
●reorganize the layers of report elements (for example, you can display the major cities layer above the highways layer), and
●change the map title.
NOTE: The Analyzer Tab’s centering, zooming, and panning capabilities are also available as commands on the shortcut menu of the Preview Tab (if you right-click the map object in the Preview Tab).
Getting to Know Seagate Crystal Reports |
65 |

Similarities/ differences from Preview Tab
The Analyzer Tab is similar to the Preview Tab in some ways, but it is much more focused. When you view a chart or map in the Analyzer Tab, you are looking at the actual chart or map and its features without viewing any of the underlying data. The purpose of the tab is simply to arrange and rearrange the appearance of the chart or map in such a way that you will be able to identify trends quickly and easily.
A DIFFERENT FEEL
While the Analyzer Tab and Preview Tab share some capabilities, the Analyzer Tab offers a much more focused and hands-on approach. It removes irrelevant data from the picture, showing you only the maps and charts you are analyzing. It provides commands for reversing series and groups on charts, and for zooming, panning, and centering maps, so that they can easily be adjusted.
With the Analyzer Tab, up to two objects can be viewed simultaneously. In this case, the Analyzer Tab becomes a split-screen tab, with each chart or map appearing in a separate section. To resize a section, move the cursor over the section boundary until the cursor becomes a Section Sizing cursor, and then drag the boundary line to expand or reduce the size of the section, as needed.
When two charts or maps are active in the Analyzer Tab, and you want to work with a third, right-click that third chart or map, and choose ANALYZER from the shortcut menu. A dialog box appears, reminding you that the Analyzer Tab is full, and asking whether you would like to replace one of the sections currently active in the Tab.
The Analyzer Tab can also be used to work with map and chart objects that have been placed within a subreport. The program opens a separate Analyzer Tab for each subreport that contains a map or chart object you are analyzing. You can view up to two objects from the same subreport simultaneously in an Analyzer Tab.
NOTE: You can also resize the map key displayed to the right of each map.
Other fundamentals
Seagate Crystal Reports’ reporting environment is extremely flexible.
●You can turn on grid snap, set the grid to a maximum of one inch, and make the grid visible or invisible in the Design Tab, the Preview Tab, or both (see How to turn the grid on/off, Page 76).
66 |
Seagate Crystal Reports User’s Guide |
Grid
Free form
Free form with guidelines
●You can also work without a grid, placing objects wherever you want them in a report (see Free form, Page 67 and Free form with guidelines, Page 67).
●Finally, the guidelines can be used to align and resize objects (see
How to move and position objects using guidelines, Page 73).
Set up the working environment so it works the way you work best.
The grid is a series of row and column coordinates. When the grid is active, the program enables you to place objects only at these coordinates, not between them. In this way it makes it very easy for you to place and space data on your report and to align objects as needed. If you attempt to place an object between grid coordinates, the program “snaps” the object to the grid, that is, it moves the object automatically to the nearest set of row/column coordinates.
You activate the grid and specify its size and visibility properties using the Layout Tab in the Options dialog box. By default, the grid is not active. See How to turn the grid on/off, Page 76.
You may also want to use Seagate Crystal Reports without a grid, in a free form environment similar to that of a drawing program. Free form means simply that you can place objects anywhere you want them to appear on your report. Your only restriction is that the program will not allow you to place chart and cross-tab objects in the Page Header, Page Footer, or Details sections. See Area printing characteristics, Page 59.
To work in a free form environment, toggle the Snap To Grid check box off using the Layout Tab of the Options dialog box. For more information, search for Options dialog box in Seagate Crystal Reports online Help.
You may want to work in a free form environment while retaining the ability to align objects, or to move or resize them as a group. You can do this using guidelines.
Guidelines are lines that extend vertically or horizontally from the Design and Preview Tab rulers. Guidelines have a snap property; when you move an object within a guideline’s magnetic range, the object snaps, or attaches itself, to the guideline.
●Once an object is snapped to a guideline, if the guideline is moved, the object moves too.
●If you have several objects snapped to a guideline, they all move when the guideline is moved.
●If you have several objects snapped to a guideline on two sides (right and left, or top and bottom) and one of the guidelines is moved, all of the objects resize similarly.
Getting to Know Seagate Crystal Reports |
67 |
Overflow Field
Representations
Sections and objects
Using guidelines in a free form environment provides flexibility with control. See How to add, delete, and move guidelines, Page 72, and How to move and position objects using guidelines, Page 73.
Seagate Crystal Reports uses Overflow Field Representation to assist users when working with numeric or currency values in report cells. Normally, if a numeric or currency value is larger than the field containing it, that value is truncated, or “clipped.” For example, values like 100,000,000 might appear on the report as 1,000, or as 000 (depending on the properties you have set). This could potentially cause confusion when the report is read.
When field clipping is disabled (activate Overflow Field Representation), numeric/currency field values that exceed the field size will be represented by number signs (######) in the Preview Tab, letting you know immediately when the field is too small. See How to disable field clipping, Page 78.
Seagate Crystal Reports enables you to insert a variety of objects in a report:
●Field objects
Fields from database tables and from the result sets returned by formulas, parameters, group names, queries, and stored procedures. See How to insert database fields, Page 105.
●Text objects
Characters, words, even entire documents. See How to insert text objects, Page 108.
●Picture objects
Bitmaps (*.bmp, *.pcx, *.tif, *.tga, *jpeg). See How to insert a picture, Page 109.
●Chart objects
Charts that display summarized data. See Charting, Page 369.
●Subreport objects
Reports within reports, freestanding or bound to the data in the primary report. See How to insert a subreport, Page 419.
●Cross-tab objects
Spreadsheet-like reports that help identify trends. See Cross-Tab Objects, Page 443.
●OLE objects
Pictures, spreadsheets, text, and other objects created in OLE server applications. See OLE Objects Overview, Page 404.
68 |
Seagate Crystal Reports User’s Guide |
●Map objects
Geographic maps that can present data from groups, detail fields, cross-tab data, and OLAP grids. See Mapping, Page 385.
Objects are containers. They can hold data and, in some cases, other objects (for example, a text object can contain field objects as well as text, and labels in a cross-tab object are actually text objects). Each object has properties that define the way the object acts in a report.
For objects, fixed properties, conditional properties, or a combination of the two can be set.
●Dialog box options are used to set fixed properties.
●Special formulas are used to set conditional properties.
See Absolute formatting, Page 211 and Conditional formatting, Page 212.
Most objects can be inserted into most report sections, but the program restricts placement of some objects in some sections because it does not make sense to place them there. For example, since a Details section prints with each record, a cross-tab object placed in a Details section would produce a cross-tab report for each record, not something that would be very useful. The program thus excludes cross-tab objects from the Details section. See Area printing characteristics, Page 59, for a summary of section/ object restrictions.
NOTE: See How to make an object underlay a following section(s), Page 111 for information on printing objects in sections where they can not be physically placed.
You never have to worry about putting an object where it doesn’t belong; the program takes care of that for you. However, each situation requires some judgement on your part. For example, if you place a picture object in a:
●Report Header section, it prints once at the beginning of the report.
●Group Header section, it prints once with every group.
●Details section, it prints once with every record.
Based on what you are trying to accomplish in the report, it clearly makes sense to place the object in one of the sections and not in the others. It is up to you to decide what is best for your report. For more information, see Area printing characteristics, Page 59.
You can also set fixed and conditional properties for sections, just as you can for objects. See Conditional formatting, Page 212.
Getting to Know Seagate Crystal Reports |
69 |