

Radiation Physics for Medical Physiscists - E.B. Podgorsak
.pdf8.4 Activation of Nuclides |
289 |
Fig. 8.9. Normalized daughter activities zD of (8.105) for the saturation model (dotted curves) and yD of (8.103) for the depletion model (solid curves) against the variable x for various decay factors m in the transient equilibrium region from 0.05 to 1.0 as well as for m = 2 and m = 5 in the non-equilibrium region where m > 1. The yP curve is shown dashed. Points of ideal equilibrium specified for the depletion model by (xmax)D and (ymax)D are indicated with heavy dots on the yP curve. Variables x and yP are given by (8.100) and (8.101), respectively. Variables zD for the saturation model and yD for the depletion model (m = 1) are given by (8.105) and (8.103), respectively. Variable yD for the depletion model with m = 1 is given by (8.104). The activation m is defined in (8.95)
Similarly to (8.41), the variable yD(x) for the depletion model is given by the following function after inserting (8.95), (8.98), and (8.100) into (8.92) to get
yD = 1 |
1 m |
|
e−x ln 2 − e− m ln 2 |
= 1 |
1 |
m |
|
2x |
− 2x/m |
. (8.103) |
||||
|
|
|
|
x |
|
|
|
|
1 |
1 |
|
|
||
|
|
− |
|
|
|
− |
|
|
|
|
|
|
|
|
Equation (8.103) is valid for all positive m except for m = 1. For m = 1, yD(x) is given by the following function, as discussed in relation to (8.42):
yD(m = 1) = (ln 2)x/(2x) . |
(8.104) |
For the saturation model, on the other hand, the normalized daughter activity zD is given for any m > 0 as follows after inserting (8.95), (8.98) and (8.100) into (8.93)
z |
D |
= |
AD(t) |
= |
AD(t) |
|
= 1 |
− |
e−λDt |
|
|
|
|
|||||||
|
|
(Asat)D |
|
σPϕN˙ P(0) |
|
|
|
|
|
1 |
|
|
||||||||
|
|
|
|
|
e− |
λD |
(ln 2)x = 1 |
|
|
(ln 2)x |
|
|
|
|||||||
|
|
= 1 |
− |
σPϕ˙ |
|
− |
e− |
|
|
= 1 |
− |
|
. |
(8.105) |
||||||
|
|
|
|
m |
|
|||||||||||||||
|
|
|
|
2x/m |
||||||||||||||||
|
|
|
|
|
|
|
|
|
|
|
|
|
|
|
|
|
||||
To illustrate the general case of neutron activation for any m between zero (secular equilibrium) and 1 (start of non-equilibrium conditions) we show in Fig. 8.9 a plot of yD and zD against x for various m in the range from 0.05
290 8 Radioactivity
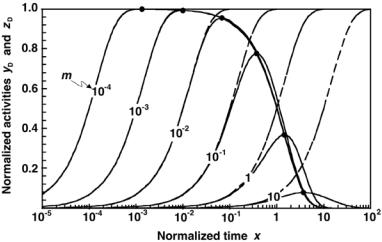
Fig. 8.10. Normalized daughter activities zD of (8.105) for the saturation model (dashed curves) and yD of (8.103) for the depletion model (solid curves) against the variable x for various activation factors m in the range from m = 10−4 to m = 10. The heavy dots represent (ymax)D, the maxima of yD for given m and follow the normalized parent activity yP of (8.101). Variables x and yP are given by (8.100) and (8.101), respectively. Variables zD for the saturation model and yD for the depletion model (m = 1) are given by (8.105) and (8.103), respectively. Variable yD for the depletion model with m = 1 is given by (8.104). The decay factor m is defined in (8.95)
to 5 for both activation models: the saturation model of (8.105) with dashed curves and the depletion model of (8.103) with solid curves. For comparison we also show the yP curve that indicates the depletion of the target nuclei during the neutron activation process.
The points of ideal equilibrium in the depletion model, where yD reaches its maximum, are shown with dots on the yP curve in Fig. 8.9. The expressions for (xmax)D and (ymax)D in terms of the activation factor m = 1 are given by (8.96) and (8.98), respectively, and for m = 1 by (8.97) and (8.99), respectively.
In Fig. 8.10 we plot the normalized daughter activities zD for the saturation model and yD for the depletion model from (8.105) and (8.103), respectively, against the variable x on a logarithmic scale to cover 6 orders of magnitude in the activation factor m ranging from 10−4 to 10. Some of the data presented in Fig. 8.10 have already been plotted in Fig. 8.9 that covers a much smaller range in m (from 0.05 to 5). The maxima (ymax)D in depletion model curves are indicated with heavy dots that also follow a trace of yP, the normalized number of parent nuclei given in (8.101).
The following conclusions can now be reached with regard to Figs. 8.9 and 8.10:
8.4 Activation of Nuclides |
291 |
1.In practical neutron activation procedures the activation factor m = σPϕ/λ˙ D is generally very small, justifying the use of the saturation model in studies of radioactivation dynamics. However, since m depends on the fluence rate ϕ˙ , neutron activation processes with very high fluence rates or relatively long activation times may invalidate the saturation model in favor of the depletion model.
2.The initial slope dyD/dx at t = 0 is proportional to the activation yield Y defined for the saturation model in (8.77). A closer look at Figs. 8.9 and 8.10 reveals that both the saturation model and the depletion model
predict yD with the same initial slopes equal to (ln 2/m) irrespective of the magnitude of m. This result can be obtained by taking the derivative dyD/dx at x = 0 of (8.105) for the saturation model and (8.103) for the depletion model.
3.For all m in the saturation model zD approaches its saturation value of 1.0 exponentially, while in the depletion model yD reaches its peak value (ymax)D at (xmax)D and then decreases with increasing x.
4.In the saturation model, for a given m, the normalized daughter activity zD approaches exponentially the saturation value (zsat)D = 1. The larger is m, the shallower is the initial slope, and the slower is the approach to saturation.
5.In the depletion model, for a given m, the normalized daughter activity yD exhibits a maximum value (ymax)D that is smaller than the saturation value (zsat)D = 1. The larger is m the larger is the discrepancy between the two models and the smaller is (ymax)D in comparison with (zsat)D = 1.
6.Parameter (ymax)D is the point of ideal equilibrium calculated from (8.98) and (8.99). It depends on (xmax)D, as shown in (8.98). Parameter (xmax)D in turn depends on the activation factor m and is calculated from (8.46) and (8.96). As m decreases from m = 1 toward zero, (xmax)D decreases and (ymax)D increases, as shown by dots on the yP curve in Figs. 8.9 and 8.10.
7.For m > 10−3 parameter (ymax)D decreases with increasing m. Thus, in this region of m the depletion model should be used for determination of the daughter activity.
8.For all 0 < m < 1, variables yP and yD are said to be in transient equilibrium at x (xmax)D. For m ≥ 1 no equilibrium between yP and yD exists at any x.
9.For m < 10−2, yP and yD are in the special form of transient equilibrium called secular equilibrium.
10.For m < 10−3 the saturation model and the depletion model give identical results, i.e., yD = zD, for x ≤ (xmax)D and attain a value of 1 at x = (xmax)D. However, for x > (xmax)D, zD remains in saturation, while yD decreases in harmony with yP.
11.Using (8.102) we can now express (Amax)D, the maximum daughter activity in the depletion model, as follows:

292 8 Radioactivity
(AD)max = (ymax)DσPϕN˙ P(0) = σPϕN˙ |
P(0) 2−(xmax)D |
|||
|
|
m |
|
|
= σPϕN˙ |
P(0) e− |
1−m |
ln m . |
(8.106) |
12.Equation (8.106) shows that the maximum daughter activity (Amax)D depends on the saturation activity (Asat)D = σPϕN˙ P(0) and on (ymax)D which approaches 1 for m → 0, as shown in Fig. 8.4. However, as m increases toward 1, (ymax)D decreases, resulting in (Amax)D that may be significantly smaller than (Asat)D.
13.Since the normalized daughter activity yD(x) decreases with x for x > (xmax)D, it is obvious that activation times beyond (xmax)D are counterproductive.
8.4.5Maximum Attainable Specific Activities
in Neutron Activation
As is evident from Fig. 8.10, (ymax)D, the maximum normalized daughter activity for the depletion model decreases with the activation factor m = σpϕ/λ˙ D. In practice this means that, for a given daughter radionuclide, (ymax)D depends only on the particle fluence rate ϕ˙ , since the parameters σp and λD remain constant.
We now determine the maximum daughter specific activities (amax)D that can be attained during the activation process, as predicted by the saturation model and the depletion model.
For the saturation model we use (8.105) to get
|
max |
D |
|
sat |
D |
|
MP |
max |
D |
|
P |
|
MP |
|
P AP |
|
||
(a |
) |
|
= (a |
) |
|
= |
(Asat)D |
= (z |
) |
|
σ |
|
ϕ˙ |
NP(0) |
= |
σ |
NA |
ϕ˙ , |
|
|
|
|
|
|
|||||||||||||
(8.107)
where Mp and Ap are the atomic mass and the atomic mass number of the parent nucleus, respectively, and the parameter (zmax)D is equal to the saturation value of zD equal to 1. Since σpNA/Ap is constant for a given parent nucleus, we note that (amax)D is linearly proportional to ϕ˙ , the particle fluence rate. As ϕ˙ → ∞ we get
ϕ˙lim (amax)D = ∞ , |
(8.108) |
→∞ |
|
This is obviously a problematic result, since we know that the maximum daughter specific activity produced through neutron activation cannot exceed the theoretical specific activity (atheor)D, given for the daughter in (8.2) as
(atheor)D = |
AD |
= |
λDND |
= |
λDNA |
. |
(8.109) |
|
|
||||||
|
MD |
MD |
AD |
|
|||
Equation (8.107) shows that the saturation model is useful as an approximation only for relatively low particle fluence rates ϕ˙ ; at high fluence rates it breaks down and predicts a physically impossible result.
294 8 Radioactivity
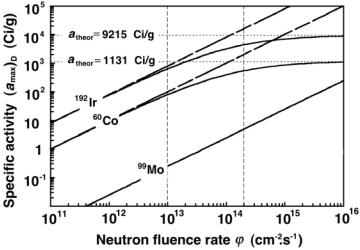
Fig. 8.11. Maximum attainable specific activities (asat)D and (amax)D for the saturation model (dashed curves) and the depletion model (solid curves), respectively, plotted against neutron fluence rate ϕ˙ for cobalt-60, iridium-192, and molybdenum99 daughter products in neutron activation. The theoretical specific activities of cobalt-60 and iridium-192 are indicated with horizontal dashed lines. The vertical dashed lines at ϕ˙ = 1013 cm−2 · s−1 and 2 × 1014 cm−2 · s−1 indicate data for the two neutron fluence rates of Table 8.2
and molybdenum-99. The theoretical specific activities (atheor)D for cobalt60 and iridium-192 are also indicated in the figure. We note for iridium-192 and cobalt-60 that in the practical range from 1013 to 1015 cm−2 · s−1 the saturation model fails, while the depletion model approaches asymptotically the theoretical result. For molybdenum-99 in the neutron fluence range shown in Fig. 8.11, the maximum attainable specific activities are 5 to 6 orders of magnitude lower than (atheor)MO, so that the saturation and depletion model give identical results as a consequence of (σMOϕ/λ˙ MO < 10−3).
Table 8.1 lists the important characteristics of cobalt-60, iridium-192, and molybdenum-99. The theoretical specific activity (atheor)D is calculated from (8.2) assuming that the radioactive nuclide contains only the daughter nuclei, i.e., the source is carrier-free.
Table 8.2 lists the neutron activation characteristics for the saturation and depletion models applied to production of cobalt-60, iridium-192 and molybdenum-99 with two neutron fluence rates: ϕ˙ = 1013 cm−2 · s−1 and ϕ˙ = 2 × 1014 cm−2 · s−1. The two fluence rates are indicated with vertical dashed lines in Fig. 8.11 and are representative of rates used in activation processes with modern nuclear reactors. Of main interest in Table 8.2 are the maximum attainable specific activities (asat)D and (amax)D predicted by the saturation model and the depletion model, respectively, and their comparison

8.4 Activation of Nuclides |
295 |
Table 8.1. Characteristics of three radionuclides: cobalt-60, iridium-192, and molybdenum-99 produced by neutron activation in a nuclear reactor
Daughter nuclide |
Cobalt-60 |
Iridium-192 |
Molybdenum-99 |
|
|
|
|
|
|
Half-life (t1/2)D |
5.27 y |
73.8 d |
66 h |
|
Decay constant (s−1) |
4.171 × 10⁻⁹ |
1.087 × 10⁻⁷ |
2.917 × 10⁻⁶ |
|
Parent nuclide |
Cobalt-59 |
Iridium-191 |
Molybdenum-98 |
|
Nuclear reaction |
2759Co(n,γ)2760Co |
77191Ir(n,γ)77191Ir |
4298Mo(n, γ)4299Mo |
|
Cross section (b) |
37.2 |
954 |
0.13 |
|
atheor(a) |
(Ci/g) |
1.131 × 10³ |
9.215 × 10³ |
4.8 × 10⁵ |
(b) |
(Ci/g) |
250 |
450 |
0.3 |
apract |
||||
σPNA/AP |
(cm2/g) |
0.38 |
3.01 |
8 × 10⁻⁴ |
(a)Theoretical specific activity: atheor = λDNA/AD, assuming a carrier-free source.
(b)Practical specific activity produced in a nuclear reactor.
to the theoretical values (atheor)D for the three daughter D products, also listed in the table.
Two interesting features of Fig. 8.11 and Table 8.2 are of note:
•For cobalt-60 (atheor)Co = 1131 Ci/g, while at ϕ˙ = 2 × 1014 cm−2 · s−1 the saturation model for cobalt-60 production predicts (asat)Co = 2054 Ci/g, a physically impossible result. On the other hand, the depletion model predicts that (amax)Co = 550 Ci/g which is a realistic result that can be substantiated with experiment.
•A study of iridium-192 results in conclusions similar to those for cobalt-60 and this is understood, since the activation factors m for the two radionuclides are essentially identical. The activation factor m for molybdenum99 for practical fluence rates, on the other hand, is so small that both models predict identical specific activities, both a miniscule fraction of
(atheor)MO.
Of interest is also the activation time (tmax)D required to obtain (amax)D using the depletion model. From (8.100) and (8.96) we obtain
(t |
) |
D |
|
x |
|
ln m |
λD ln σPϕ˙ |
|
|
|
|
|
max |
= |
max |
= |
|
= |
λD |
|
, |
(8.113) |
|
|
|
|
|
|
(ln 2)(σPϕ˙ − |
|
|||||
(t1/2)D |
m |
|
(ln 2)(m − 1) |
λD) |
|
||||||
with roughly an inverse proportionality with fluence rate ϕ˙ . Thus, the higher is the particle fluence rate ϕ˙ , the shorter is the time required to reach the maximum specific activity (amax)D. For example, (tmax)Co is 20.2 years at ϕ˙ = 1013 cm−2 · s−1 and 5.61 years at ϕ˙ = 2 × 1014 cm−2 · s−1, as also shown in Table 8.2.
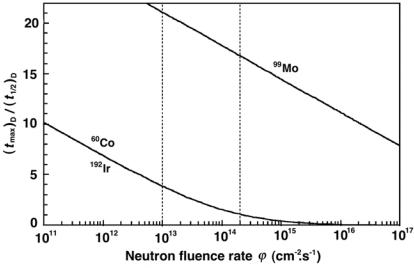
The time (tmax)D/(t1/2)D of (8.113) is plotted against the neutron fluence rate ϕ˙ for cobalt-60, iridium-192, and molybdenum-99 in Fig. 8.12. The curves

8.4 Activation of Nuclides |
297 |
Fig. 8.12. Time (tmax)D/(t1/2)D required for reaching the maximum specific activity (amax)D plotted against neutron fluence rate ϕ˙ for cobalt-60, iridium-192, and molybdenum-99. The data were calculated with the depletion model of radioactivation
activities atheor of 1131 Ci/g and 9215 Ci/g for cobalt-60 and iridium-192, respectively, are indicated on the figure.
The discrepancy between the saturation and depletion model is evident, especially at high fluence rates and large activation times. An obvious break down of the saturation model occurs when it predicts a specific activity aD that exceeds the theoretical specific atheor.
Since both the saturation and the depletion model show identical initial slopes, i.e., activation yields [see (8.84) and Fig. 8.8], one may use the saturation model as a simple yet adequate approximation to the depletion model at activation times short in comparison with tmax. However, when the goal is to obtain optimal specific activities in the daughter of the order of the theoretical specific activity for a given radionuclide, such as the cobalt-60 source for external beam radiotherapy or iridium-192 source for industrial radiography, the saturation model fails and the depletion model should be used for estimation of the required radioactivation times and specific activities expected.
Equation (8.111) gives a relationship between the maximum attainable specific activity (amax)D and neutron fluence rate ϕ˙ for the depletion model. We now calculate the fraction f of the theoretical specific activity (atheor)D that (amax)D amounts to at a given fluence rate ϕ˙ . The functional relationship between f and (amax)D will allow us to estimate the maximum possible
298 8 Radioactivity
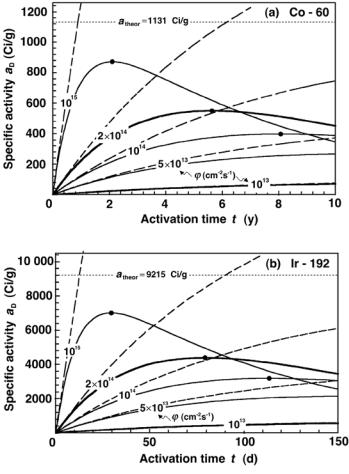
Fig. 8.13. Specific activity aD of cobalt-60 in part a and of iridium-192 in part b plotted against activation time t for various neutron fluence rates. The specific activity aD is calculated for the saturation model (dashed curves) given by (8.105) and the depletion model (solid curves) given in (8.103). Both equations are used in conjunction with (8.100) to obtain a plot of aD against activation time t rather than against the variable x. The heavy dots on the depletion model curves represent the time (tmax)D at which the maximum specific activity (amax)D occurs
specific activity for a given parent/daughter combination in a radioactivation process with a given fluence rate ϕ˙ . We write (amax)D as follows:
λDNA |
|
σPNA |
|
m |
|
ln m |
|
|
|
|
|
|
|
|
|||||
(amax)D = f (atheor)D = f |
|
= |
|
ϕ˙ e 1−m |
|
, |
(8.114) |
||
AP |
AP |
|
|||||||
|
|
|
|
|
|
|
|
||