

Micro-Nano Technology for Genomics and Proteomics BioMEMs - Ozkan
.pdf112 |
RONALD PETHIG |
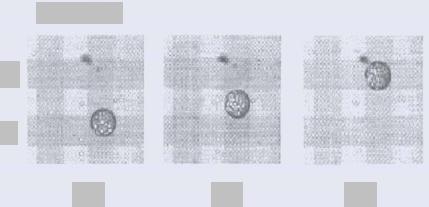
FIGURE 4.4. DEP separation of viable and non-viable yeast cells using interdigitated, castellated, electrodes. The viable cells collect at the electrode edges, whilst the non-viable cells collect in triangular aggregations between the electrodes and also along the central axes of the electrodes [53].
can be moved or assembled in electrode arrays by sequentially or concurrently applying one or more frequencies to vary the polarity and magnitude of the DEP force [70], and an example of how this can be used to manipulate a cell on a matrix array is shown in figure 4.6.
FIGURE 4.5. Separation of a mixture of Gram positive and Gram negative bacteria (B. subtilis and E. coli, respectively). Under the same experimental conditions, Gram positive bacteria usually exhibit the higher polarizability and can be trapped at the electrodes by positive DEP. Gram negative bacteria are forced away from the electrodes by negative DEP. (unpublished work, related to Markx et al [54]).
CELL PHYSIOMETRY TOOLS BASED ON DIELECTROPHORESIS |
113 |
12
A
B
(a) |
(b) |
(c) |
FIGURE 4.6. DEP manipulation of a single protoplast on a grid of transparent indium tin oxide (ITO) electrodes. The electrodes have been artificially darkened in these pictures [92].
4.5. SURFACE CHARGE EFFECTS
Bioparticles generally carry a net negative charge at physiological pH associated with the presence of charged polymers and acidic groups on their surfaces. This fixed charge can influence the DEP behavior through electrophoresis, and counter-ion relaxations in the double layer that forms around all charged particles when they are suspended in aqueous media. Counter-ion relaxation processes involve both ionic diffusion and ionic conduction around the particle surfaces. Valuable insights into the nature of dielectric relaxations associated with double layers and surface conductivity were obtained from electrorotation measurements of latex beads [2], and a comprehensive review of such effects is given by Lyklema [50]. (The electrode polarization effect described earlier represents an example of double layer polarization.) These processes should manifest themselves as additional polarizability terms to be added to eqn. 4.5, and thus contribute to the overall frequencydependent DEP behavior of a particle. In fact, polarizations associated with surface charge effects can dominate over that given by eqn. 4.5, producing a so-called anomalous positive DEP effect [25, 64, 65]. The term anomalous is probably unfortunate, as it implies that the laws of physical chemistry are not being obeyed. Rather, it reflects more our incomplete knowledge of how electrical double-layer and surface conduction effects contribute to the total DEP polarizability of a particle.
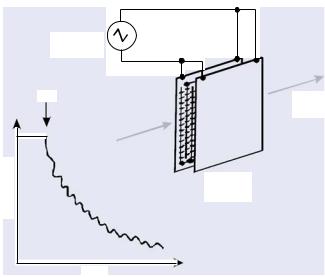
A simple and rapid way to monitor the DEP response is shown in figure 4.7. In this method, small changes are measured of the intensity of the light transmitted through a suspension of particles held between two electrode arrays. The light output increases when particles collect at the electrodes by positive DEP, but decreases when negative DEP pushes the particles into a dense band in the centre of the chamber [9, 97]. Close inspection of the signal shown in figure 4.7, for the case of a 1 Hz signal applied to a suspension of bacteria (M. lysodeikticus), reveals an oscillatory pattern superimposed onto the absorbance decay. This oscillation represents electrophoretic motion of the bacteria, an effect which becomes insignificant (in this type of measurement at least) above 10 Hz. A simple analysis
114 |
RONALD PETHIG |
Signal
Generator
ON
Absorbance
Light
Beam
Electrode
Arrays
Time
FIGURE 4.7. A simple method for monitoring the DEP behavior of cell suspensions involves measuring changes in the intensity of a light beam passing through the DEP chamber. The light input decreases if cells are attracted to the electrodes by positive DEP, and the rate of change of absorbance is proportional to the DEP force. The absorbance trace shown here was made after application of a 1 Hz voltage signal to the electrode array, and exhibits oscillations associated with electrophoresis effects [9].
demonstrated that this low-frequency electrophoretic response enhanced the DEP effect by driving the bacteria nearer to the electrodes [9].
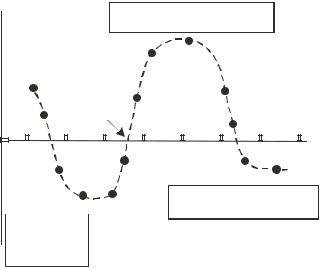
The DEP frequency response for Micrococcus lysodeikticus is shown in figure 4.8 alongside the dielectric spectrum for these bacteria [16]. The regions marked α and β follow the conventional assignments of dielectric dispersions observed for biological materials [89]. The α-dispersion arises from ionic relaxations in electrical double-layers, and membrane ionic conduction effects. The β-dispersion is the Maxwell-Wagner interfacial polarization described by eqn. 4.5. It is of relevance to DEP studies to note the large magnitude of the α-dispersion, and that it is sensitive to metabolic state—often disappearing ahead of the β-dispersion on cell death [89]. It is also important to note, from figure 4.8, that the intact cell wall of a bacteria contributes significantly to its low frequency dielectric response. This strong dependence on the presence of an intact cell wall was also observed in DEP measurements [44]. Gram positive and Gram negative bacteria have differences in the structures of their outer cell walls and membranes, and this is reflected in their different DEP behavior [39, 53]. For example, Gram-positive bacteria synthesize a uniform peptidoglycan-structured cell wall, whilst Gram-negative cells have a more complicated wall structure which includes lipids and proteins forming an outer membrane covering a layer of peptidoglycan. The cell walls of Gram-positive bacteria are also characterized by the incorporation of covalently bound teichoic acid, teichuronic acid and proteins, forming open networks with high charge densities comparable with ion-exchange materials. The presence of such charged groups and the absence of an outer lipid membrane leads to the tendency of Gram positive bacteria to exhibit higher polarizabilities than Gram negative

CELL PHYSIOMETRY TOOLS BASED ON DIELECTROPHORESIS |
115 |
Micrococcus lysodeikticus
Relative DEP Force
Log Relative Permittivity
100 |
|
|
|
|
|
|
|
10 |
|
|
Dielectrophoresis |
|
|
|
|
|
α |
|
|
|
|
|
|
|
|
|
|
|
|
|
|
1 |
Interfacial Polarization (eqn.5) |
|
β |
|
|||
|
|
|
|
||||
0.1 |
|
|
|
|
|
|
|
0 |
1 |
2 |
3 |
4 |
5 |
6 |
7 |
|
|
|
Log Frequency (Hz) |
|
|
||
6 |
|
|
|
|
|
|
|
5 |
|
|
|
|
|
|
|
4 |
|
|
|
Dielectric Spectroscopy |
|
||
|
α |
|
|
|
|
|
|
|
|
|
|
|
|
|
|
3 |
|
|
|
|
|
|
|
|
Cell Wall Removed |
|
|
|
β |
||
2 |
|
|
|
|
|||
|
|
|
|
|
|
|
|
1 |
2 |
3 |
4 |
5 |
6 |
7 |
8 |
1 |
|||||||
Log Frequency (Hz)
FIGURE 4.8. The DEP response (top) of a suspension of Micrococcus lysodeikticus [9] exhibits two regions of behavior reflected (bottom) in the dielectric properties [16]. The α-dispersion, arising from relaxation of the electrical double-layer and ionic conduction in the cell wall, builds onto the β-dispersion arising from interfacial polarizations. Removal of the cell wall significantly reduces the α-dispersion. The decade frequency shift between these two sets of results reflects differences in the ionic strength and osmolarity of the suspending media.
ones, and to their ready discrimination by DEP (e.g., figure 4.5). The cell walls of yeast cells consist mainly of uncharged polysaccharides, and this leads to their having a lower polarizability than bacteria [53].
We have noted above that the magnitude of the α-dispersion is sensitive to the metabolic state of the cell, and during the process of cell death disappears before the β-dispersion. We can expect similar behavior for bacteria. Apart from the degradation of charged groups, the loss of the membrane’s ability to act as a barrier to passive ion flow will also influence the DEP behavior of a non-viable organism. DEP experiments are often performed in low conductivity media, and so impairment of the membrane can lead to a significant decrease in cytoplasmic conductivity as ions leak out of the cell. This process, rather than surface charge degradation, appears to be relevant to the fact that yeast and bacteria can be separated by DEP into viable and non-viable fractions (e.g., [48, 54, 93]). Selective separation and detection of bacteria by DEP can be enhanced using antigen-antibody reactions [94].
116 |
RONALD PETHIG |
Mammalian cells do not possess a cell wall, so the α-dispersion should mainly arise from surface conduction effects and relaxations of the electrical double layer associated with fixed charges on their plasma membranes. This is supported by the finding that the low frequency DEP response for erythrocytes and erythroleukemia cells is reduced following neuraminidase-treatment to reduce cell membrane charge by 50 60% [10, 24]. Most mammalian cells have electrophoretic mobilities between 0.7 and 1.40 × 10⁻⁴ cm2/Vs [4]. Following standard theory [27] these mobility values can be calculated to represent membrane surface charge densities ranging from −0.65 to −1.35 µC/cm2 for a suspending medium of ionic strength 180 mM at 20◦C. Cell surface charge appears to be regulated by cytokines which are predominantly produced during cell activation or differentiation [5]. From the studies of neuraminidase-treated cells, it would seem possible that such regulations of surface charge are amenable to DEP investigation. Complications may arise from the fact that, although the distribution of the negative charges associated with acidic groups on mammalian cell surfaces is fairly uniform, the positive charges arising from basic groups increases with increasing inward distance from the membrane-medium boundary [62]. How such a complicated surface charge arrangement influences double layer relaxations and surface conductance effects is as yet not fully understood.
DNA does not possess an intrinsic dipole moment, but it exhibits a large polarizability, assumed to be associated with field-induced fluctuations and mobility of counterions along the molecule’s axis [66, 92]. Recent dielectric measurements have supported and refined this picture (e.g., [3, 85]). Washizu et al [108, 109] were the first to demonstrate that DNA (and proteins) can be manipulated by DEP, and in doing so opened up DEP studies of sub-micron particles. To date, DEP studies have been performed on enveloped and nonenveloped viruses, proteins, DNA and nano-beads. Electrical double-layer polarizations associated with surface charges dominate the DEP behavior of such particles. An excellent review of such work on nanoparticles, including their own important contributions, is given by Morgan and Green [59].
4.6. OTHER PHYSIOMETRIC EFFECTS
From considerations of the relevant dielectric and DEP studies, we can deduce that the most important cell parameters influencing the DEP behaviour of cells include:
The viability of the cell (e.g., chemical and physical integrity of its plasma membrane)
The size and shape of the cell
The surface morphology of the cell plasma membrane
The ratio of lipid to other molecular components in the cell membrane
The internal composition of the cell (e.g., volume of nucleus, endoplasmic reticulum)
These various physiometric properties that contribute to the DEP spectrum for a typical mammalian cell (e.g., blood, cancer, stem cells) are summarized in figure 4.9. Different structural, physico-chemical and cell state-related properties are probed as the applied frequency is swept over a range from around 100 Hz to 500 MHz. Apart from the nature of its heterogeneous structure and surface charge properties, the gross size and shape of a cell, its fine membrane surface features, membrane composition and extent of cytoskeleton development, are important factors influencing DEP behavior at frequencies below around
CELL PHYSIOMETRY TOOLS BASED ON DIELECTROPHORESIS |
117 |
Membrane Integrity & Morphology
Cell Size & Shape, Cytoskeleton
+ve DEP |
|
|
|
|
|
|
fxo |
|
|
|
|
|
|
|
|
|
|
|
||
|
|
|
|
|
|
|
|
|
|
|
|
|
|
|
|
|
|
|||
0 |
|
|
|
|
|
|
|
|
|
|
|
|
|
|
|
|
|
|
|
|
|
100 Hz |
10 kHz |
|
1 MHz |
|
|
|
|
1 GHz |
|||||||||||
|
|
|
|
|
|
|
||||||||||||||
DEP |
|
|
|
|
|
|
|
|
|
|
Nucleus-Cytoplasm Volume Ratio |
|||||||||
|
|
|
|
|
|
|
|
|
|
|
|
|
Endoplasmic Reticulum |
|||||||
–ve |
|
Membrane |
|
|
|
|
|
|
|
|
|
|
|
|
|
|
||||
|
|
|
|
|
|
|
|
|
|
|
|
|
|
|
|
|||||
|
|
Surface Charge |
|
|
|
|
|
|
|
|
|
|
|
|
|
|
||||
|
|
Membrane |
|
|
|
|
|
|
|
|
|
|
|
|
|
|
||||
|
|
Conductivity |
|
|
|
|
|
|
|
|
|
|
|
|
|
|
||||
FIGURE 4.9. A typical DEP characteristic is shown for a mammalian cell, together with the main controlling physiometric parameters. The details of a DEP spectrum vary according to cell type and cell state, and with the dielectric properties of the suspending medium. The DEP cross-over frequency fxo (given by eqn. 4.8) is an important parameter for phenotyping and formulating protocols for cell separations.
10 MHz. The relative permittivity of bulk water is around 79 for frequencies below 1 GHz. It is therefore interesting to note that values from 88 to 99 have been derived for the effective permittivity of the interior of erythroleukaemia cells [35] and from 104 to 154 for the interior of blood cells [110] using electrorotation measurements. Because electrorotation and DEP basically reflect the same dielectric properties of cells [47, 67] we can expect the DEP behavior of cells above 10 MHz to be influenced by their internal dielectric properties. Permittivity values of the order 150 can arise from the dielectric increment effect of solvated proteins, peptides and amino-acids [28, 66]. As the frequency is increased, socalled dielectric decrement effects will cause the permittivity to fall well below a value of 79. At the highest frequencies it is then possible to achieve the condition ε p < εm so that the cells exhibit negative DEP. The resulting transition from positive to negative DEP at a high frequency is depicted in figure 4.9. The nucleus-cytoplasm volume ratio and the extent of the endoplasmic reticulum will also influence matters. Due to experimental difficulties associated with generating the required voltages, very few DEP measurements for cells have been reported above 50 MHz. The usefulness of determining the DEP cross-over frequency in the upper MHz frequencies, as opposed to the lower frequency fxo (given by eqns. 4.8 & 9) has therefore yet to be determined.
Cells at various stages of differentiation (e.g. stem cells, fetal cells) possess different forms of protein cytoskeleton. This will produce differences in the mechanical resilience of a cell, and the extent to which the membrane surface morphology (and hence DEP behavior) will change as a result of changes in medium osmolality or exposure to physical forces (e.g., [104]). Additional information can be obtained by changing the ionic strength, pH, and chemical composition of the suspending medium. Such DEP phenotyping can then be
118 |
RONALD PETHIG |
used to formulate protocols for selectively detecting and isolating cells or other bioparticles, for additional biochemical, physical or genetic analysis. Important examples include the separation and purification from blood or other biological fluids of cancer cells, fetal cells, stem cells, leukocyte subpopulations, cells in different stages of life cycle, bacteria and viruses.
The DEP cross-over frequency fxo determined for mammalian cells, under normal experimental conditions, commonly falls in the frequency range from around 50 kHz to 500 kHz. At these frequencies effects associated with surface charge and surface conduction can usually be neglected. Also, polarizations associated with solvated polar molecules or organelles in the cytoplasm will contribute to the total effective value of the permittivity εp for the cell. In this way, eqn. 4.5 can be used for the total polarizability value, and for a fixed value of the medium conductivity, fxo is determined by the effective capacitance of the cell. This in turn is influenced by the topography of the cell membrane surface, such as the extent of microvilli, bleb and membrane folds and ruffles [36, 38, 104]. Huang et al [38] observed that the fxo values for resting T lymphocytes decreased following mitogenic stimulation from their normally resting Go phase into the cell division cycle. The largest increase in fxo, corresponding to a 77% increase in membrane capacitance (and a probable comparable increase in membrane surface ‘roughness’), occurred as the cells progressed from the G1 phase through the S phase. These results were mirrored in later studies by Pethig et al [74] where the membrane capacitance values of T lymphocytes were found to decrease following a decrease in S phase and an increase in G1 cells. Changes in membrane capacitance and conductivity that occur with time after inducement of apoptosis have been determined by monitoring the fxo values for HL-60 cells [107] and T lymphocytes [75, 77]. Similar studies have been reported for detecting cellular and intracellular responses to toxicants [83]. These various studies provide examples of how DEP can be used to monitor physiological changes, such as those that accompany transmembrane signaling events or gene-directed self-destruction, for example.
4.7. TRAVELING WAVE DIELECTROPHORESIS
The methods described so far for selectively trapping and fractionating bioparticles utilize the flow of a fluid through the DEP chamber. An excellent example of this is the DEP field-flow fractionation technique described by Gascoyne and co-workers [7, 37]. There are advantages for some applications of DEP to have a stationary fluid rather than a flowing fluid, and to selectively translocate particles using traveling electric fields rather than stationary fields.
Masuda et al [55] applied a traveling electric field, produced using poly-phase voltages and a parallel array of electrodes, to an aqueous suspension of blood cells. They found that they could control both translational and circular motions of the cells. The optimal frequency range for such motions was found to be 0.1–10 Hz. We can expect, from our discussion here and the effect shown in figure 4.7, that at such low frequencies these induced cell motions were largely electrophoretic in origin and dependent on cell size and electrical charge carried by the cells. Hagedorn et al [30] later demonstrated that quadrature-phase electric fields of frequency between 10 kHz and 30 MHz could produce linear motions of pollen and cellulose particles, and they coined the term traveling-wave dielectrophoresis (TWD) for
CELL PHYSIOMETRY TOOLS BASED ON DIELECTROPHORESIS |
119 |
|
1.0 |
Re(p) |
|
|
|
||
Im(p) |
0.5 |
|
|
TWD |
TWD |
||
Re(p) & |
|||
0 |
|
 Im(p)
Im(p)
-0.5
2 |
4 |
6 |
8 |
10 |
Log Frequency (Hz)
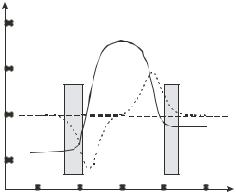
FIGURE 4.10. Frequency dependencies of the real, in-phase, component Re( p) and imaginary, out-of-phase, component Im( p) of the polarizability parameter of eqn. 4.5 for a simple model of a cell (based on [101]). Movement of a cell by conventional traveling wave dielectrophoresis (TWD) can occur only in those narrow frequency ranges where Re( p) is negative (so that the cell is levitated) and where Im( p) is of sufficient magnitude to produce a translational force on the cell [34].
this motion. TWD was found to be restricted to a frequency range where the particles were levitated above the electrodes under the influence of a negative DEP force. This finding was confirmed by Huang et al [34] who further deduced that the TWD velocity is proportional to the imaginary (out-of-phase) component of the Clausius-Mosotti polarizability factor p (eqn. 4.2), whilst the DEP force acting to either trap or levitate the particles above the electrode ‘tracks’ is proportional to the real (in-phase) component of p. This situation is shown in figure 4.10, from which it can be seen that TWD is restricted to narrow frequency ranges where the real component Re( p) of the DEP force is negative and where the imaginary component Im( p) is of sufficient magnitude to produce a translational force.
Theoretical models of TWD have been refined [43, 58, 105] and various practical devices have been developed for manipulating, separating and characterizing blood cells, cancer cells, yeast, and parasites [11, 12, 26, 57, 72, 98, 106]. By employing TWD it is possible to selectively move cells or other bioparticles along a channel in a stationary fluid. Selective movement arises from the intrinsic physico-chemical properties of the bioparticle, so that in many cases tagging the target particle with a biochemical label, bead, dye or other bioengineered marker is not required to achieve selective isolation of the target from other particle types. TWD electrodes can be fabricated in the form of spirals [26, 106], long tracks [57] and, as depicted in figure 4.11, junctions [71]. By applying different frequencies to each ‘arm’ of a TWD junction, particles can either be separated into separate paths, or brought together to engage in controlled particle-particle interactions [73]. Dense concentrations of cells, as well as single cells, can be manipulated and sorted by TWD [11]. Provided that sufficiently long TWD electrode tracks are used, a mixture of different particles can be fractionated into ‘bands’ with a high degree of separation [11, 57].
As shown in figure 4.10 ‘conventional’ TWD motion is restricted to narrow frequency ranges. This restricts the ability to explore the full range of physiometric parameters shown in figure 4.9. This limitation can be overcome by employing the method of Superposition-TWD
120 |
RONALD PETHIG |
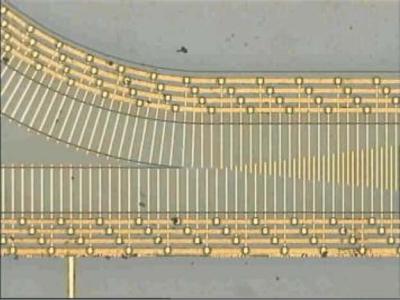
FIGURE 4.11. A TWD junction, fabricated by laser ablation, for separating or bringing together different particles. The electrode elements are 10 µm in width [70, 73].
[75]. If a DEP or second TWD signal is added to a primary TWD signal, the resulting electrostatic potential at the electrodes will be a superposition of the separate voltage functions. As shown in figure 4.12, the method of superposition of signals can be used to open up TWD to the full range of frequencies available to conventional DEP measurements. Basically, the Superposition-TWD method provides control of the levitation height of the cells above the electrode plane, and thus also of the range of frequencies over which TWD can occur. The direction of motion of cells of different phenotype or physiological state can also be controlled. The separation of T lymphocytes according to their cell cycle stage, as well as of the separation of mixtures of T lymphocytes and monocytes, has been demonstrated [75].
4.8. CONTROLLING POSSIBLE DEP-INDUCED DAMAGE TO CELLS
The possibility that, during the process of DEP separation or manipulation, cells may be irreversibly damaged is an important issue to address. The fact that mammalian cells can sometimes ‘burst’ when exposed to DEP forces is well known to workers in the field, and is sometimes reported (e.g., [24]). In figure 4.12, the frequency range is identified where T cells can, under certain conditions, either suffer irreversible damage or be physically destroyed when exposed to a TWD field. Selective cell bursting may be a desired objective as a means, for example, to release proteins or DNA from a target cell. In other applications, as for example in the purification of stem cells prior to cell therapy, damage is not acceptable.
DEP-induced cell damage can arise from at least three main sources, namely: effects associated with the cells being suspended in a non-physiological medium; stress induced

CELL PHYSIOMETRY TOOLS BASED ON DIELECTROPHORESIS |
121 |
TWDVelocity(m/sec)
co-field TWD
2 0
1 0 
0  -10
-10 
-20 
-30 |
|
|
|
-40 |
|
|
|
-50 |
|
anti-field TWD |
|
2.0 |
|
||
|
|
|
|
Superimposed |
|
|
|
1.5 |
|
|
|
|
1.0 |
|
|
|
DEP |
signal |
0.5 |
|
|
(Vrms) |
|
|
|
|
|
03
A
8
|
|
|
7 |
|
|
6 |
(Hz) |
|
5 |
|
|
4 |
Frequency |
|
|
Log |
|
||
|
|
||
|
|
|
FIGURE 4.12. 3-D plot of the frequency variation of the TWD velocity for T cells, as a function of the magnitude of a superimposed ‘stationary’ DEP signal applied at a fixed frequency of 10 kHz. The superimposed DEP signal opens up the TWD ‘window’ to give access to the full frequency range available in normal DEP measurements. Cell velocity mirrors the Im( p) characteristic shown in figure 4.10, so that both coand anti-field movement is available to facilitate cell separations. In frequency region ‘A’ cells experience a positive DEP force and can suffer damage from large shear forces when they are retained close to the electrodes. In the TWD regions, the cells are levitated off the electrodes and do not suffer from such shear forces [77].
by the applied electric field; shear stresses associated with fluid flow. Workers in the field are now competent in their choice of cell suspending media and levels of applied DEP forces. Under gentle DEP conditions, cell viability can be maintained. For example, the viability of erythrocytes separated from leukemia cells has been verified using trypan blue dye [6], and CD34+ cells have been successfully cultured following their DEP enrichment from bone marrow and peripheral stem cell harvests [91]. Fuhr et al [20] demonstrated that fibroblasts can be successfully cultivated, without significant change in their viability, motility, anchorage or cell-cycle time, when exposed continuously over a period of three days to DEP fields. Although very small increases were observed in the stress-related gene c-fos expression levels for glioma and neuroblastoma cells separated by DEP, subsequent culturing experiments demonstrated that there were no effects on cell growth [41]. Bacteria and yeast cells are protected by strong cell walls and can survive more severe DEP manipulations than mammalian cells. The viability of DEP-separated yeast cells has been checked by staining with methylene blue and plate counts [54], and DEP damage of bacteria has not been reported in the literature (or observed in our laboratories). The highest reported fluid flow rate for DEP cell separation appears to be 2.5 mL/min [52]. Because of the relatively small dimensions of a typical DEP separation chamber, this flow rate is well within the limits for laminar flow and corresponds to a shear stress exerted on the cells of around 0.3 N/m2. This is well below the shear stress of 150 N/m2 required to damage erythrocytes