

Molecular and Cellular Signaling - Martin Beckerman
.pdf3.11 A Genetic Method for Detecting Protein Interactions |
61 |
the chirality condition. The left and right handed forms of chiral molecules are collectively referred to as optical isomers or as enantiomers— nonsuperimposable mirror images of one another.
Chiral biological materials are sensitive to the chiral behavior of left and right circularly polarized light and absorb the two light forms in different ways. In circular dichroism (CD), differences in absorption between left and right circularly polarized light are measured as a function of wavelength. These measurements provide information on the secondary structure content of the proteins.The measurements can be used to determine whether the protein is mostly alpha helical, or whether it is made up mostly of antiparallel beta sheets and turns. Circular dichroism utilizes the ultraviolet (UV) portion of the electromagnetic spectrum, typically in the range of 200 nm.
3.10Infrared and Raman Spectroscopy to Probe Vibrational States
Transitions between rotational states in proteins are of fairly low energy and correspond to absorption of EM radiation in the microwave portion of the spectrum. Vibrational transitions are somewhat higher in energy. There are three kinds (modes) of vibrations—symmetric stretching, asymmetric stretching, and bending. In symmetric stretching, the stretching and contractions in bond length of a pair of bonds connecting a central atom to its two neighbors are of the same magnitude. In asymmetric stretching, the stretches and contractions are of unequal magnitude. The energies of the transitions between vibrational states lie in the infrared portion of the EM spectrum and can be explored using infrared (IR) spectroscopy and Raman spectroscopy.
In infrared spectroscopy, measurements are made of the frequencies of IR light that are being absorbed by the sample of interest. The IR wavelengths of most interest in explorations of biomolecules span the range from
2.5 to 15 microns, which is in the middle IR regime. The absorption spectra measured using IR spectrometers contain dips at wavelengths where the light has the correct energy to induce transitions between vibrational states and be absorbed. In Raman spectroscopy, inelastically scattered light is examined. The difference in energy between absorbed and emitted light is taken up by other vibrational transitions, and these transitions appear as spikes in the spectra.
3.11A Genetic Method for Detecting Protein Interactions
The yeast two-hybrid system is a genetic method for detecting proteinprotein interactions. There are a number of methods for detecting interactions between proteins. One of these, first introduced in 1989 and widely

62 3. Exploring Protein Structure and Function
used since then, is the yeast two-hybrid system. This method involves the use of designed transcription factors (the hybrids) and reporter genes. Reporter genes are genes whose protein products have easily detected activities. Transcription factors are proteins that stimulate transcription. The transcription factors used in the yeast two-hybrid approach activate the reporters.The first of these to be used is the Ga l4 protein in the yeast S. cerevisiae. This protein stimulates transcription of the lacZ reporter gene that encodes the enzyme b-galactosidase, whose activity can be easily measured (assayed).
Ga l4, like many transcription factors, contains a DNA-binding domain and a transcription activation domain. (Transcription factors will be examined in detail in Chapter 16.) The modular organization of the Ga l4 protein is exploited to create a pair of hybrid proteins. One hybrid consists of the DNA-binding domain of Ga l4 fused to protein X. The other contains the activation domain of Ga l4 fused to protein Y. The two hybrids are reintroduced into the yeast cell. If protein X (the bait) interacts with protein Y (the prey) the Ga l4 DNA and activation domains will be brought into close proximity and the pair will be able to stimulate transcription of the reporter gene.
In the yeast two-hybrid method, different combinations of bait and prey are tested to identify interacting proteins. A common approach to carrying out large scale testing is to utilize two haploid yeast strains. One strain contains the bait and the other the prey. The strains are then mated and the interactions are determined by assaying the activity of the reporter gene in the diploid strain. This variant of the two-hybrid method is called interaction mating or mating assaying. It has been applied to several organisms whose genomes have been sequenced. For example, several hundred proteinprotein interactions have been identified in this manner in S. cerevisiae.
3.12DNA and Oligonucleotide Arrays Provide Information on Genes
One consequence of the work on complete genome sequences is the existence of libraries of genomes for many organisms. These libraries of DNA sequences form the basis for the newly developed microarray technologies. The physical basis for the microarray approaches is the complementary binding propensity of single-stranded nucleic acid sequences— nucleic acid bases preferentially bind to their complementary bases. A microarray is a glass slide containing single-stranded genetic material affixed in a regular grid. Each grid spot contains a single gene product that has been amplified (i.e., many copies made) in a polymerase chain reaction
(PCR). A sample set of mRNAs from a cell of interest is then washed over the array. These nucleic acids will bind (hybridize) to the cDNA counterparts immobilized in the array yielding a profile of the particular gene being expressed in the cell.

3.13 Gel Electrophoresis of Proteins |
63 |
In order to determine relative abundances the mRNA samples are labeled with a fluorescence dye. Typically, the sample of interest is labeled with a red fluorescent dye and there is a control sample that is labeled with a green fluorescent dye. By illuminating the spots with a laser and observing the color of the spot the relative abundances can be determined. Red would indicate a high abundance of the sample relative to the control, and green the opposite situation. Yellow would indicate equal abundances, and black a lack of hybridization by either sample or control at that spot.
DNA microarrays generate enormous amounts of data. They provide information on which sets of genes are expressed (and how strongly) at different times in the cell cycle and in response to which kinds of environmental stimuli. When interpreted and assembled into a regulatory model these kinds of data provide a molecular level explanation of how the cell or organism under study behaves.
3.13 Gel Electrophoresis of Proteins
Size and composition of protein complexes can be determined using oneand two-dimensional gel electrophoresis. In polyacrylamide gel electrophoresis, or SDS-PAGE, a polyacrylamide gel serves as an inert matrix over which proteins in a detergent solution migrate. Sodium dodecyl sulfate (SDS), the detergent, binds to hydrophobic portions of proteins causing then to unfold (denature) into extended chains, to dissociate from other proteins and lipid molecules, and for their subunits to unbind to each other. The large number of bound, negatively charged detergent molecules more than cancels any net positive charge on the protein. The overall negatively charged proteins migrate towards the positive electrode when a voltage is applied. The distance the protein moves is dependent upon the mass (size) of the protein, and so the proteins separate into bands arranged according to mass. The mass bands can then be analyzed to yield the protein masses and subunit composition.
In 2D gel electrophoresis, proteins are separated by both mass and charge. The proteins in the sample are again separated by a detergent, but this time the detergent is uncharged. The net charge on the now separated proteins is left unchanged. Recall that altering the pH of the solute will change the net charge on a protein, and proteins have an isoelectric point— the pH value at which the protein net change is zero. When electrophoresed in a gel in which a pH gradient has been applied the proteins will migrate to their individual isoelectric points and stop because at this point there is no force due to the electric field acting on the protein. When this procedure is followed with an SDS-PAGE procedure carried in a second direction orthogonal to that of the isoelectric focusing, the result is a set of proteins immobilized in a 2D gel separated by charge and mass.

64 3. Exploring Protein Structure and Function
3.14 Mass Spectroscopy of Proteins
Mass spectroscopy can be used to measure the masses of proteins, and to determine post-translational modifications. J.J. Thomson developed the mass spectrograph in the period from 1906 to 1913. He initially used his devices to study “canal rays,” positively charged ions produced in a cathode ray tube. He later used the mass spectrograph to measure the masses of a variety of atomic species, establishing their discrete character, and then by this means established the existence of isotopes of stable elements. A number of researchers, most notably Aston, Dempster, Bainbridge, Mattuach, and Nier in the 1920s and 1930s further developed the discipline of mass spectrometry in which combinations of electric and/or magnetic fields are used to filter, disperse, and separate charged particles according to their charge (z) to mass (M) ratios.
All mass spectrometers have three main components: an ion source, a mass analyzer, and an ion detector. The source is responsible for producing a beam of ionized particles of the material to be mass analyzed. The analyzer separates the beam ions according to their M/z values, and the detector is responsible for their detection. The main breakthrough that lead to the use of mass spectrometry in the study of proteins was the development of techniques for producing beams of charged gaseous proteins. Two techniques are widely used. The first is electrospray ionization (ESI) and the second is matrix-assisted laser desorption ionization (MALDI). These methods were introduced during the 1980s, and can be employed for biomolecules with masses up to 50 kDa (ESI) and more than 300 kDa (MALDI).
In a mass spectrometer, a beam of particles with charge z moves with velocity u. The ions are first subjected to an accelerating voltage V in an ionization chamber, and, as a result, attain kinetic energies equal to zV, where z is the charge of the ion. They are then sent through a magnetic field that is applied in a direction perpendicular to the direction of motion of the particles. The particles experience a force equal to zuB, where B is the magnetic field strength, which is balanced by the centrifugal force. By subjecting the beam of charged biomolecules to a magnetic field, various M/z values are scanned. The basic expression is
M z = r 2 B2 2V . |
(3.7) |
The voltage V is usually kept constant; the radius of curvature r is determined by the geometric properties of the magnet, and the user varies B to select different M/z ratios. In a further refinement of the technique, a pair of parallel electrodes can be added to the magnet. By adjusting the electric and magnetic fields according to the expression r = 2V/E, the velocity dependence can be removed so that all ionized proteins of a given M/z value fall on the same point in the focal plane of the detector.

References and Further Reading |
65 |
In still another approach, a time-of-flight (TOF) instrument can be devised in which differences in arrival times are used to measure masses. In a TOF system all ions are accelerated to the same kinetic energy, and the time of flight t is measured over the flight length L. The M/z value is then determined according to the formula:
M z = 2V(t L)2 . |
(3.8) |
Books on Protein Structure, X-Ray Crystallography, and NMR
Brandon C, and Tooze J [1999]. Introduction to Protein Structure, 2nd edition. New York: Garland Science Publishing.
Drenth J [1998]. Principles of Protein X-ray Crystallography. New York: SpringerVerlag.
Hore PJ [1995]. Nuclear Magnetic Resonance. Oxford: Oxford University Press. Levitt MH [2001]. Spin Dynamics: Basics of Nuclear Magnetic Resonance. New
York: John Wiley and Sons.
Rhodes G [2000]. Crystallography Made Crystal Clear: A Guide for Users of Macromolecular Models, 2nd edition. San Diego: Academic Press.
Woolfson MM [2001]. An Introduction to X-ray Crystallography. Cambridge: Cambridge University Press.
References and Further Reading
X-Ray Crystallography, Electron Crystallography, and NMR
Campbell ID, and Downing AK [1998]. NMR of modular proteins. Nat. Struct. Biol. (Suppl.), 5: 496–499.
Kühlbrandt W, and Wang DN [1991]. Three-dimensional structure of plant light-har- vesting complex determined by electron crystallography. Nature, 350: 130–134.
Unwin N [1993]. Nicotinic acetylcholine receptor at 9 Å resolution. J. Mol. Biol., 229: 1101–1124.
Unwin N [1995]. Acetylcholine receptor channel imaged in the open state. Nature, 373: 37–43.
Wilson KS [1998]. Illuminating crystallography. Nat. Struct. Biol. (Suppl.), 5: 627–630.
Fluorescence Resonance Energy Transfer
Bastiaens PIH, and Pepperkok R [2000]. Observing proteins in their natural habitat: The living cell. Trends Biochem. Sci., 25: 631–637.
Matz MV, et al. [1999]. Fluorescent proteins from nonbioluminescent Anthozoa species. Nat. Biotechnol., 17: 969–973.
Pollok BA, and Heim R [1999]. Using GFP in FRET-based applications. Trends in Cell Biol., 9: 57–60.
Weiss S [1999]. Fluorescence spectroscopy of single biomolecules. Science, 283: 1676–1683.

66 3. Exploring Protein Structure and Function
Circular Dichroism
Johnson WC [1990]. Protein secondary structure and circular dichroism: A practical guide. Proteins, 7: 205–214.
Woody RW [1995]. Circular dichroism. Methods in Enzymology, 246: 34–71.
Yeast Two-Hybrid System
Chien CT, et al. [1991]. The two-hybrid system: A method to identify and clone genes for proteins that interact with a protein of interest. Proc. Natl. Acad. Sci. USA, 88: 9578–9582.
Finley RL, Jr., and Brent R [1994]. Interaction mating reveals binary and ternary connections between Drosophila cell cycle regulators. Proc. Natl. Acad. Sci. USA, 91: 12980–12984.
Ito T, et al. [2001]. A comprehensive two-hybrid analysis to explore the yeast protein interactome. Proc. Natl. Acad. Sci. USA, 98: 4569–4574.
Uetz P, et al. [2000]. A comprehensive analysis of protein-protein interactions in
Saccharomyces cerevisiae. Nature, 403: 623–627.
Walhout AJM, et al. [2000]. Protein interaction mapping in C. elegans using proteins involved in vulval development. Science, 287: 116–122.
2D Gel Electrophoresis
Gygi SP, et al. [1999]. Quantitative analysis of complex protein mixtures using isotope-coded affinity tags. Nat. Biotechnol., 17: 994–999.
Mass Spectrometry
Link AJ, et al. [1999]. Direct analysis of protein complexes using mass spectrometry, Nat. Biotechnol., 17: 676–682.
Yates JR, 3rd [1998]. Mass spectrometry and the age of the proteome. J. Mass Spectrom., 33: 1–19.
Gene Fusion, Gene Expression Profiles, and Combined Methods
Enright AJ, et al. [1999]. Protein interaction maps for complete genomes based on gene fusion events. Nature, 402: 86–90.
Lockhart DJ, and Winzeler EA [2000]. Genomics, gene expression and DNA arrays. Nature, 405: 827–836.
Marcotte EM, et al. [1999a]. Detecting protein function and protein-protein interactions from genome sequences. Science, 285: 751–753.
Marcotte EM, et al. [1999b]. A combined algorithm for genome-wide prediction of protein function. Nature, 402: 83–86.
Pellegrini M, et al. [1999]. Assigning protein functions by comparative genome analysis: Protein phylogenetic profiles. Proc. Natl. Acad. Sci. USA, 96: 4285– 4288.
Schwekowski B, Uetz P, and Fields S [2000]. A network of protein-protein interactions in yeast. Nat. Biotechnol., 18: 1257–1261.
Young RA [2000]. Biomedical discovery with DNA arrays. Cell, 102: 9–15.
Problems 67
Problems
3.1(a) The emission of laser light at 440 nm for use in FRET was discussed in Section 3.10. What is the energy of these photons in (i) eV, and (ii) kcal/mol? (b) What is the energy of a 1.5 Å X-ray in these two sets of units? (c) What are the corresponding frequencies of the photons at 440 nm and 1.5 Å.
The following list of physical constants and conversion factors may be helpful:
Physical constants and conversion factors
Avogardo’s number N = 6.022 ¥ 1023/mol Velocity of light c = 2.9979 ¥ 1010 cm/s
Planck’s constant h = 6.626 ¥ 10-27 erg sec 1 eV = 1.6 ¥ 10-12 erg
1 cal = 4.184 joules .004 4.184 ¥ 107 ergs
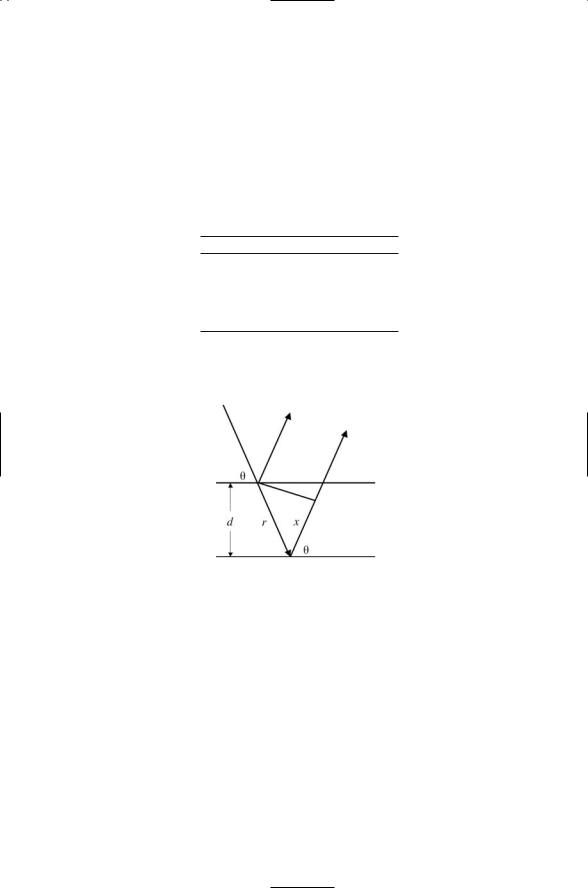
3.2 Using the figure shown below, derive Bragg’s law, Eq. (3.4).
Start with the relationship that the increase in path length between the two scattered rays shown in figure must be an integral multiple of the wavelength, that is, the waves must be in phase with one another in order to constructively interfere. In terms of the notation of the figure this condition is
r + x = nl .
Hint: Make use of the trigonometric identity:
2 sin2 q - 1 = cos (180 ∞ -2q).
3.3 Show that the nuclear magneton
mN = 5.05 ¥ 10 -27 J T .
T .
68 3. Exploring Protein Structure and Function
In the unit J/T, J denotes Joules and the symbol T denotes Tesla, the SI unit for B-fields. This quantity has dimensions of kilograms per second per second per ampere; that is 1 T = 1 kg s-2 amp-1. Use values for physical constants from the table in Problem 3.1 and the one shown below. (Note: The ampere is a unit of current; that is, 1 amp = 1 coulomb per second).
Physical constants and conversion factors
Charge on an electron e = 1.6 ¥ 10-19 coulombs
Mass of a proton Mp = 1.672 ¥ 10-27 kg
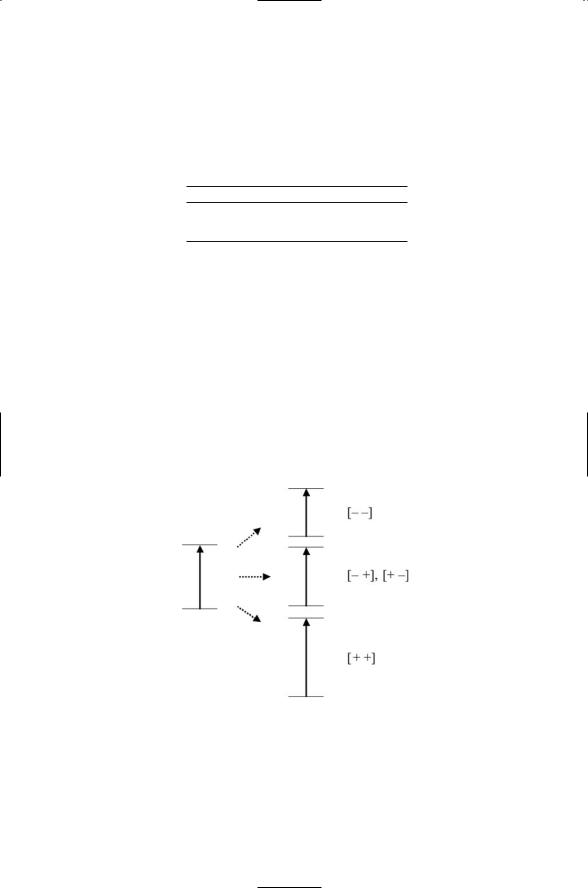
3.4Recall from Figure 3.7 that the CH2 group splits the single peak for the hydrogen atoms in CH3 into three peaks, and the CH3 group splits the single hydrogen peak for CH2 into four peaks. In the figure shown below, the spin-spin effect of the CH2 group on the CH3 group is shown. The two hydrogen atoms in CH2 can each have their spins either aligned with the external field (+) or have their spins aligned opposite (-). When opposite they shield the magnetic field and reduce the splitting, while aligned they add to the field and increase the splitting. There are three different spin-spin combinations: both negative, one positive and one negative, and both positive. This gives rise to the three peaks. Since there are two ways of arriving at a [+, -] combination and once each for the others the peak intensities are in a 1 : 2 : 1 ratio as illustrated in Figure 3.7.
(a) In this problem, write down the possible spin combinations for the
CH3 group that splits the peak for CH2 into four peaks shown in Figure 3.7, and give the ratios of the peak heights. (b) From the results for two and three hydrogens, infer the splittings of a hydrogen peak produced by four nearby hydrogen atoms. How would their peak heights vary?

Problems 69
3.5Recall from the discussion on mass spectrometers that the beams of charged particles are subjected to first an accelerating voltage allowing the particle to attain a kinetic energy equal to
zV = mu2 2 .
2 .
When the particles feel the magnetic field the force zuB is exactly balanced by the centrifugal force:
zuB = mu2 r .
r .
(a) From these two relationships derive Eq. (3.7). (b) Then derive the time-of-flight expression given by Eq. (3.8).

4
Macromolecular Forces
Ordinary polymers such as rubber are constructed as repetitive sequences of a small number of basic units. In contrast, proteins are synthesized as nonrepetitive sequences of the 20 different amino acids. Each kind of amino acid has a different side chain, and the variations in side chains endow each amino acid with a distinct set of physical and chemical properties.The amino acid compositions of proteins are not randomly selected. Instead, amino acid sequences are selected to allow the proteins to fold into compact threedimensional forms in physiologically meaningful time periods, with specific binding properties that enable the proteins to carry out their cellular tasks.
Macromolecular forces—mixtures of covalent and noncovalent forces generated by the electron clouds surrounding the atomic nuclei—hold protein together. The starting point in understanding how proteins signal one another is to understand the physical properties of the amino acids and the macromolecular forces that hold biomolecules together. One question that one would like to answer is How do amino acids pack together? Another is How do the macromolecular forces and amino acid geometry shape the proteins? How do they guide their interactions with one another, and with lipids, carbohydrates, DNA, and RNA? The goal of this chapter is to begin to answer these questions and others like them. Amino acid composition and organization in proteins will be looked at along with macromolecular forces holding the proteins together and mediating their interactions with one another through their interfaces. This exploration will continue into the next chapter, where the problem of how a protein folds, one of the most enduring and distinguished problems in all of science, will be explored.
4.1 Amino Acids Vary in Size and Shape
Amino acid side chains vary considerably in length and mass. The smallest amino acid is glycine. Its side chain consists of a single hydrogen atom. The next smallest amino acid is alanine with a CH3 group as its side chain. The
71