APLA
MEDICAL
USMLE™. Step 1
Physiology
Lecture Notes
BK4030J |
*USMLE™ is a joint program of the Federation of State Medical Boards of the United States and the National Board of Medical Examiners. |

©2013 Kaplan, Inc.
Allrights reserved. No part ofthis book may be reproduced in any form, by photostat, microfilm, xerography or any other means, or incorporated into any information retrieval system, electronic or mechanical, without the written permission of Kaplan, Inc.
Not for resale.
Authors
L.Britt Wilson, Ph.D.
Associate Professor
Department of Pharmacology, Physiology, and Neuroscience
University of South Carolina School of Medicine
Columbia, SC
Raj Dasgupta M.D., F.A.C.P., F.C.C.P.
Assistant Professor of Clinical Medicine
Department of Medicine, Division of Pulmonary, Critical Care and Sleep Medicine Keck School of Medicine of USC, University of Southern California
Los Angeles, CA
Conrad Fischer, M.D.
Associate Professor of Medicine
Associate Professor of Physiology
Associate Professor of Pharmacology
Touro College of Medicine
New York, NY
Frank P. Noto, M.D.
Assistant Professor of Internal Medicine
Site Director, Internal Medicine Clerkship and Sub-Internship
Icahn School of Medicine at Mount Sinai
New York, NY
Hospitalist
Elmhurst Hospital Center
Queens, NY
Contributors
Wazir Kudrath, M.D.
Kaplan Faculty
Chris Paras, D.O.
Kaplan Faculty

Contents
Preface . . . . . . . . . . . . . . . . . . . . . . . . . . . . . . . . . . . . . . . . . . . . . . . . . . . . . . vii
Section I: Fluid Distribution and Edema
Chapter 1: Fluid Distribution and Edema . .. . . . . . . . . . . . . . . . . . . . . . . . 3
Section II: ExcitableTissue
Chapter 1: Ionic Equilibrium and Resting Membrane Potential. . ...... 19
Chapter 2: The Neuron Action Potential and Synaptic Transmission. . .. . . 27
Chapter 3: Electrical Activity of the Heart ......................... |
37 |
SectionIll: Skeletal Muscle
Chapter 1: Excitation-Contraction Coupling . . . . . . . . . . . . . .. . . . . . . . . 55
Chapter 2: Skeletal Muscle Mechanics. . . . . . . . . . .. . . . . . . . . . . . . . . .. 65
SectionIV: CardiacMuscle Mechanics |
|
Chapter 1: Cardiac Muscle Mechanics. . . . . . . . . . . . . .. . . . . . . . . . . . . |
. 73 |
Section V: Peripheral Circulation |
|
Chapter 1: General Aspects of the Cardiovascular System . . . . . . . . . . . |
85 |
Chapter 2: Regulation of Blood Flow and Pressure . .. . ............ |
107 |
SectionVI: Cardiac Cycle andValvular Heart Disease |
|
Chapter 1: Cardiac Cycle and Valvular Heart Disease . ............. |
121 |
SectionVII: Respiration |
|
Chapter 1: Lung Mechanics . ............. . ............... . .... |
135 |
Chapter 2: Alveolar-Blood Gas Exchange . . . . . . . . .. . . . . . . . . . . . .. . |
159 |
Chapter 3: Transport of 02 and C02 and the Regulation of Ventilation . . |
167 |
Chapter 4: Causes and Evaluation of Hypoxemia. . . . .. . . . . . . . . . . . . |
179 |
MEDICAL V
Section VIII: Renal Physiology |
|
Chapter 1: Renal Structure and Glomerular Filtration . . . . . . . . . . . . . . |
193 |
Chapter 2: Solute Transport: Reabsorption and Secretion. . . . . . . . . . . |
207 |
Chapter 3: Clinical Estimation of GFR and Patterns of Clearance . . . . . |
219 |
Chapter 4: Regional Transport . . . . . . . . . . . . . . . . . . . . . . . . . . . . . . . . . |
225 |
Section IX: Acid-Base Disturbances |
|
Chapter 1: Acid-Base Disturbances . . . . . . . . . . . . . . . . . . . . . . . . . . . . . |
243 |
Section X: Endocrinology |
|
Chapter 1: General Aspects of the Endocrine System . . . . . . . . . . . . . . |
259 |
Chapter 2: Hypothalamic-Anterior Pituitary System . . . . . . . . . . . . . . . . |
265 |
Chapter 3: Posterior Pituitary . . . . . . . . . . . . . . . . . . . . . . . . . . . . . . . . . . |
269 |
Chapter 4: Adrenal Cortex . . . . . . . . . . . . . . . . . . . . . . . . . . . . . . . . . . . . |
277 |
Chapter 5: Adrenal Medulla . . . . . . . . . . . . . . . . . . . . . . . . . . . . . . . . . . . |
305 |
Chapter 6: Endocrine Pancreas . . . . . . . . . . . . . . . . . . . . . . . . . . . . . . . . |
309 |
Chapter 7: Hormonal Control of Calcium and Phosphate . . . . . . . . . . . |
325 |
Chapter 8: Thyroid Hormones . . . . . . . . . . . . . . . . . . . . . . . . . . . . . . . . . |
337 |
Chapter 9: Growth, Growth Hormone and Puberty . . . . . . . . . . . . . . . . |
353 |
Chapter 10: Male Reproductive System . . . . . . . . . . . . . . . . . . . . . . . . . . |
359 |
Chapter 11: Female Reproductive System . . . . . . . . . . . . . . . . . . . . . . . . |
367 |
Section XI: Gastrointestinal Physiology
Chapter 1: Gastrointestinal Physiology . . . . . . . . . . . . . . . . . . . . . . . . . . 387
Index . . . . . . . . . . . . . . . . . . . . . . . . . . . . . . . . . . . . . . . . . . . . . . . . . . . . . . . . . . . . . 409
Vi MEDICAL
Preface
These 7 volumes of Lecture Notes represent the most-likely-to-be-tested material on the current USMLE Step 1 exam. Please note that these are Lecture Notes, not re view books. The Notes were designed to be accompaniedby facultylectures-live, on video, or on the web. Reading them without accessing the accompanying lectures is not an effective way to review for the USMLE.
To maximize the effectiveness of these Notes, annotate them as you listen to lectures. To facilitate this process, we've created wide, blank margins. While these margins are occasionally punctuated by faculty high-yield "margin notes:' they are, for the most part, left blank for your notations.
Many students find that previewing the Notes prior to the lecture is a very effective way to prepare for class. This allows you to anticipate the areas where you'll need to pay particular attention. It also affords you the opportunity to map out how the in formation is going to be presented and what sort of study aids (charts, diagrams, etc.) you might want to add. This strategy works regardless of whether you're attending a live lecture or watching one on video or the web.
Finally, we want to hear what you think. What do you like about the Notes? What could beimproved? Please share your feedback by e-mailing us at medfeedback@kaplan.com.
Thank you for joining Kaplan Medical, and best of luck on your Step 1 exam!
Kaplan Medical
MEDICAL |
Vii |

SECTION
Fluid Distribution
and Edema
Section I • Fluid Distribution and Edema
Explanations
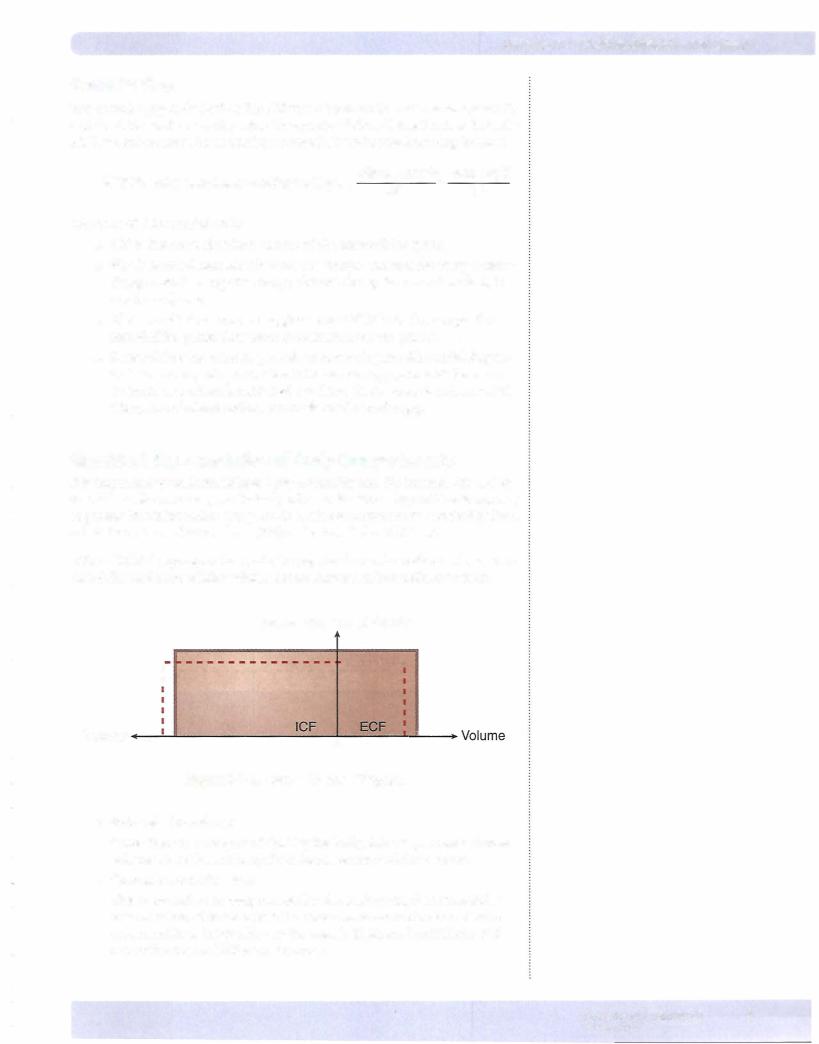
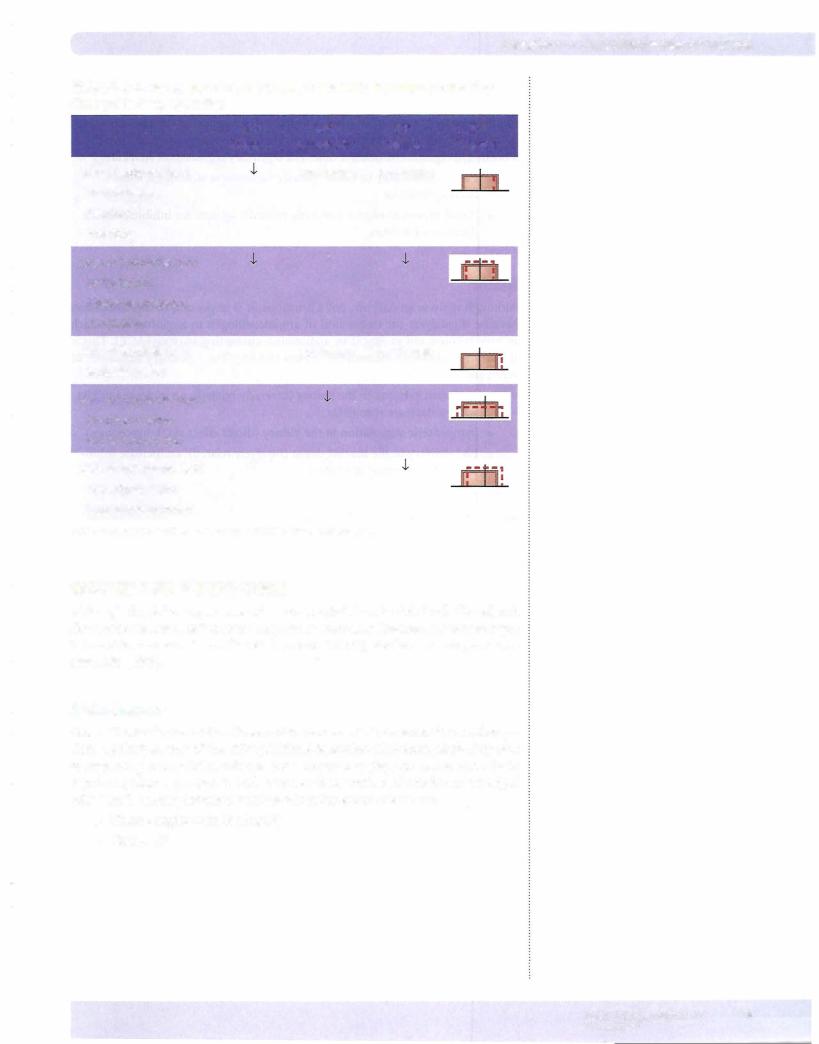
Figure 1-1-5: Patient shows loss ofextracellular volume with no change in osmo lality. Since extracellular osmolality is the same, then intracellular volume is un changed. This represents an isotonic fluid loss (equal loss offluid and osmoles).
Possible causes are hemorrhage, isotonic urine, or the immediate consequences ofdiarrhea or vomiting.
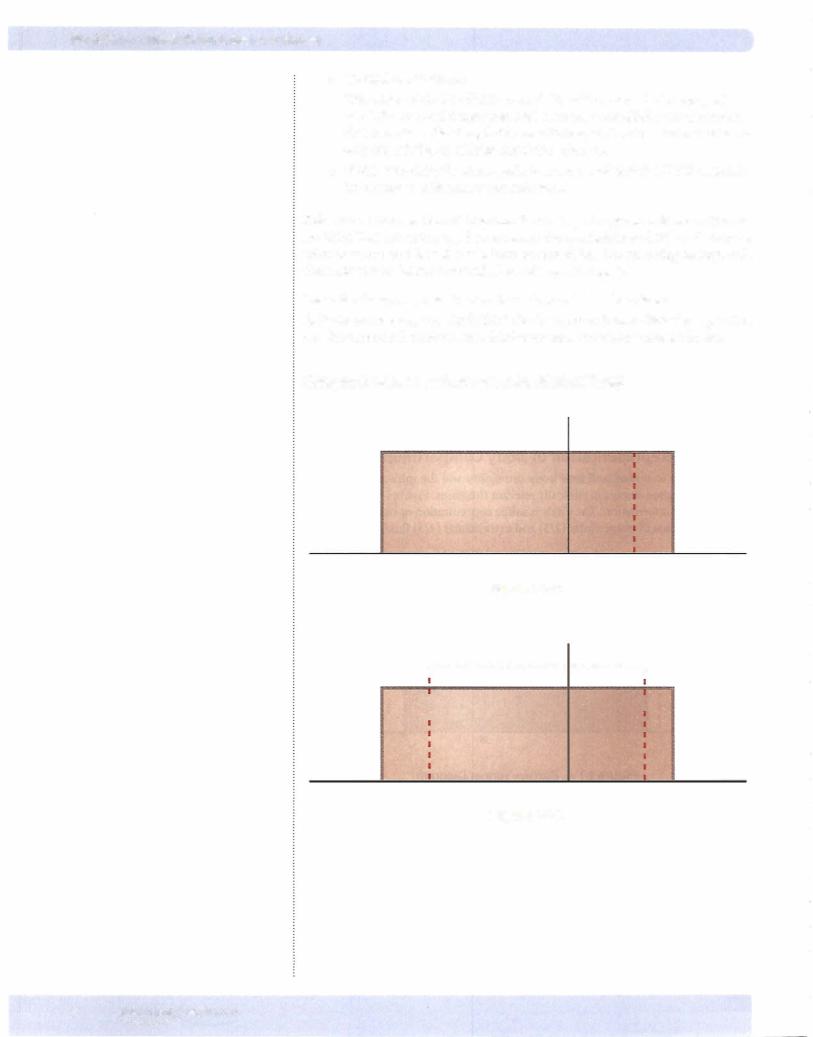
Figure 1-1-6: Patientshowsloss ofextracellularand intracellular volume with rise in osmolality. Thisrepresents a netloss ofwater (greater loss ofwater than osmoles).
Possiblecausesare inadequatewaterintakeor sweating. Pathologically, thiscould be hypotonic water loss from the urine resulting from diabetes insipidus.
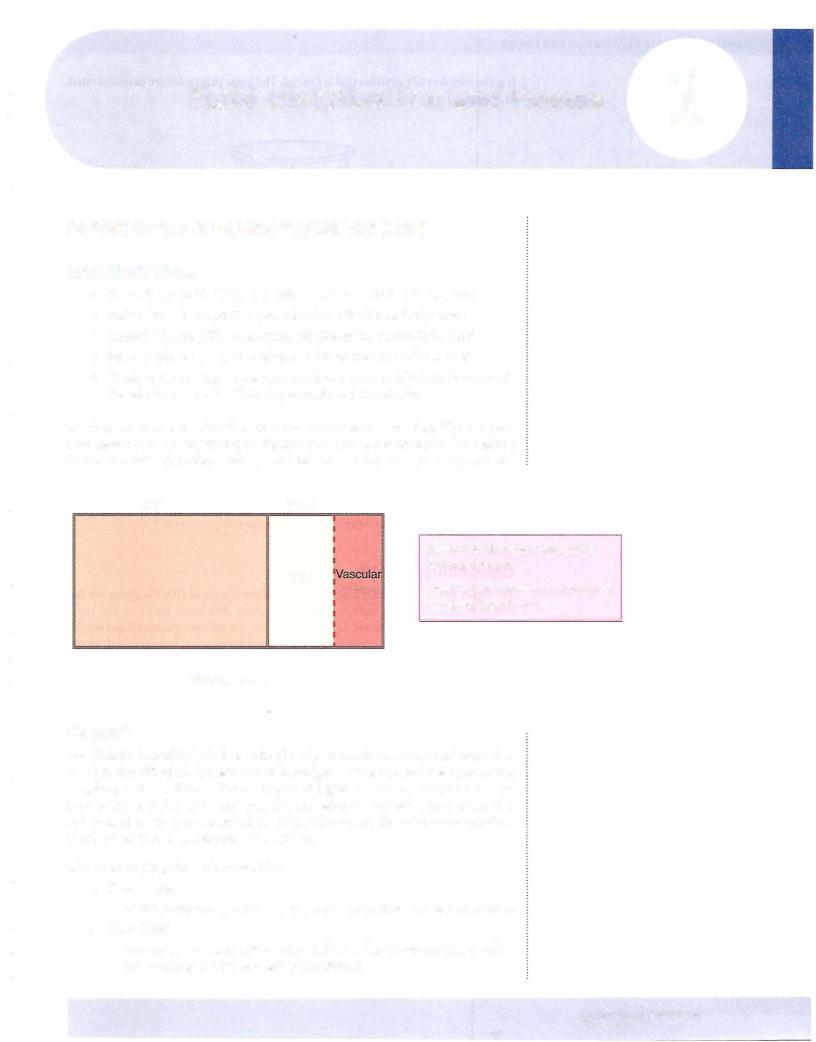
Figure 1-1-7: Patient shows gain of extracellular volume, increase in osmolal ity, and a decrease in intracellular volume. The rise in osmolality shifted water out ofthe cell. This represents a net gain of solute (increase in osmoles greater than increase in water). Possible causes are ingestion ofsalt, hypertonic infusion of solutes that distribute extracellularly (saline, mannitol), or hypertonic infu sion ofcolloids. Colloids, e.g. dextran, don't readily cross the capillary membrane and thus expand the vascular compartment only (vascular is part ofextracellular compartment).
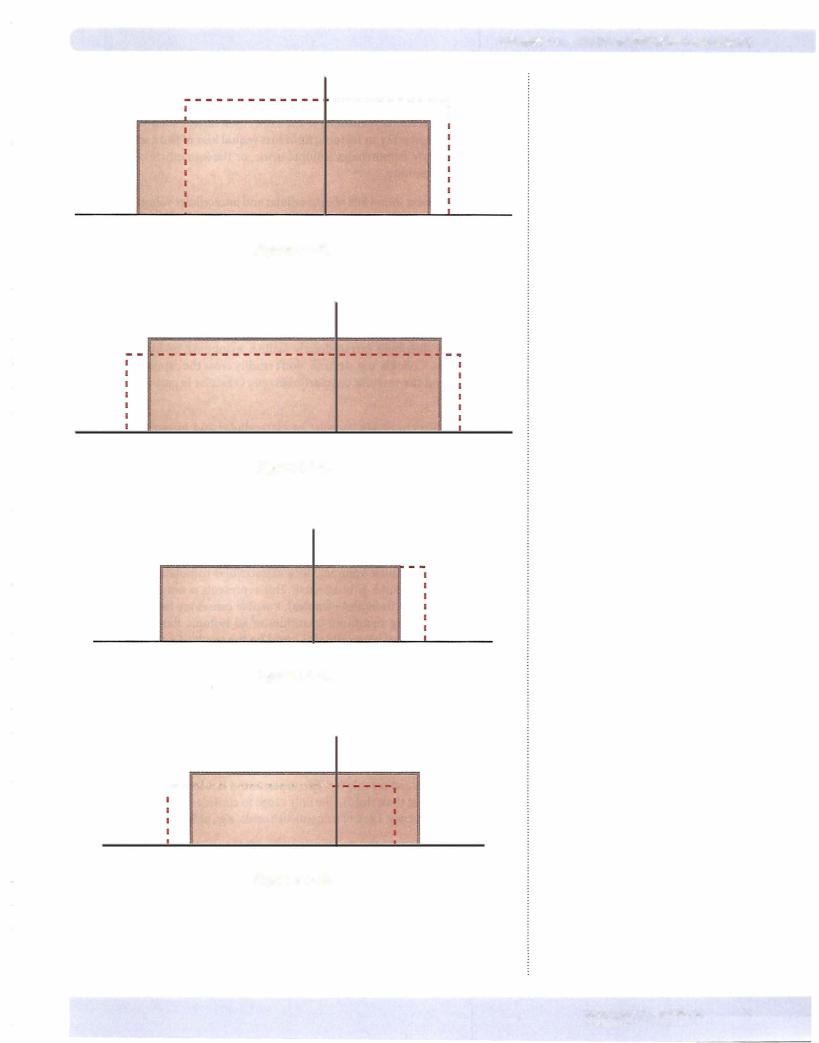
Figure 1-1-8: Patient shows increase in extracellular and intracellular volumes with a decrease in osmolality. The fall in osmolality shifted water into the cell. Thus, this represents net gain of water (more water than osmoles). Possible causes are drinking significant quantities of water (could be pathologic primary polydipsia), drinking significant quantities of a hypotonic fluid, or a hypotonic fluid infusion (saline, dextrose in water). Pathologically this could be abnormal water retention such as that which occurs with syndrome ofinappropriate ADH.
Figure 1-1-9: Patient shows increase in extracellular volume with no change in osmolality or intracellular volume. Since extracellular osmolality didn't change, then intracellular volume is unaffected. This represents a net gain of isotonic fluid (equal increase fluid and osmoles). Possible causes are isotonic fluid infu sion (saline), drinking significant quantities of an isotonic fluid, or infusion of an isotonic colloid. Pathologically this could be the result of excess aldosterone. Aldosterone is a steroid hormone that causes Na+ retention by the kidney. At first glance one would predict excess Na+ retention by aldosterone would increase the concentration of Na+ in the extracellular compartment. However, this is rarely the case because water follows Na+, and even though the total body mass ofNa+ increases, its concentration doesn't.
Figure 1-1-10: Patient shows decrease in extracellular volume and osmolality with an increase in intracellular volume. The rise in intracellular volume is the result ofthe decreased osmolality. This represents a net loss of hypertonic fluid (more osmoles lost than fluid). The only cause to consider is the pathologic state ofadrenal insufficiency. Lack ofmineralcorticoids, e.g., aldosterone causes excess Na+ loss.
8MEDICAL

Section I • Fluid Distribution and Edema
ADH (AVP)
ADHstimulates water reabsorption in principal cells of thekidney viatheV2 recep tor. By regulating water, ADH plays a pivotal role in regulating extracellular osmo lality. In addition,ADH vasoconstricts arterioles (V1 receptor) and thus can serve as a hormonal regulator of vascular tone. The 2 primary regulators of ADH are:
•Plasma osmolality (directly related): an increase stimulates, while a decrease inhibits
•Blood pressure/volume (inversely related): an increase inhibits, while a decrease stimulates
Renin
Although renin is an enzyme, not a hormone, it is important in this discussion because it catalyzes the conversion of angiotensinogen to angiotensin I, which in turn is converted to Ang II by angiotensin converting enzyme (ACE). This is the renin-angiotensin-aldosterone system (RAAS). The 3 primary regulators of renm are:
•Perfusion pressure to the kidney (inversely related): an increase inhibits, while a decrease stimulates
•Sympathetic stimulation to the kidney (direct effect via 13-1 receptors)
•Na+ delivery to the macula densa (inversely related): an increase inhib its, while a decrease stimulates
Negative Feedback Regulation
Examining the function and regulation of these hormones one should see the feedback regulation. For example, aldosterone increases sodium reabsorption, which in turn increases extracellular volume. Renin is stimulated by reduced blood pressure (perfusion pressure to the kidney; reflex sympathetic stimula tion). Thus, aldosterone is released as a means to compensate for the fall in arte rial blood pressure. As indicated, these hormones are covered in more detail later in this book.
Application
Given the above, you are encouraged to review the previous Darrow-Yannet dia grams and predict what would happen to levels of each hormone in the various conditions. Answers are provided below.
Figure 1-1-5: Loss of extracellular volume stimulates RAAS and ADH.
Figure 1-1-6: Decreased extracellular volume stimulates RAAS. This drop in extracellular volume stimulates ADH, as does the rise osmolarity. This setting would be a strong stimulus for ADH.
Figure 1-1-7: The rise in extracellular volume inhibits RAAS. It is difficult to pre dict what willhappen to ADH in this setting. The rise in extracellular volume inhibits, but the rise in osmolality stimulates, thus it willdepend upon the mag nitude of the changes. In general, osmolality is a more important factor, but sig nificant changes in vascular volume/pressure can exert profound effects.
10 MEDICAL
Section I • Fluid Distribution and Edema
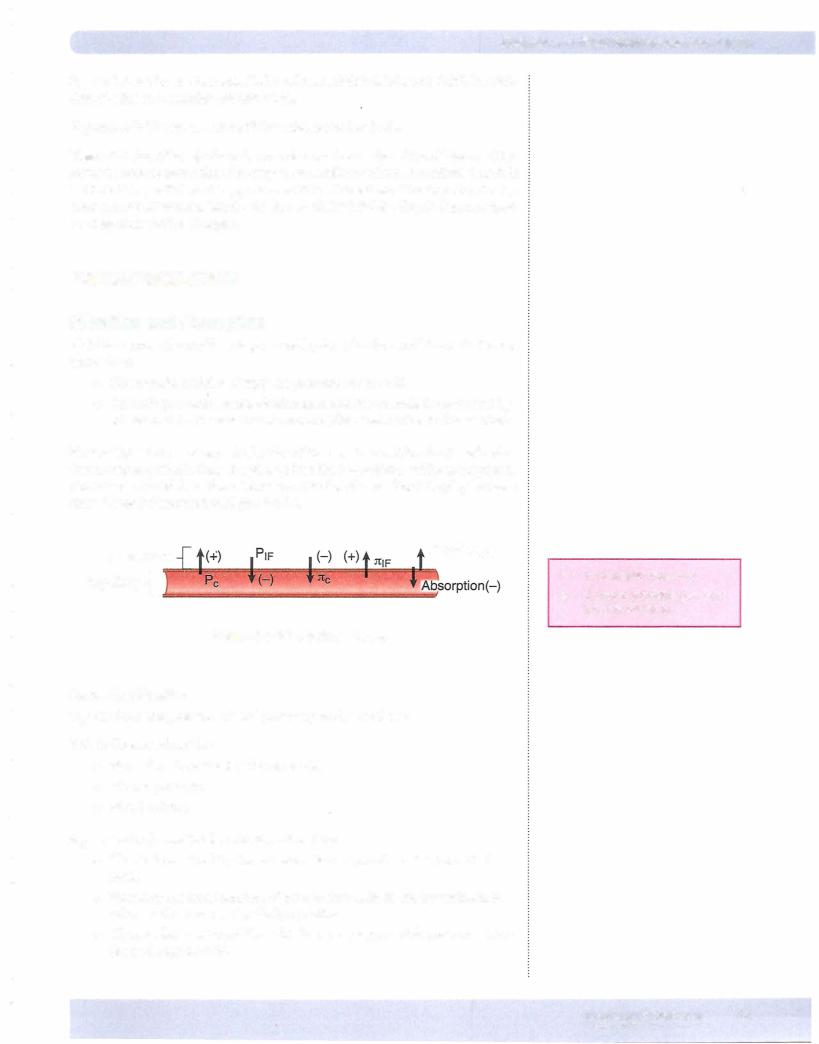
Forcesfor absorption
1tc = oncotic (osmotic) pressure ofplasma
•This is the oncotic pressure of plasma solutes that cannot diffuse across the capillary membrane, i.e., the plasma proteins.
•Albumin, synthesized in the liver, is the most abundant plasma protein and thus the biggest contributor to this force.
PIF = hydrostatic pressure in the interstitium
•This pressure is difficult to determine.
•In most cases it is close to zero or negative {subatmospheric) and is not a significant factor affecting filtration versus reabsorption.
•However, it can become significant if edema is present or it can affect glomerular filtration in the kidney (pressure in Bowman's space is anal ogous to interstitial pressure).
Starling Equation
These 4 forces are often referred to as Starling forces. Grouping the forces into those that favor filtration and those that oppose it, and taking into account the properties of the barrier to filtration, the formula for fluid exchangeis the following:
Qf = fluid movement
k = filtration coefficient
The filtration coefficient depends upon a number of factors but for our purposes permeabilityis mostimportant As indicatedbelow,a variety of factors can increase permeability of the capillary resulting in a large flux of fluid from the capillary into the interstitial space.
A positive value of Qf indicates net filtration; a negative value indicates net ab sorption. In some tissues (e.g., renal glomerulus), filtration occurs along the entire length of the capillary; in others (intestinal mucosa), absorption normally occurs along the whole length. In other tissues, filtration may occur at the proximal end until the forces equilibrate.
Lymphatics
The lymphatics play a pivotal role in maintaining a low interstitial fluid volume and protein content. Lymphatic flow is directly proportional to interstitial fluid pressure, thus a rise in this pressure promotes fluid movement out of the intersti tium via the lymphatics.
The lymphatics also remove proteins from the interstitium. Recall that the lymphatics return their fluid and protein content to the general circulation by coalescing into the lymphatic ducts, which in turn empty into to the subcla vian veins.
12 MEDICAL
Chapter 1 • Fluid Distribution and Edema
Questions
1.Given the following values, calculate a net pressure: Pc=25mmHg
P1F = 2 mmHg nc=20 mmHg nIF=1 mmHg
2.Calculate a net pressure ifthe interstitial hydrostatic pressure is -2 mmHg.
Answers
1.+4 mmHg
2.+8mmHg
EDEMA {PATHOLOGY INTEGRATION)
Edema is the accumulation of fluid in the interstitial space. It expresses itself in peripheral tissues in 2 different forms:
•Pitting edema: In this type of edema, pressing the affected area with a finger or thumb results in a visual indentation ofthe skin that persists for some time after the digit is removed. This is the "classic;' most common type observed clinically. It generally responds well to diuretic therapy.
•Non-pitting edema: As the name implies, a persistent visual indentation is absent when pressing the affected area. This occurs when interstitial oncotic forces are elevated (proteins for example). This type of edema does not respond well to diuretic therapy.
Primary Causes of Peripheral Edema
Significant alterations in the Starling forces which then tip the balance toward filtration, increase capillary permeability (k), and/or interrupted lymphatic function can result in edema. Thus:
•Increased capillary hydrostatic pressure (Pc): causes can include the following:
-Marked increase in blood flow, e.g., vasodilation in a given vascular bed
-Increasing venous pressure, e.g., venous obstruction or heart failure
-Elevated blood volume (typically the result of Na+ retention), e.g., heart failure
•Increased interstitial oncotic pressure (ItrF): primary cause is thyroid dysfunction (elevated mucopolysaccharides in the interstitium)
-These act as osmotic agents resulting in fluid accumulation and a non-pitting edema. Lymphedema (see below) can also increase 1trF
•Decreased vascular oncoticpressure (nc): causes can include the following:
Liver failure
-Nephrotic syndrome
MEDICAL 13
Section I • Fluid Distribution and Edema
•Increased capillary permeability (k): Circulating agents, e.g., tumor necrosis factor alpha (TNF-alpha), bradykinin, histamine, cytokines related to burn trauma, etc., increase fluid (and possibly protein) filtra tion resulting in edema.
•Lymphatic obstruction/removal (lymphedema): causes can include the following:
Filarial (W. bancrofti-elephantitis)
Bacterial lymphangitis (streptococci)
Trauma
-Surgery
-Tumor
Given that one function of the lymphatics is to clear interstitial proteins, lymphedema can produce a non-pitting edema because of the rise in 1t1p
Pulmonary Edema
Edema in the interstitium ofthe lung can result in grave consequences. It can in terfere with gas exchange, thus causing hypoxemia and hypercapnia (see Respira tion section). A low hydrostatic pressure in pulmonary capillaries and lymphatic drainage helps "protect" the lungs against edema.However, similar to peripheral edema, alterations in Starling forces, capillary permeability, and/or lymphatic blockage can result in pulmonary edema. The most common causes relate to el evated capillary hydrostatic pressure and increased capillary permeability.
• Cardiogenic (elevated Pc)
Most common form of pulmonary edema
Increased left atrial pressure, increases venous pressure, which in turn increases capillary pressure
Initially increased lymph flow reduces interstitial proteins and is pro tective
First patient sign is often orthopnea (dyspnea when supine), which can be relieved when sitting upright
Elevated pulmonary wedge pressure provides confirmation Treatment: reduce left atrial pressure, e.g., diuretic therapy
•Non-cardiogenic (increased permeability): adult respiratory distress syndrome (ARDS)
Due to direct injury of the alveolar epithelium or after a primary injury to the capillary endothelium
Clinical signs are severe dyspnea of rapid onset, hypoxemia, and dif fuse pulmonary infiltrates leading to respiratory failure
Most common causes are sepsis, bacterial pneumonia, trauma, and gastric aspirations
Fluid accumulation as a result of the loss of epithelial integrity
Presence of protein-containing fluid in the alveoli inactivates surfac tant causing reduced lung compliance
Pulmonary wedge pressure is normal or low
14 MEDICAL

Section I • Fluid Distribution and Edema
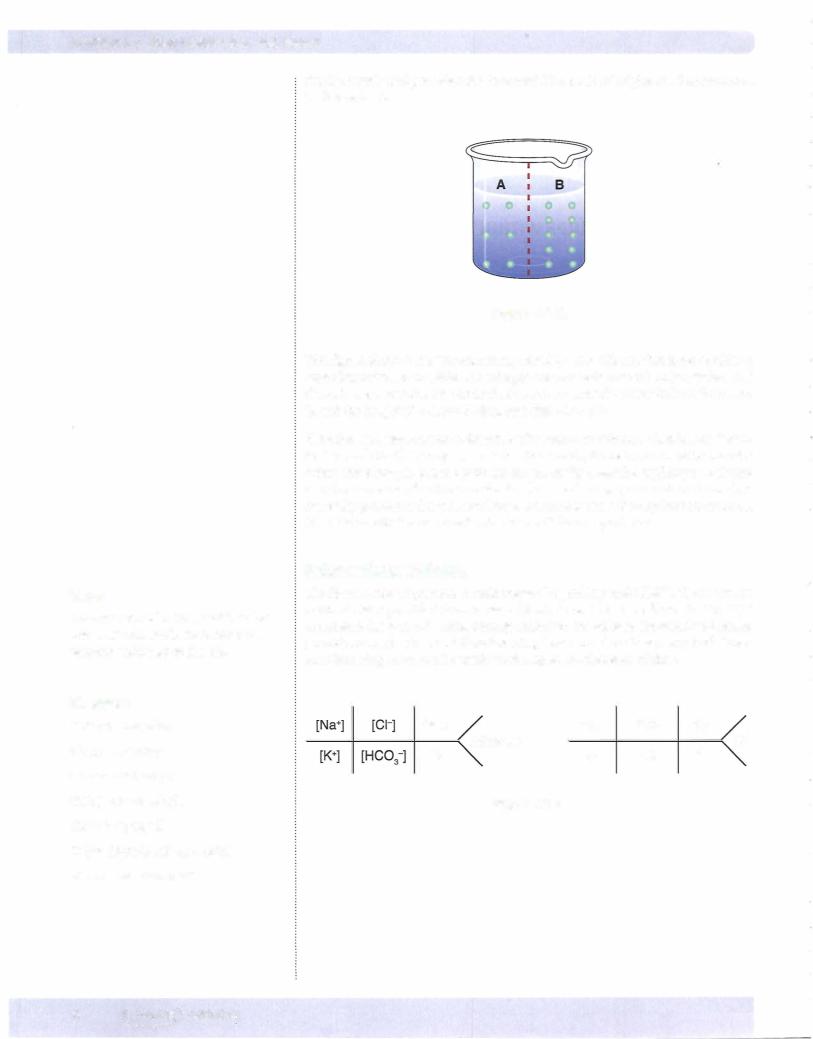
The distribution of intravenously administered fluids is as follows:
•Vascular compartment: whole blood, plasma, dextran in saline
•ECF: saline, mannitol
•Total body water: DSW-5% dextrose in water
- Once the glucose is metabolized, the water distributes 2/3 ICF, 1/3 ECF
Chapter Summary
•ECF/ICFfluid distribution is determined by osmotic forces.
•ECFsodium creates most of the ECFosmotic force because it is the most prevalent dissolved substance in the ECFthat does not penetrate the cell membrane easily.
•The BMP represents the plasma levels of 7 important solutes and is a commonly obtained plasma sample.
•If ECFsodium concentration increases, ICFvolume decreases. If ECFsodium concentration decreases, ICFvolume increases. Normal extracellular osmolality is about 290 mOsm/kg (osmolarity of 290 mOsm/L).
•Vascular/interstitial fluid distribution is determined by osmotic and hydrostatic forces (Starling forces).
•The main factor promoting filtration is capillary hydrostatic pressure.
•The main factor promoting absorption is the plasma protein osmotic force.
•Pitting edema is the result of altered Starling forces and/or lymphatic obstruction.
•Non-pitting edema results from lymphatic obstruction and/or the accumulation of osmotically active solutes in the interstitial space (thyroid).
•Pulmonary edema can be cardiogenic (pressure induced) or non-cardiogenic (permeability induced).
16 MEDICAL

SECTION
Excitable Tissue
Ionic Equilibrium and |
1 |
Resting Membrane Potential |
|
OVERVIEW OF EXCITABLE TISSUE
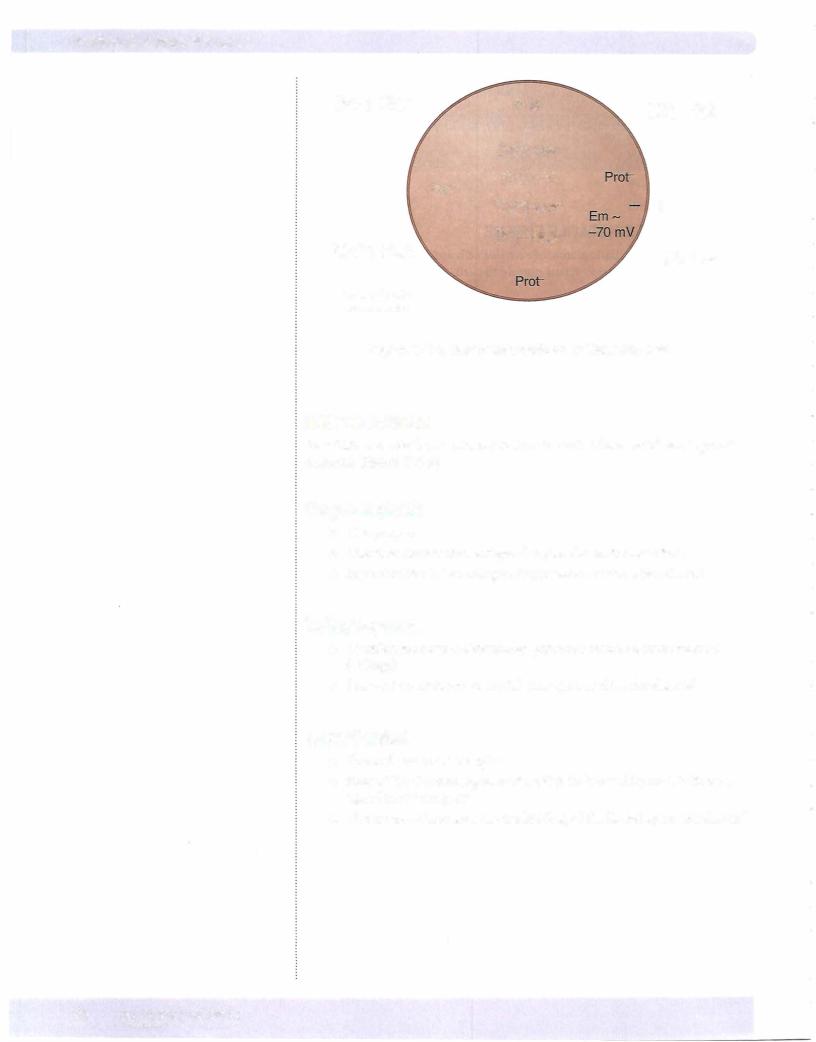
Figure II-1-1 provides a basic picture of excitable cells and the relative concentra tion of key electrolytes inside versus outside the cell. The intracellular proteins have a negative charge.
In order to understand and apply what governs the conductance of ions as it relates to the function of excitable tissue (nerves and muscle), it is important to remember this relative difference in concentrations for these ions. In addition, it is imperative to understand the following 5 key principles.
1.Membrane potential (Em)
•There is a separation of charge across the membrane of excitability tis sue at rest. This separation of charge means there is the potential to do work and is measured in volts. Thus, Em represents the measured value.
2.Electrochemical gradient
•Ions diffuse based upon chemical (concentration) gradients (high to low) and electrical gradients (like charges repel, opposites attract). Electrochemical gradient indicates the combination of these 2 forces.
3.Equilibrium potential
•This is the membrane potential that puts an ion in electrochemical equi librium, i.e., the membrane potential that results in no NET diffusion of an ion. If reached, the tendency for an ion to diffuse in one direction based upon the chemical gradient is countered by the electrical force in the opposite direction. The equilibrium potential for any ion can be cal culated by the Nernst equation (see below).
4.Conductance (g)
•Conductance refers to the flow of an ion across the cell membrane. Ions move across the membrane via channels (see below). Open/closed states of channels determine the relative permeability of the membrane to a given ion and thus the conductance. Open states create high permeabil ity and conductance, while closed states result in low permeability and conductance.
5.Net force (driving force)
•This indicates the relative "force" driving the diffusion of an ion. It is estimated by subtracting the ions equilibrium potential from the cell's membrane potential. In short, it quantitates how far a given ion is from equilibrium at any membrane potential.
MEDICAL 19
Section II • Excitable Tissue
[Na+]-High Prof-
[Na+]-Low
[Cl-]-Low
Prot-
[Ca2+]-Low*
[K+]-High
[Ca2+]-High
*free cytosolic concentration
[Cl-]-High
+
[K+]-Low
Figure 11-1-1. Basic Schematic of an Excitable Cell
ION CHANNELS
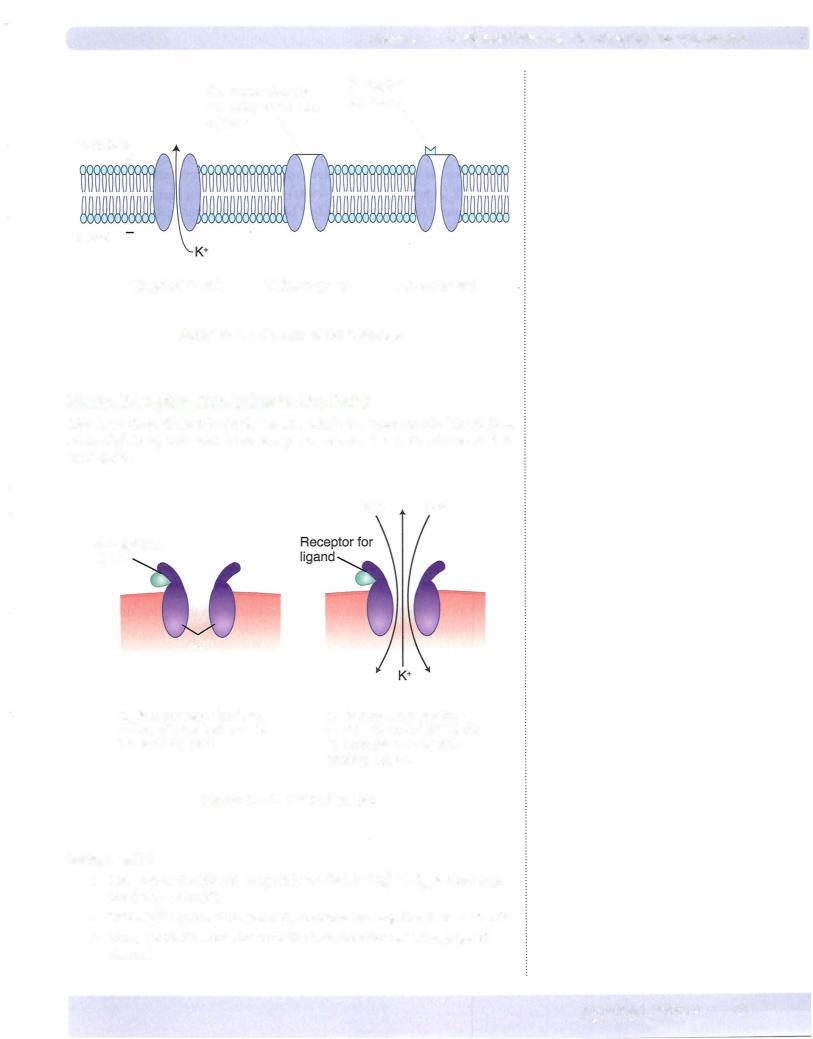
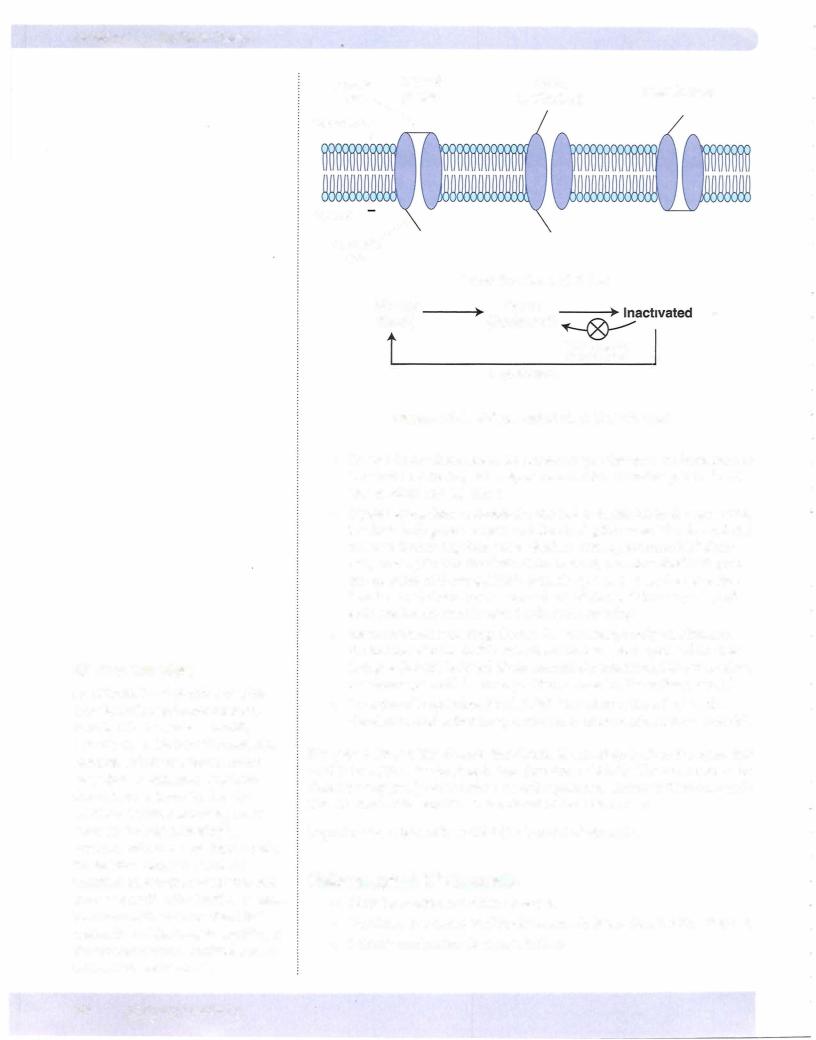
Ions diffuse across the membrane via ion channels. There are 3 basic types ofion channels (Figure II-1-2).
Ungated (leak)
•Always open
•Direction the ion moves depends upon electrochemical forces
•Important for determining resting membrane potential of a cell
Voltage-gated
•Open/closed state is determined primarily by membrane potential (voltage)
•Change in membrane potential may open or close the channel
Ligand-gated
•Channel contains a receptor
•State of the channel (open or closed) is influenced by the binding of a ligand to the receptor
•Under most circumstances, the binding of the ligand opens the channel
20 MEDICAL
Chapter 1 • Ionic Equilibrium and Resting Membrane Potential
|
Gate: open/closed |
Receptor |
|
|
for ligand |
||
|
state dependent on |
||
|
|
||
Extracellular |
voltage |
\ |
\ |
+
Cytosol
Ungated (leak) |
Voltage-gated |
Ligand-gated |
Figure 11-1-2. Classes of Ion Channels
NMDA Receptor (Exception to the Rule)
Above, we defined the 3 basic classes into which ion channels fallThe. NMDA (N-methyl-D-aspartic acid) is an exception because it is both voltageand li gand-gated.
Na• Ca2•
Receptor for ligand
Mg2•
Em is more negative than - -70 mV, thus channel is blocked by Mg2•.
Em is less negative than - -70 mV, thus Mg2•block is removed and ligand binding opens.
Figure 11-1-3. NMDA Receptor
Voltage-gated
•The pore of the NMDA receptor is blocked by Mg2+ if Em is more nega tive than - -70 mV.
•This Mg2+ block is removed ifEm becomes less negative than - -70 mV.
•Thus, the NMDA receptor exhibits characteristics of a voltage-gated channel.
MEDICAL 21
Section II • Excitable Tissue
Ex+= equilibrium potential
[X+]0 = concentration outside (extracellular)
[X+]i = concentration inside (intracellular)
Z= value ofthe charge
Ligand-gated
Glutamate and aspartate are the endogenous ligands for this receptor. Binding of one ofthe ligan"ds is required to open the channel, thus it exhibits characteristics of a ligand-gated channel.
•If Em is more negative than--70 mV, binding of the ligand does not open the channel (Mg2+ block related to voltage prevents).
•IfEm is less negative than - -70 mV, binding of the ligand opens the channel (even though no Mg2+ block at this Em, channel willnot open without ligand binding).
The NMDA receptor is a non-selective cation channel (Na+, K+, and Ca2+ flux through it). Thus, opening ofthis channel results in depolarization. Although the NMDA receptor is likely involved in a variety offunctions, the 2 most important are (1) memory and (2) pain transmission. With respect to memory, NMDA has been shown to be involved in long-term potentiation of cells, thought to be an important component ofmemory formation. With respect to pain transmission, NMDA is expressed throughout the CNS and has been proven in numerous stud ies to play a pivotal role in the transmission and ultimate perception ofpain.
EQUILIBRIUM POTENTIAL
Equilibrium potential is the membrane potential that puts an ion in electro chemical equilibrium, and it can be calculated using the Nernst equation. This equation computes the equilibrium potential for any ion based upon the con centration gradient.
Key points regarding the Nernst equation:
•The ion always diffuses in a direction that brings the Em toward its equi librium.
•The overall conductance of the ion is directly proportional to the net force and the permeability (determined by ion channel state) of the membrane for the ion.
•The Em moves toward the Ex of the most permeable ion.
•The number ofions that actually move across the membrane is neg ligible. Thus, opening of ion channels does not alter intracellular or extracellular concentrations of ions under normal circumstances.
Approximate Equilibrium Potentials for the Important Ions
It is difficult to measurethe intracellular concentration ofthe important electrolytes, thusequilibriumpotentials for these ionswillvary some across the various referenc es. The following representreasonableequilibrium potentialsfor the key electrolytes:
Ei<+ - -95 mV |
a+-+70mV |
Eel- - -76 mV |
ECa2+ - +125 mV |
22 MEDICAL
Chapters • Ionic Equilibrium and Resting Membrane Potential
Definitions
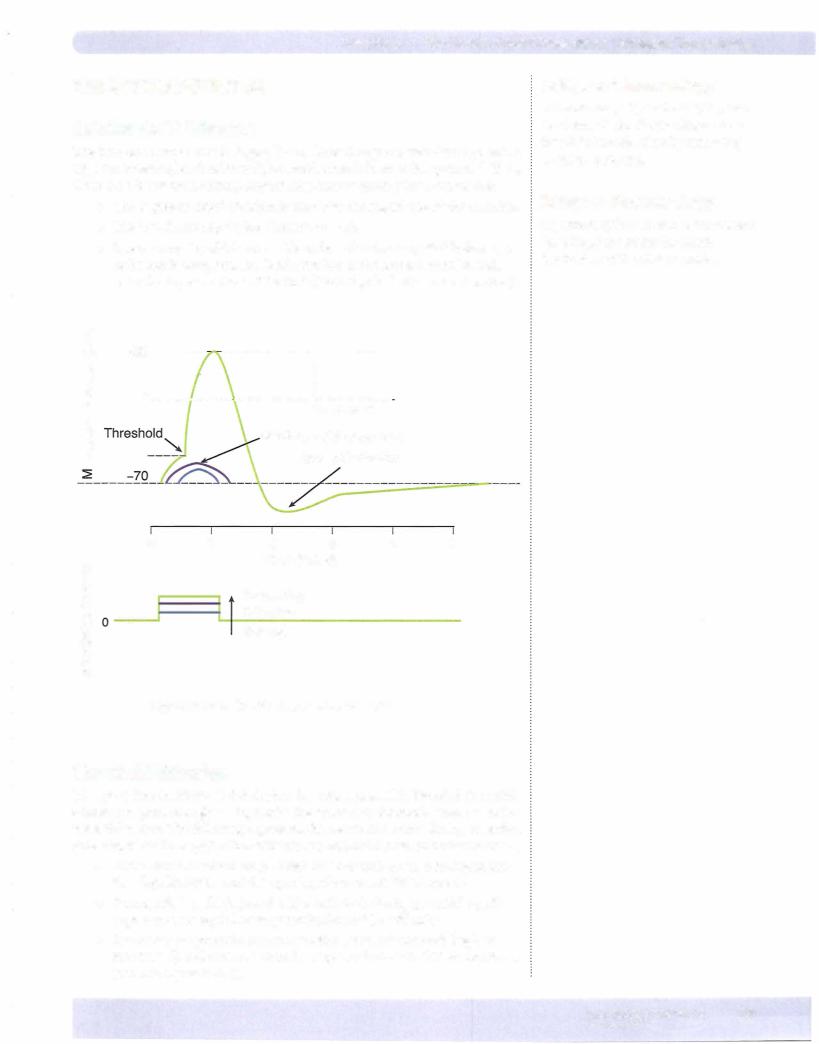
In depolarization, Em becomes less negative (moves toward zero). In hyperpo larization, Em becomes more negative (further from zero).
Resting Membrane Potential
Potassium (K'")
There is marked variability in the resting membrane potential (rEm) for excitable tissues, but the following generalizations are applicable.
•rEm for nerves is - -70 mV while rEm for striated muscle is - -90 mV.
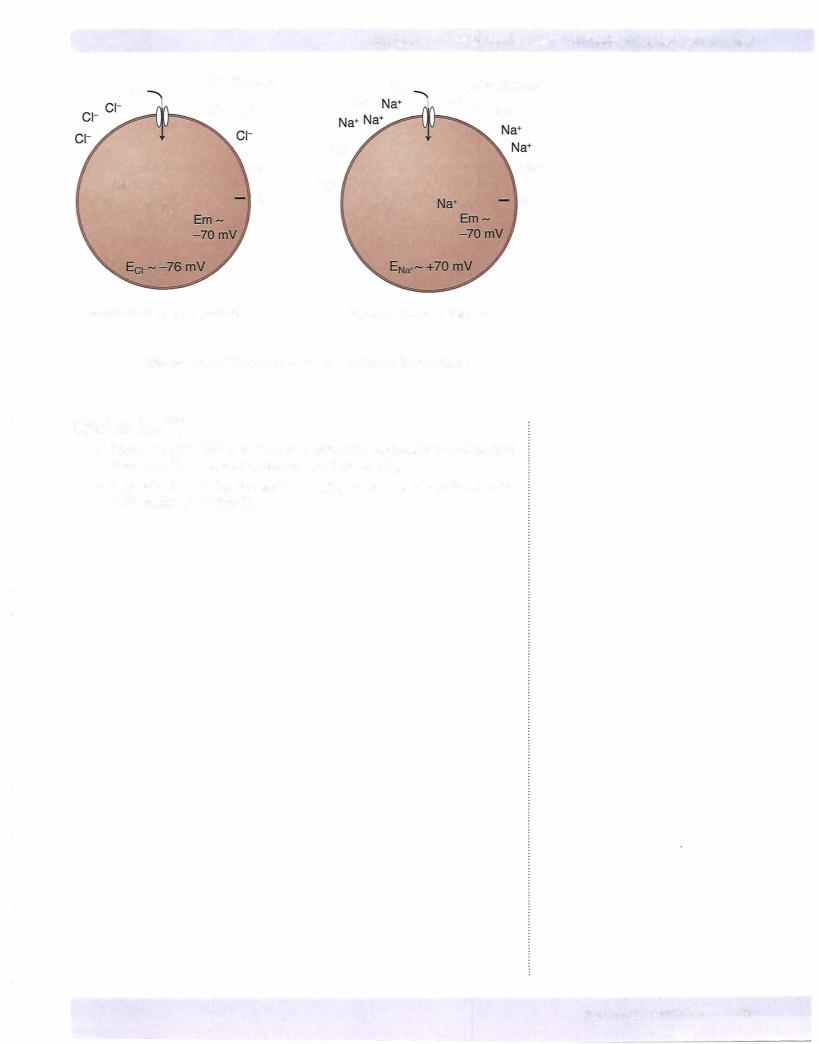
•Excitable tissue has a considerable number ofleak channels for K+, but not for c1-, Na+, or Ca2+. Thus, K+ conductance (g) is high in resting cells.
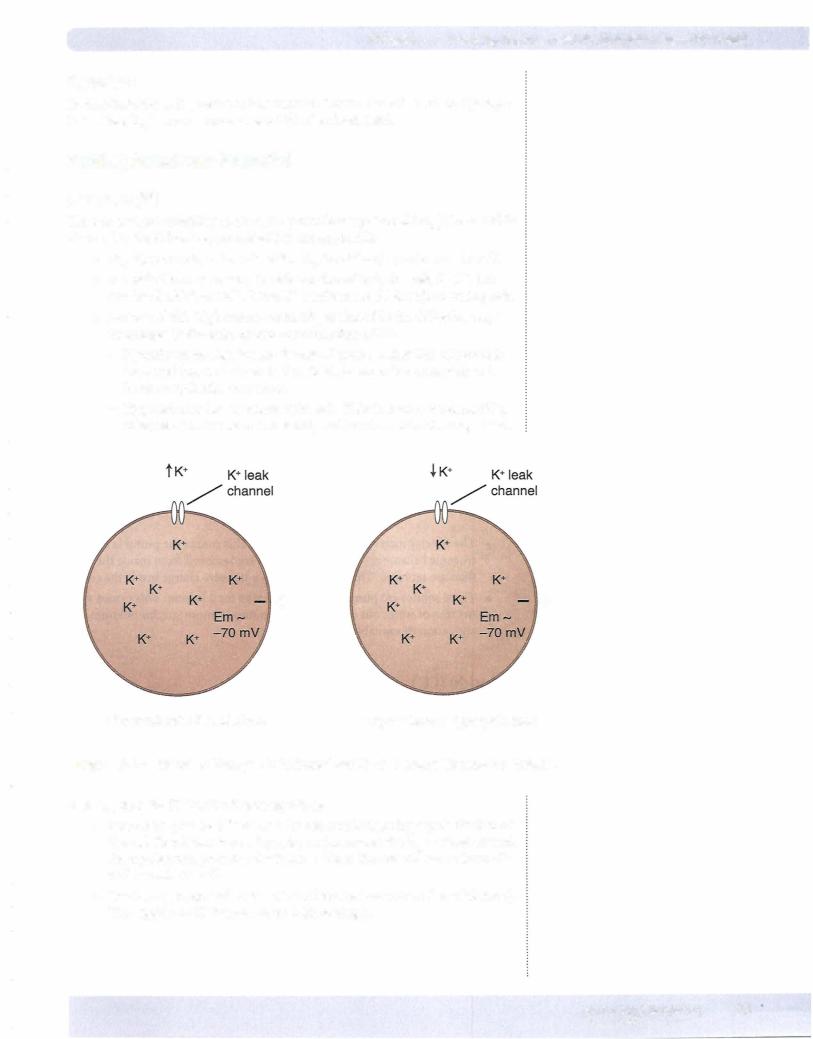
•Because of this high conductance, rEm is altered in the following ways by changes in the extracellular concentration of K+:
-Hyperkalemia depolarizes the cell. If acute, excitability of nerves is increased (nerve is closer to threshold for an action potential) and heart arrhythmias may occur.
-Hypokalemia hyperpolarizes the cell. This decreases the excitability of nerves (further from threshold) and heart arrhythmias may occur.
+ |
+ |
Hyperkalemia: Depolarizes |
Hypokalemia: Hyperpolarizes |
Figure 11-1-3. Effect of Changes in Extracellular K+ on Resting Membrane Potential
Altering the g for K+ has the following effects:
•Increasing g causes K+ to leave the cell, resulting in hyperpolarization of the cell. Recall that increasing g for an ion causes the Em to move toward the equilibrium potential for that ion. Thus, the cell will move from -70 mV toward -95 mV.
•Decreasing g depolarizes the cell (cell moves away from K+ equilibrium). This applies to K+ because of its high resting g.
MEDICAL 23
|
|
|
|
|
Chapter 1 • Ionic EquiUbrium and Resting Membrane Potential |
|
c1- |
|
c1- channel |
Na+ |
Na+ |
A, Na+ channel |
|
|
/c1- |
c1- |
|
|
a+ Na+ |
|
|
|
|
||||
|
|
|
|
|
||
|
|
|
|
Na+ |
|
|
c1- |
|
|
c1- |
Na+ |
|
Na+ |
|
|
+ |
|
+ |
||
|
|
|
|
|
|
|
c1- |
Na+ |
|
Increasing Cl- g Hyperpolarizes |
Increasing Na+ g Depolarizes |
Figure 11-1-4. Effect of Increasec1- g (left) or Na+ g (right)
Calcium (Ca2+)
•Similar to Na+, Ca2+ g is very low at rest. Thus decreasing g or changing the extracellular concentration has no effect on rEm.
•Increasing Ca2+ g depolarizes the cell (Em moves toward equilibrium for Ca2+, which is +125 mV).
MEDICAL 25
Section II • Excitable Tissue
Chapter Summary
•A voltage exists across the membrane ofexcitable tissue, with the inside of the cell being negative with respect to the outside.
•Ions diffuse based upon electrochemical gradients and always diffuse in
a direction that brings the membrane potential closer to the equilibrium potential for that ion.
•Equilibrium potential is the membrane potential that puts an ion in electrochemical equilibrium and is computed by the Nernst equation.
•Conductance (g) ofan ion is determined by the relative state ofion channels and the proportion ofion channels in a given state.
•The further the membrane potential is from the ion's equilibrium potential, the greater the net force for that ion.
•Ion channels are either ungated (leak), voltage-gated, or ligand-gated. The NMDA receptor is the exception, because it is both ligand and voltage-gated.
•Resting cells have a relatively high K+ conductance. Thus, changing the conductance of K+ and/or altering the extracellular concentration of K+ changes membrane potential.
•Alterations in extracellular o- and Na+ do not significantly change resting membrane potential.
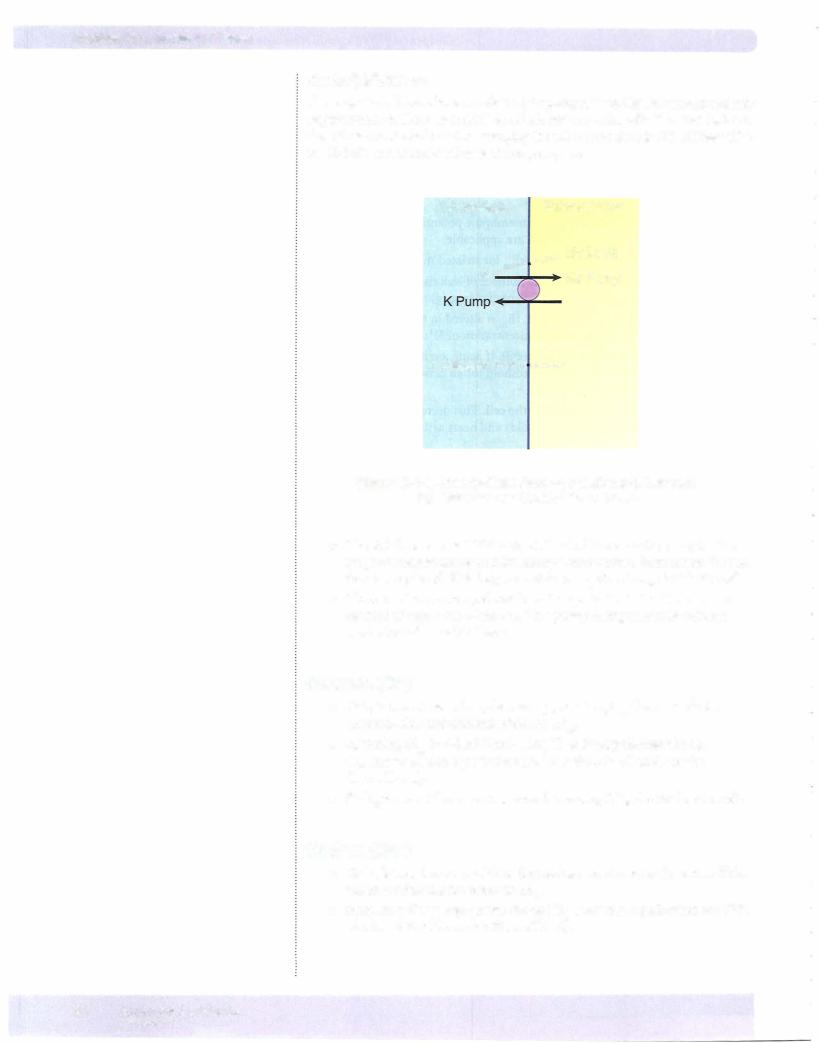
•The Na+-K+ ATPase plays a crucial role in maintaining a low intracellular concentration of Na+, keeping the inside ofthe cell negative, and regulating intracellular volume.
26 MEDICAL
The Neuron Action Potential |
2 |
and Synaptic Transmission |
|
OVERVIEW OF THE ACTION POTENTIAL
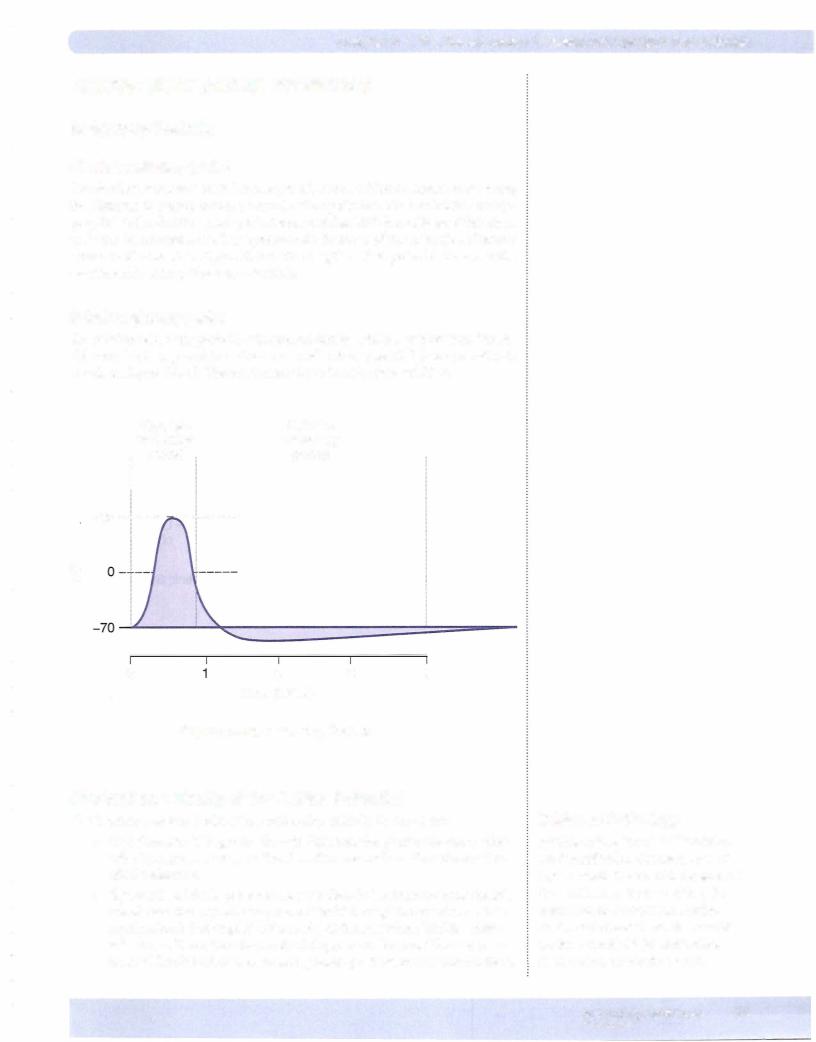
The action potential is a rapid depolarization followed by a repolarization (return of membrane potential to rest). The function is:
•Nerves: conduct neuronal signals
•Muscle: initiate a contraction
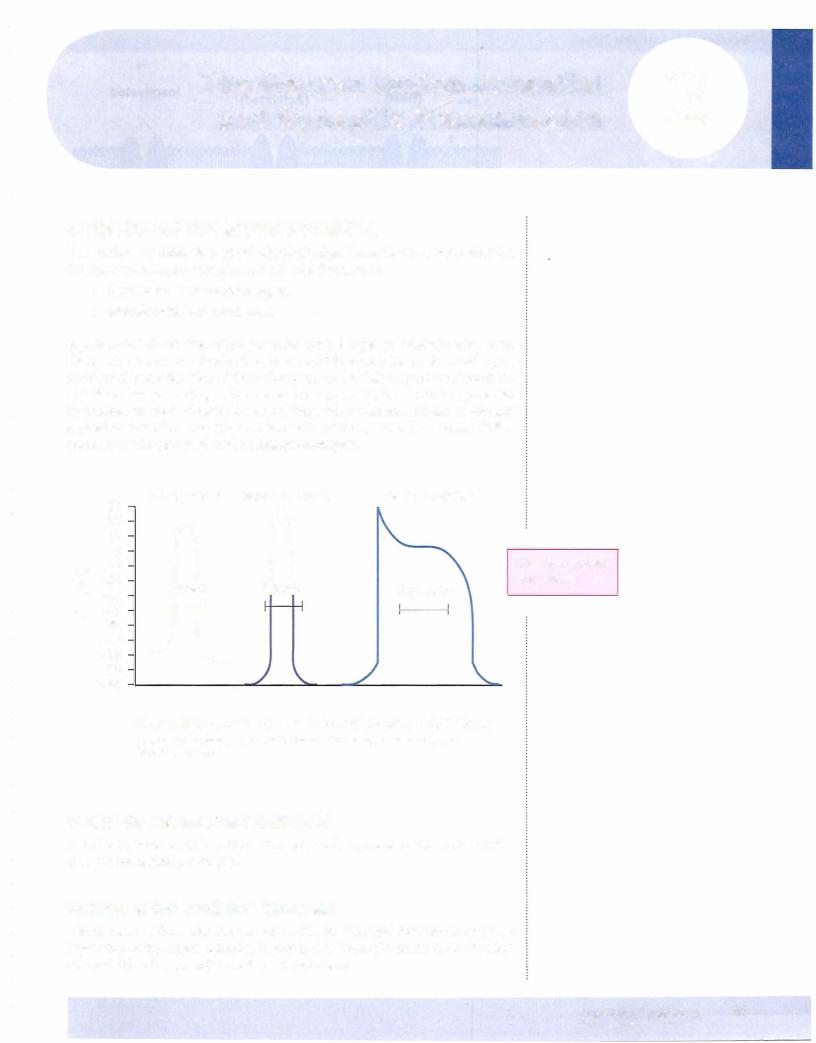
Figure Il-2-1 shows the action potential from 3 types of excitable cells. Even though there are many similarities, there are differences between these cell types, most notably the duration of the action potential. In this chapter, we discuss the specific events pertaining to the nerve action potential, but the action potential in skeletal muscle is virtually the same. Thus, what is stated here can be directly applied to skeletal muscle. Because the cardiac action potential has several differ ences, it willbe discussed in the subsequent chapter.
30
20
10
0 -10
> -20
.s -30
UJE -40
-50
-60
-70 -80
-90
Motor neuron |
Skeletal muscle |
Cardiac ventricle |
||
n |
n |
200 msec |
||
2 msec |
5 msec |
|||
Jt |
|
|
|
|
|
|
|
|
|
Figure 11-2-1. Action Potentials from 3 Vertebrate Cell Types
(Redrawn from Flickinger, C.J., et al.: Medical Cell Biology, Philadelphia, 1979, W.8. Saunders Co.)
Note the different time scales
VOLTAGE-GATED ION CHANNELS
In order to understand how the action potential is generated, we must first dis cuss the ion channels involved.
Voltage-gated (fast) Na+ Channels
The opening of these channels is responsible for the rapid depolarization phase (upstroke) of the action potential. Figure Il-2-2 shows the details of the fast Na+ channel. It has 2 gates and 3 conformational states:
MEDICAL 27
Section II • Excitable Tissue
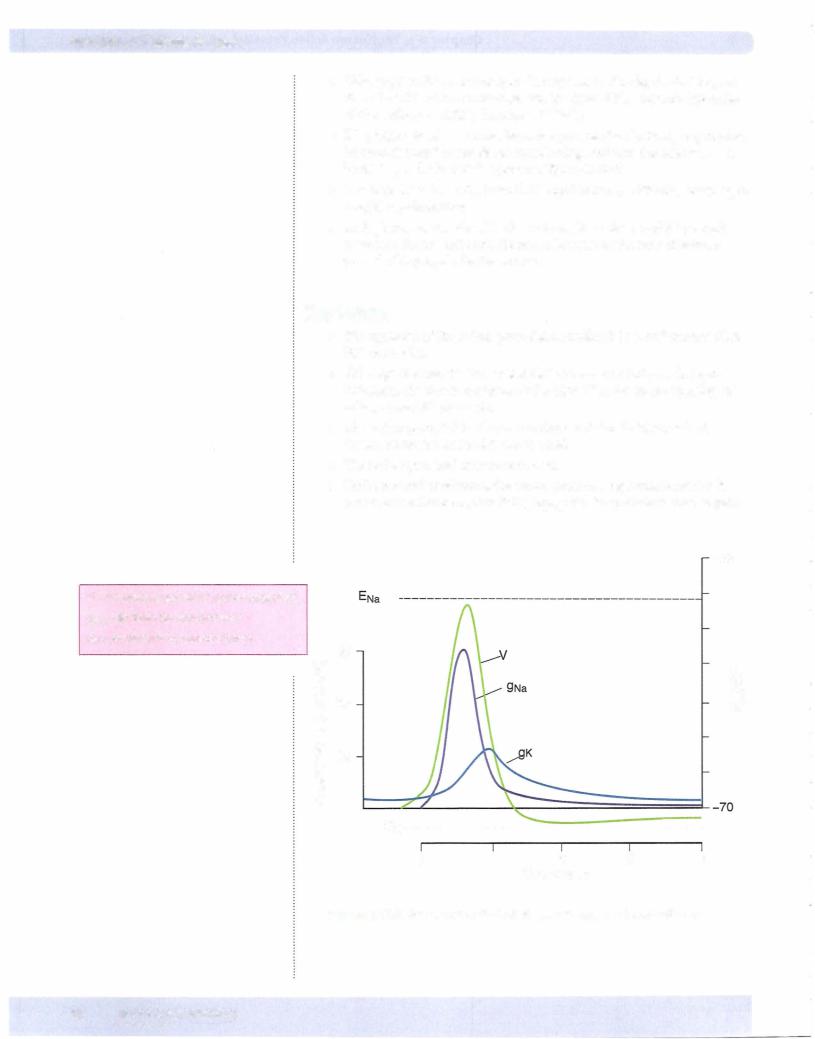
•Voltage-gated K+ channels open in response to the depolarization, but since their kinetics are much slower, the inward Na+ current (upstroke of the action potential) dominates initially.
•K+ g begins to rise as more channels open. As the rise in Em approaches its peak, fast Na+ channels are inactivating, and now the neuron has a high K+ g and a low Na+ g (see also Figure Il-2-4).
•The high K+ g drives Em toward K+ equilibrium (- -95 mV) resulting in a rapid repolarization.
•As Em becomes negative, K+ channels begin to dose, and K+ g slowly returns to its original level. However, because of the slow kinetics, a period of hyperpolarization occurs.
Key Points
•The upstroke of the action potential is mediated by a Na+ current (fast Na+ channels).
•Although the inactivation of fast Na+ channels participates in repo larization, the dominant factor is the high K+ g due to the opening of voltage-gated K+ channels.
•The action potential is all or none: Occurs if threshold is reached, doesn't occur if threshold is not reached.
•The action potential cannot summate.
•Under normal conditions, the action potential regenerates itself as it moves down the axon, thus it is propagated (magnitude is unchanged).
+80
V = Membrane potential (action potential) 9Na = Sodium ion conductance
9K = Potassium ion conductance
(\J |
30 |
> |
E |
|
|
-S2 |
20 |
E |
E |
'E |
|
.s::: |
|
|
_§_ |
|
UJ |
|
|
|
Q) |
|
|
u |
|
|
c:: |
|
|
.§:::l10 |
|
|
"O |
|
|
c:: |
|
|
0 |
|
|
() |
|
|
EK----------------------------------------
0 |
1 |
2 |
3 |
4 |
|
|
Time (msec) |
|
|
Figure 11-2-4. AxonAction Potential and Changes in Conductance
30 MEDICAL

Chapter 2 • The Neuron Action Potential and Synaptic Transmission
5.The resulting depolarization opens fast Na+ channels on the muscle membrane (sarcolemma) causing an action potential in the sarcolemma. Under normal circumstances, an action potential in the motor neuron releases enough Ach to cause an EPP that is at least threshold for the action potential in the skeletal muscle cell. In other words, there is a one-to-one relationship between an action potential in the motor neu ron and an action potential in the skeletal muscle cell.
6.The actions of Ach are terminated by acetylcholinesterase (AchE), an enzyme located on the postsynaptic membrane that breaks down Ach into choline and acetate. Choline is taken back into the presynaptic ter minal (reuptake), hence providing substrate for re-synthesis of Ach.
Othercholinergicsynapses
Neuronal nicotinic (NN) receptors
Outside ofthe CNS, these primarily reside in autonomic ganglia. Recall that pre ganglionic neurons are cholinergic and these fibers synapse on nicotinic recep tors in the ganglia.
Muscarinic receptors
Muscarinicreceptorsare G-proteincoupledreceptors.These resideintarget tissues innervated by parasympathetic postganglionic neurons.
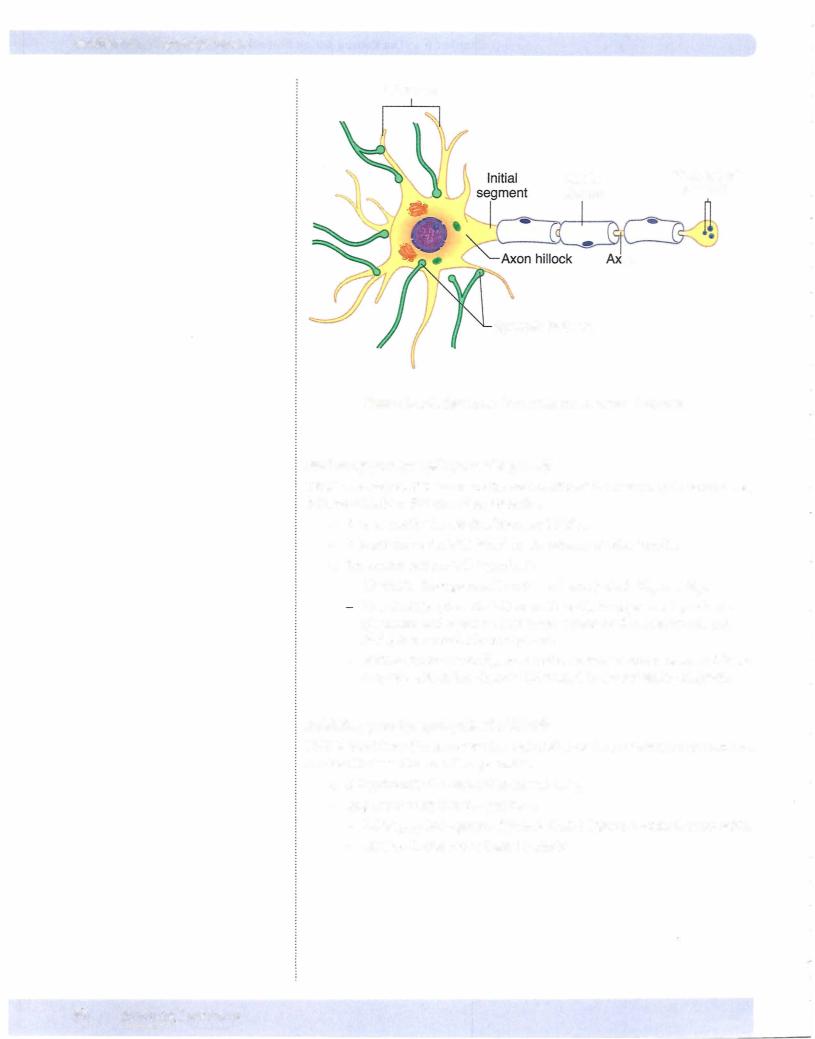
Synapses Between Neurons
Figure II-2-7 illustrates synaptic junctions between neurons. In general, the syn aptic potentials produced are either excitatory or inhibitory (see below) and are produced by ligand-gated ion channels. Some other important aspects associ ated with these synapses are:
•Synapses are located on the cell body and dendrites.
•The currents produced at these synapses travel along the dendritic and cell body membranes.
•The axon hillock-initial segment region has a high density of fast Na+ channels and is the origin for the action potential of the axon.
•The closer the synapse is to this region, the greater its influence in deter mining whether an action potential is generated.
•If the sum of allthe inputs reaches threshold, an action potential is generated and conducted along the axon to the nerve terminals.
Bridge to Pharmacology
Botulin um toxin is a protease that destroys proteins needed for the fusion and release of synaptic vesicles. This toxin targets cholinergic neurons, resulting in flaccid paralysis.
Bridge to Pharmacology
Latrotoxin, the venom from the black widow spider, opens presynaptic Ca2+ channels, resulting in excess Ach release.
Bridge to Pharmacology
Many pesticides, as well as some therapeutic agents, blockAchE, resulting in the prolonged action ofAch in cholinergic synapses.
Bridge to Pharmacology
A variety of compounds can block
NM receptors (non-depolarizing neuromuscular blockers), while succinylcholine binds to this receptor causing the channel to remain open (depolarizing neuromuscular blocker).
Bridge to Pathology
Two important pathologies related to neuromuscular junctions are
myastheniagravis and Lambert-Eaton syndrome. The most common form of myasthenia gravis is an autoimmune condition in which antibodies are created that block the NM receptor. Lambert-Easton is also an autoimmune condition, but the antibodies block the presynaptic voltage-gated Ca2+ channels.
MEDICAL 33
Chapter 2 • The Neuron Action Potential and SynapticTransmission
Electrical Synapses
•In contrast to chemical synaptic transmission, there is a direct flow of current from cell to cell.
•This cell-to-cell communication occurs via gap junctions; because the cells are electrically coupled, there is no synaptic delay.
•Cardiac and single-unit smooth muscle cells have these electrical synapses.
REVIEW AND INTEGRATION
In this section, we review muchofthe preceding information and add inapplica ble new information as it pertains to clinical signs indicative ofalterations in the normal physiological function just discussed. These are clinical signs intended to help further reinforce the important physiology and thus aid the student in recognizing possible causes of these clinical signs. This is not intended to fully represent all the specific signs/symptoms related to each and every condition in dicated.
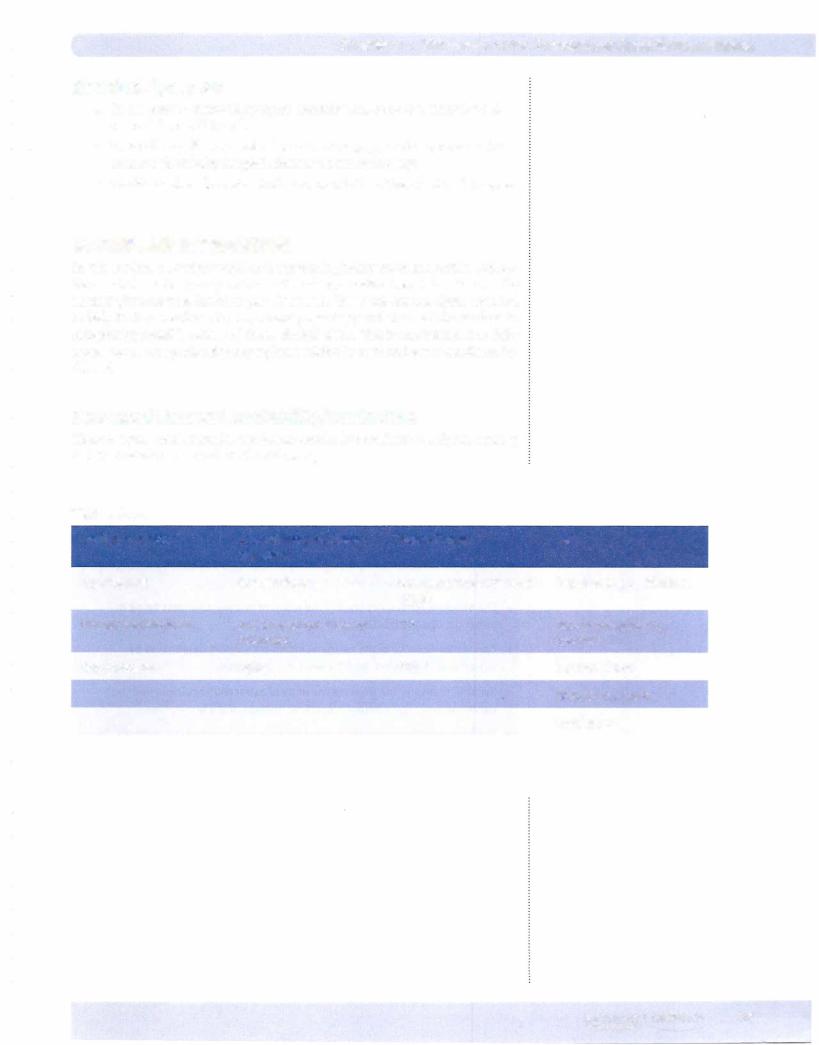
Decreased Neuronal Excitability/Conduction
Clinical signs could include: weakness; ataxia; hyporeflexia; paralysis; sensory deficit. Possible causes include the following.
Table 11-2-1
Ion Disturbances |
Loss of Neurons/ Demy- |
Toxins/Drugs |
NMJ |
|
elination |
|
|
Hypokalemia |
Guillian-Barre |
Local anesthetics ("caine" |
Depolarizing NM blockers |
|
|
drugs) |
|
Chronic hyperkalemia |
ALS (amyotrophic lateral |
TIX |
Non-depolarizing NM |
|
sclerosis) |
|
blockers |
Hypercalcemia |
Aging |
STX |
Lambert-Eaton |
|
|
|
Myasthenia gravis |
|
|
|
Botulinum |
MEDICAL 35