

Chen The electron capture detector
.pdfEXPERIMENTAL ECD AND NICI PROCEDURES |
77 |
dependence of different internal standards. We have used C6F5NO2, C7F14, CCl4, and C6H4Br2 because they have little temperature dependence. Acetophenone has been used because it has a large a region that establishes Qan and Ea. Others have used nitrobenzene and naphthalene. The use of an internal standard will automatically cancel out instrumental variations. In NIMS this is especially important since it is difficult to know the exact amount of sample introduced into an ion source but relative concentrations can be easily prepared.
Because of the high sensitivity of the ECD, it is necessary to make sure that glassware, syringes, and solvents used to prepare samples are clean. In preparing standard solutions of CCl4, CHCl3, and CH2Cl2, pesticide-grade solvents should be used. The solvents should be placed into glassware tested with the ECD. The syringes used to prepare the dilutions must be cleaned until no peaks are observed in the ECD. The response of CH2Cl2 is a million times lower than that for CCl4, and often, enough CCl4 is present in the ‘‘pure’’ material to give a measurable peak when CH2Cl2 is diluted.
The basic procedure for preparing dilutions of CCl4 will be given in detail and should be used for other samples. A 10-mL sample of pure CCl4 should be diluted in 10 mL of solvent using a syringe and a 10-mL volumetric flask ð10 3Þ. After making sure that the syringe is clean, you should further dilute 10-mL of that sample in 100 mL of solvent. This gives a total dilution of 10 7 mL CCl4/mL solvent. The density of CCl4 should be used to find the molar concentration of CCl4 in the solutions. It will be 1:8 10 7/mL in the final solution. Larger amounts of the final concentration can be utilized to prepare other samples with a fixed amount of CCl4 that can be used as an internal standard. For example, to prepare a solution 10 5 in CHCl3, 100 mL of a 10 3 solution of CHCl3 is diluted into 10 mL of the 10 7 solution of CCl4.
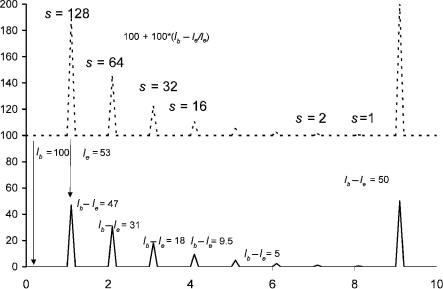
Figure 5.1 shows a series of simulated chromatograms where the peaks represent a concentration change of two orders of magnitudes. The standing current is equal to Ib and is 100 units. The highest direct ECD peak is 47 units, while the converted signal is 0.887 since Ib Ie ¼ 47 and Ie ¼ 53 units. When the number of moles injected is reduced by a factor of 8, the peak height for the corrected response decreases to 0.11, while the direct ECD peak is 9.5 units. This only represents a decrease of a factor of 5. For the next decrease of a factor of 8 in concentration, both the direct and converted signal are decreased by a factor of 8. Thus, the ECD response factors should be measured using the converted response or in the linear range of the detector. This linearity test is the first step in characterizing a detector. Modern detectors automatically convert the signal to a linear one so that the molar response need only be determined in the linear range.
If peaks are symmetrical, as is frequently the case with modern capillary columns, only the peak height must be converted. When recording the chromatograms on a strip chart recorder, the chart speed on the recorder should be increased to obtain an accurate measurement of the peak width. The area can then be obtained by triangulation. Other required data are the flow rate through the detector and the moles of sample in the detector. For samples that are split the measurement of the split ratio is also required to obtain the number of moles injected. The
78 EXPERIMENTAL PROCEDURES AND DATA REDUCTION
Figure 5.1 Simulated chromatograms showing the difference between the concentration dependence of the absolute signals and the corrected signals.
calculation for K, the molar response, is
KEC ¼ f½Ib Ie&=Icgmaxft1=2gV=n |
ð5:1aÞ |
The f½Ib Ie&=Iegmax is the corrected height at the peak maximum and is dimensionless. The measured peak width at corrected half-height is converted to half-
time by dividing by chart speed. The volumetric flow rate or total flow rate through the detector is measured with a bubble flow meter and is typically 50 to 150 mL/min.
The moles injected are determined from the sample size, concentration, and split ratio and are typically in the range of 1.0 femtomole for a high-capturing compound such as CCl4 with a K of 1011 L/mole. The molar response of a negative-ion mass spectrometer can be determined in the same manner, but the moles into the mass spectrometer must be estimated.
Once the molar response is measured at a given temperature, the temperature of the detector can be changed and the measurement repeated. The temperature must be that in the actual ion source of the mass spectrometer or in the ECD detector. Changing the temperature slowly or waiting for equilibration can accomplish this.
Table 5.1 presents data taken to characterize a high-temperature Ni-63 detector using C6F6. A series of solutions were prepared at concentrations of 5 10 5, 5 10 6, and 5 10 7 moles of C6F6/mL heptane. The samples were injected into the chromatograph with a 10-mL syringe without splitting. The total flow rate was 150 mL/min at 300 K. The data were recorded on a strip chart recorder and the peak width converted to time using the chart speed of the recorder.
|
|
|
EXPERIMENTAL ECD AND NICI PROCEDURES |
79 |
|||
TABLE 5.1 Calculation of ECD Responses from Data for Hexafluorobenzene |
|
||||||
|
|
|
|
|
|
|
|
b |
e |
w |
n |
T |
F |
|
K |
|
|
|
|
|
|
|
|
19.1 |
13.9 |
0.650 |
2.15E-10 |
515 |
0.15 |
3.08E þ 08 |
|
19.9 |
17.0 |
0.650 |
2.15E-10 |
529 |
0.15 |
1.38E þ 08 |
|
18.6 |
15.6 |
0.630 |
3.22E-10 |
540 |
0.15 |
1.10E þ 08 |
|
18.8 |
17.1 |
0.630 |
3.22E-10 |
556 |
0.15 |
5.81E þ 07 |
|
18.8 |
17.2 |
0.625 |
3.22E-10 |
571 |
0.15 |
5.54E þ 07 |
|
18.5 |
17.9 |
0.625 |
3.22E-10 |
588 |
0.15 |
2.09E þ 07 |
|
21.4 |
20.2 |
0.625 |
6.44E-10 |
606 |
0.15 |
1.65E þ 07 |
|
21.2 |
20.5 |
0.625 |
6.44E-10 |
625 |
0.15 |
9.87E þ 06 |
|
21.1 |
18.3 |
0.615 |
6.44E-09 |
654 |
0.15 |
4.57E þ 06 |
|
20.5 |
19.1 |
0.615 |
6.44E-09 |
676 |
0.15 |
2.33E þ 06 |
|
20.8 |
17.5 |
0.600 |
3.22E-08 |
709 |
0.15 |
1.21E þ 06 |
|
21.2 |
19.5 |
0.600 |
3.22E-08 |
730 |
0.15 |
5.65E þ 05 |
|
21.2 |
19.2 |
0.600 |
4.30E-08 |
746 |
0.15 |
5.17E þ 05 |
|
19.4 |
17.6 |
0.600 |
6.44E-08 |
769 |
0.15 |
3.81E þ 05 |
|
The values of Ib and Ib Ie (the peak height) were measured with a ruler and the temperature read from a thermometer next to the detector in a metal heating block. The column and injector temperatures were kept constant. The response was corrected for the small change in the standing current by multiplying by Imax=Ib ¼ 21:2=Ib. The volumetric flow rate was corrected by multiplying by T=300 K.
The final equation for K from the raw data is
K ¼ f½Ib Ie&=Iegmaxft1=2gðV=nÞðT=300ÞðImax=IbÞ ð5:1bÞ
where n ¼ (sample size) (concentration) and t1=2 ¼ w/chart speed.
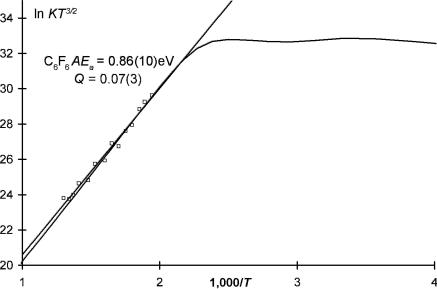
The calculations shown in Table 5.1 are typical for the determination of absolute molar responses. Note that the determinations at lower temperatures required the injection of a lower concentration. The values of n and w are rounded for this example. In the event that the integrated response is from a commercial detector, the data must be in the ‘‘linear range.’’ A scale factor will give the values of the absolute response factors. An example for this type of calculation will be provided later. Figure 5.2 is a plot of these data overlaid by a calculated curve for C6F6 [11]. The Ea determined from a plot of ln KT3=2 versus 1; 000=T is the gas constant times the slope. The electron affinity from this limited data is determined to be 0:86 0:10 eV. The intercept gives a Qan of 0:07 0:05. This is within the uncertainty for the weighted averages determined with more data.
Modern chromatographs report linearized areas for the ECD. In these cases a single solution can be used to determine the temperature dependence of several compounds. The relative responses can be standardized to a value for an internal standard such as CCl4. The use of relative responses cancel the flow rate, sample
80 EXPERIMENTAL PROCEDURES AND DATA REDUCTION
Figure 5.2 Illustration of data for C6F6 in the linear region obtained from the raw data shown in Table 5.1. The slope in this region gives an Ea of 0.86(10) and a Qan of 0.070(5) by a simple least squares through the data. The calculated curve was obtained from data in four regions.
size, temperature, and standing current corrections since the same injection is utilized. More precise relative values can be obtained than if individual injections are made. The only other experimental quantities that must be known are the relative values of the concentrations. Table 5.2 provides an example of such a calculation for CH2Cl2, CHCl3, and CCl4. The areas are in the linear range of the detector and are reported on an integrator. With modern computer data systems the actual signals can also be recorded so that an absolute value of K may be obtained
for CCl |
4, it is 7:2 10 |
10 |
L/mole at |
328 K. This is equal to k |
|
= |
2 k . The value |
||||
|
|
10 |
14 |
L/mole-s. |
|
1 |
|
D |
|||
for k1 is well known |
to be 2:1 |
|
Consequently, |
the value for |
|||||||
AD ¼ kD ¼ 1:1 1014=7:2 1010 ¼ 1; 500 s 1. By |
knowing the |
concentration |
|||||||||
ratios for the other compounds, the relative responses can be converted to absolute responses. The maximum value for kN for the system can be determined from the intercept for the acetophenone data. The acetophenone data were taken separately from the chloromethanes. The value of Qan is 1.00 for acetophenone. The experimental intercept is 12.5. This is equal to ð11:73Þ þ lnðAN =ADÞ, which gives a value of AN ¼ AD expð12:5 11:73Þ ¼ 2 1; 500 s 1. These values are typical for the original detectors. However, modern detectors have smaller values of ADð500– 1;000 s 1Þ and smaller ratios of AN =AD ¼ 1 operated in the constant current mode because of the ‘‘cleaner’’ carrier gases and systems. These data are plotted

EXPERIMENTAL ECD AND NICI PROCEDURES |
81 |
TABLE 5.2 Calculation of K for Chloromethanes Using Carbon Tetrachloride as an Internal Standard
Area 1 |
Area R |
Area 2 |
|
ln KT3=2 |
ln KT3=2 |
ln KT3=2 |
ðCH2Cl2Þ |
ðCCl4Þ |
ðCHCl3Þ |
TðKÞ |
ðCCl4Þ |
ðCHCl3Þ |
ðCH2Cl2Þ |
3.7182 |
0.4357 |
1.8739 |
326 |
34.59 |
31.13 |
25.68 |
3.9381 |
0.4399 |
1.8612 |
326 |
34.59 |
31.15 |
25.74 |
3.9593 |
0.4442 |
1.8654 |
326 |
34.59 |
31.16 |
25.74 |
3.2106 |
0.4040 |
1.9035 |
281 |
34.48 |
30.93 |
25.40 |
3.1894 |
0.3989 |
1.8824 |
281 |
34.48 |
30.92 |
25.40 |
1.9500 |
0.3316 |
1.9331 |
254 |
34.40 |
30.64 |
24.81 |
1.9247 |
0.3244 |
1.8993 |
254 |
34.40 |
30.63 |
24.81 |
1.9966 |
0.3350 |
1.9712 |
254 |
34.40 |
30.63 |
24.81 |
1.0321 |
0.2826 |
2.1700 |
204 |
34.25 |
30.21 |
23.91 |
0.9983 |
0.2750 |
2.1235 |
204 |
34.25 |
30.21 |
23.90 |
0.4090 |
0.2377 |
2.5930 |
149 |
34.07 |
29.68 |
22.62 |
0.4437 |
0.2517 |
2.7326 |
149 |
34.07 |
29.68 |
22.65 |
0.1730 |
0.2356 |
3.4982 |
100 |
33.88 |
29.18 |
21.27 |
0.1700 |
0.2314 |
3.5701 |
100 |
33.88 |
29.15 |
21.24 |
0.0711 |
0.2348 |
5.1902 |
55 |
33.69 |
28.59 |
19.80 |
0.0656 |
0.2466 |
5.4229 |
55 |
33.69 |
28.60 |
19.67 |
0.0651 |
0.2335 |
5.2410 |
55 |
33.69 |
28.58 |
19.70 |
|
|
|
|
|
|
|
The concentration ratio of CHCl3 to CCl4 is 7.5 moles of CHCl3/mole CCl4.
The concentration ratio of moles of CH2Cl2 to CCl4 is 60,000 moles CH2Cl2/mole CCl4.
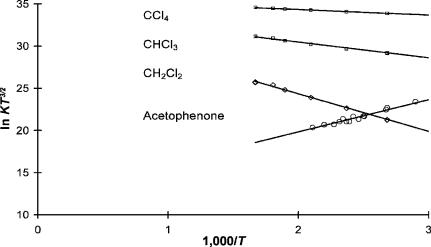
in Figure 5.3. The electron affinity for acetophenone determined from a simple linear least squares is 0:333 0:02 eV and the intercept 12:6 0:2. The activation energy for the electron attachment to CCl4 was zero, and the values for CH2Cl2 and CHCl3 were 0:33 0:02 eV and 0:14 0:02 eV, respectively. These are in agreement with previous determinations and indicate that the electron energy distribution is thermal [12–14].
The combination of a gas chromatograph with the ECD or negative-ion mass spectrometer is very important. This ensures that only a small amount of highly purified sample is responsible for the response. However, in the case of compounds that are not highly reactive with thermal electrons, it must be certain that the peak observed in the ECD or NIMS is due to the major component in the sample. This can be accomplished by using a nonselective detector in parallel or series. A good detector for this purpose is the flame ionization detector or a pulsed discharge ionization detector. In the case of the mass spectrometer the positive-ion mode can be used to locate the major component. It is also important to verify that the specific detector gives the same type of results as have been obtained previously. Good DEC(1) compounds for this purpose are CCl4, CHCl3, and CH2Cl2. Acetophenone, nitrobenzene, and C6F5NO2 are good Eql(1/1) and Eql(1/2) compounds, whereas C6F6, C6F5Cl, and CS2 are good Eql(2/2) compounds [11]. These compounds have been chosen to give ranges of values for the ECD parameters.
82 EXPERIMENTAL PROCEDURES AND DATA REDUCTION
Figure 5.3 Plots of ECD data as ln KT3=2 versus 1,000/T. The data are typical for the chloromethanes. An ECD should be able to reproduce these data. They were obtained using a single injection at each temperature. The calculations of the data are illustrated in Table 5.2 using carbon tetrachloride as an internal standard. The data for acetophenone were obtained in a separate experiment.
The first step in verifying the validity of data from a specific detector is to determine the relative responses of the above compounds at a fixed detector temperature. This can be accomplished easily for a solution designated A (CCl4, CHCl3, CH2Cl2, C6F6, and CS2) at one column temperature and another designated B (naphthalene, acetophenone, nitrobenzene, C6F5Cl, and C6F5NO2) at a higher column temperature. The detector temperature should be stabilized at about 423 K(150 C). Then appropriately prepared solutions should be injected and the relative molar responses calculated. It is best to prepare solutions of only one component for this constanttemperature determination. In this manner the concentration of CCl4 in the CHCl3 or CH2Cl2 solutions can be determined using the ECD data. The molar response for maximum capturing compounds such as CCl4 and C6F5NO2 will be relatively tem- perature-independent. From values of K ¼ 2:1 1011 L/mole and k1 ¼ 4:2 1014 L/mole-s for CCl4, the value of kD ¼ k1=2 K ¼ 1;000 s 1 can be calculated. This is a nominally ‘‘clean’’ ECD. At this temperature the relative responses should be 8,000:800:1 for CCl4: CHCl3: CH2Cl2. The responses of C6F6 and CS2 should be about the same as that for CHCl3. Compounds with higher molecular weights in solution B will be chromatographed at a higher column temperature. The molar response of C6F5NO2 should be roughly the same as that for CCl4, whereas C6F5Cl and C6H5NO2 should be an order of magnitude lower. For acetophenone the response should be three orders of magnitude lower, for naphthalene six orders of magnitude lower. Once it is established that the detector gives the proper relative
EXPERIMENTAL ECD AND NICI PROCEDURES |
83 |
response and is relatively ‘‘clean,’’ the temperature dependence of the above compounds should be measured. If the actual electron currents are not measured, then the linearized response of the detector can be used to obtain fundamental properties. If the response for a given compound is too large, then the concentration must be reduced or the size of the injected sample decreased. A convenient technique to adjust for variations in the standing current, or Ib, is to measure the response of a compound relative to an internal standard, for example, CCl4 or C6F5NO2, and to adjust for the concentration difference. The reported response for the reference compound is used to obtain absolute values, as illustrated in Table 5.2.
The general procedure for collecting data is as follows for a mixture of CCl4, CHCl3, and CH2Cl2. Prepare 25 mL of a standard solution of CCl4 in a nanograde solvent. Inject about 50 femtograms of CCl4 into the detector at 423 K. Determine the area per mole response of the detector. Determine a response factor for CCl4 such that area/mole ¼ RF 1011 L/mole. This response factor should be
about 1.0 if the area is calculated using f½Ib Ie&=Iegmaxft1=2gV. Record the values of Ib or f0, the base frequency. The frequency modulated mode is commonly used in
commercial detectors. Prepare a 25-mL solution of CHCl3 that is about 10 times that of CCl4 and determine the molar response. Be sure to note any CCl4 that appears in this solution and determine its concentration using the molar response determined above. Finally, prepare a solution of CH2Cl2 10,000 times that of CCl4 and analyze that mixture for CHCl3 and CCl4 using the measured response factors. That solution can often be used to determine relative responses from 150 C to room temperature. If there is insufficient CCl4 or CHCl3 in this solution, then mix known amounts of the standard solutions to prepare a known concentration of each from the stock solutions. Raise the temperature of the detector to its highest temperature and condition the detector. Measure the temperature of the detector and determine the relative response factor of the compounds. Gradually lower the temperature, record the temperature, and determine the relative responses. In the past this has been done with a strip chart recorder, but with modern computers and data storage, the information can be merely stored for later data reduction. In the original work the temperature of the detector was recorded with a thermometer inside the detector. However, temperatures from a calibrated thermocouple can now be recorded continuously as the sequential samples are injected. As the temperature of the detector is lowered, the relative response of CH2Cl2 will decrease so that different solutions will be required to remain in the linear detectable region. Compare the results with those in Table 5.2. If the temperature dependence is about the same, the detector is suitable for fundamental studies.
The data collection procedure for negative-ion mass spectrometers is very similar to that for the ECD. The ion signals are directly proportional to the concentration. The molar response will be the integrated area divided by the number of moles in the gas phase. The number of moles will cause a problem because the exact concentration in the gas phase is not easily measured in a GC/MS. Consequently, the response to a given compound with a known molar response is used to calibrate the detector. The procedures will be the same as for the ECD described earlier. Table 5.3 provides data for SF6, nitrobenzene, and m-dinitrobenzene determined

84 EXPERIMENTAL PROCEDURES AND DATA REDUCTION
TABLE 5.3 Calculation of K for SF6, C6H5NO2, and C6H4(NO2)2 Using C6H4(NO2)2 as a Calibration Point
T |
Area R |
Area 1 |
Area 2 |
ln KT3=2 |
ln KT3=2 |
ln KT3=2 |
373 |
310 |
145 |
371 |
34.62 |
33.86 |
32.50 |
398 |
192 |
185 |
294 |
34.24 |
34.20 |
32.36 |
423 |
176 |
200 |
296 |
34.24 |
34.37 |
32.46 |
448 |
147 |
210 |
286 |
34.15 |
34.50 |
32.51 |
473 |
122 |
200 |
303 |
34.04 |
34.54 |
32.65 |
498 |
108 |
210 |
280 |
34.00 |
34.66 |
32.65 |
523 |
91 |
250 |
295 |
33.90 |
34.91 |
32.77 |
548 |
78 |
190 |
182 |
33.82 |
34.71 |
32.36 |
573 |
72 |
146 |
94 |
33.80 |
34.51 |
31.77 |
598 |
45 |
90 |
58 |
33.40 |
34.09 |
31.35 |
|
|
|
|
|
|
|
The concentration of nitrobenzene is a factor of 10 lower than that of m-dinitrobenzene, whereas that of SF6 is about the same.
Figure 5.4 Negative-ion mass spectrometry data plotted as ln KT3=2 versus 1;000=T for nitrobenzene m-dinitrobenzene and sulfur hexafluoride. The magnitude was scaled to the value of the k1 for SF6 at room temperature. The data for m-dinitrobenzene exhibits two states with a and b regions. Neither of these is the ground state. The curves are calculated using the measured electron affinities of SF6 and C6H5NO2 and m-C6H4(NO2)2. The Qan values are determined by the data to be 1.0. The responses were obtained by injecting a solution with a known amount of the three compounds into the mass spectrometer. These data were collected at higher temperatures than those in Figure 4.5.
REDUCTION OF ECD DATA TO FUNDAMENTAL PROPERTIES |
85 |
using an API source [7]. The Ea of SF6 and nitrobenzene can be determined from the NIMS data. A solution containing equal moles of SF6 and m-dinitrobenzene and a factor of 10 times as many moles of nitrobenzene was injected into an atmospheric pressure source with Ar/10% methane as the carrier gas. The parent ion intensities were measured at a series of temperatures and are recorded in Table 5.3. The scale factor was determined to yield a value of lnðAT3=2Þ of about 34 for m-dinitrobenzene at the lowest temperature. The same scale factor was then used for the other data. Because the relative areas are multiplied by the same scale factor, the actual concentrations in the gas phase need not be known. The relative responses will only depend on the concentrations. The data are plotted in Figure 5.4. The Ea for m-dinitrobenzene measured utilizing TCT experiments is 1.65 eV and was used in standard two-state equations to calculate the dotted curve at higher temperatures. Excited-state Ea of 1:0 0:05 eV and 0:67 0:05 eV fit the data at lower temperatures. The Ea of nitrobenzene is determined to be 1:00 0:06 eV, whereas that of SF6 is determined to be 1:07 0:07 eV. The activation energies for attachment to the ground state are 0:06 0:02 eV for SF6 and 0:02 0:02 eV for nitrobenzene. All the Qan are 1:0 0:1 and the ln A1 are 35:8 0:2 for SF6, 34:8 0:2 for m-dinitrobenzene, and 33:5 0:2 for nitrobenzene. In a separate NIMS determination the Ea for nitrobenzene was determined to be 1:0 0:07 eV, the ln A1 33:0 0:5, and the Qan 0:9 0:2.
5.3REDUCTION OF ECD DATA TO FUNDAMENTAL PROPERTIES
5.3.1Introduction
The data reduction procedure for ECD data is simple if there is only one temperature region. In the case of compounds that only have one a region, a simple least-squares procedure can determine the slope and intercept. As shown in Figure 4.1, from a plot of ln KT3=2 versus 1;000=T, the electron affinity is the slope times R and the quantity QanðAN =2 ADÞ is the intercept. Recall that Qan is the partition function ratio, whereas AN =AD is the ratio of the recombination rate constants. The problem is to establish that only one a region is present. This is normally done by comparing the intercept with an average value or the value for a compound with a Qan of 1. Alternatively, if the temperature dependence for acetophenone is obtained for an untested detector, the established electron affinity of acetophenone, 0:338 0:002 eV, can be used to calibrate the intercept. The intercept will be an upper limit for unknown compounds. Lower values can be attributed to a lower partition function ratio. For compounds that have a higher intercept the value for acetophenone should be used to determine the Ea. If this quantity has not been estimated, then the nominal intercept of 12:43 1:0 can be used to obtain an Ea. This assumes a Qan ¼ 1 and ðAN =ADÞ ¼ 2:0. Likewise for DEC(1) compounds with only a negative slope, such as CCl4, the instrument can be calibrated for a value of AD since E1 is zero, A1 is known, and K ¼ A1=ð2 T1=2ADÞ expðE1=RTÞ. The graphs in Figure 5.3 illustrate these determinations.
86 EXPERIMENTAL PROCEDURES AND DATA REDUCTION
The temperature dependence of the combined mechanisms is more complicated, with as many as eight potential parameters that can be obtained from the temperature dependence. These parameters are the activation energies and pre-exponential terms of the respective rate constants. In the case of compounds with one a and one b region the four parameters are A1, E1, Q, and Ea. For compounds with one excited state there are eight parameters, four for each state. Sufficient structure must exist in the ECD data to obtain parameters from it, or independent estimates of some of the parameters must occur.
For C6F6, CS2, and anthracene the electron affinity of the excited state was included in the data reduction procedure with its appropriate errors to define the other parameters. Estimates of the parameters can be obtained from the global plots of the ECD data as ln KT3=2 versus 1;000=T. Then the data can be reduced using a rigorous nonlinear least-squares procedure including data from other techniques and their respective errors. This type of data reduction can be completed with standard statistical packages, but has also been implemented in Visual BASIC using EXCEL. A complete description of the general least-squares procedures is given in the appendix, although we will examine examples of adjustments in this section [11, 15–18].
5.3.2Acetophenone and Benzaldehyde
In Figure 5.5 we demonstrate the use of two parameters to determine the electron affinity of acetophenone, the most precisely determined ECD electron affinity. In 1964 we also measured the ECD data as a function of reaction time, but did not know how the slope would change. Now we know that the slope gives the electron affinity, independent of reaction time. Figure 5.5, shows the plots of ln KT3=2 versus 1;000=T for data taken at 1,000, 1,000, 100, 75, and 50 ms reaction times fit with two parameters. Table 5.4 gives the slopes, intercepts, their uncertainties, and the covariance sab terms (see the appendix for the significance of the covariance term). The simple average is 0.348(27). The weighted average is 0.338(2) eV. If this value is used in the least-squares adjustment, the intercepts can be determined more precisely. Figure 5.6 is a plot of the data obtained using the average value of the Ea. In the appendix a numerical example of the calculations for one set of data and the extension of those data by including the average value of the Ea to determine the intercept are given. This shows the consolidation of data from different experiments, which could also be accomplished by simply solving equation 4.13 with a fixed electron affinity at each temperature and taking the weighted average of the values of lnðAN A1=ð2 AD A 1ÞÞ. However, the uncertainties in the various parameters will not be obtained and the weighting would be complicated. The simple average of the values obtained for the 50-ms data for acetophenone with an Ea of 0.338 eV is 11.51(24) versus the rigorous weighted value of 11.71(11):
ln KT3=2 ¼ lnðAN A1=ð2 AD A 1ÞÞ þ Ea=RT |
ð4:13Þ |