

Chen The electron capture detector
.pdfTHERMAL CHARGE TRANSFER METHODS |
117 |
[3, 56]. Among the reactions studied extensively were electron transfer to small molecules and radicals and proton transfer for inorganic and organic acids. The difficulty in generating molecular ions of organic compounds precluded the measurement of their electron affinities. At the low pressures of typical mass spectrometer sources, the molecular anions that are initially formed can undergo autodetachment before entering the mass analyzer.
In 1978 the following was reported:
Recently we have also observed rapid electron transfer reactions between a wide variety of stabilized negative ions and neutral molecules. For example CH3O( ) generated by dissociative electron attachment to CH3ONO rapidly transfers an electron to benzophenone to produce exclusively the negative ion radical of benzophenone. . . . This result indicates that the electron affinity of benzophenone is greater than 36.7 kcal/ mole, the measured electron affinity of CH3O. A scale of relative electron affinities constructed in this way is shown below. CH3O < benzophenone < C6F6 < nitrobenzene < p-F-nitrobenzene < phthalic anhydride < m-Cl-nitrobenzene < maleic maleic anhydride < naphthoquinone < benzoquinone. . . . By studying many equilibrium transfer reactions of this type, it will be possible to develop a scale of electron affinities for a wide variety of molecules. [56]
This was the first description of the general TCT method for the determination of relative molecular electron affinities. The problem with the scale was the reference point. The lower limit of the scale was established by the experimental value of the methoxy radical, 1.59(5) eV, determined by photodetachment experiments. Because the methoxy radical was generated by dissociative electron attachment, it could not exist in equilibrium with molecular species created by electron transfer. The relative order was correct, but the scale was not. The results were precise, but not accurate. At the time of the experiments the electron affinity of nitrobenzene, hexafluorobenzene, maleic anhydride, and 1.4 benzoquinone had been reported. The values for benzoquinone and maleic anhydride agree with the current EvV. By scaling to these Ea, all values agree with the current values to 0.1 eV. These are (0.8 eV, benzophenone) < (0.9 eV, C6F6) < (1.0 eV, nitrobenzene) < (1.1 eV, p-F-nitrobenzene) < (1.2 eV, phthalic anhydride) < (1.3 eV, m-Cl-nitro- benzene) < (1.4 eV, maleic anhydride) < (1.82 eV, naphthoquinone) < (1.85 eV, benzoquinone). These are independent ICR determinations of the electron affinities for the molecules. The electron affinities were obtained by incrementing the reference values by 0.1 eV and assuming an uncertainty of 0.1 eV. The electron affinity of chloronitrobenzene is the maleic anhydride value, 1.44 eV, decreased by 0.1 eV to yield 1.34(10) eV.
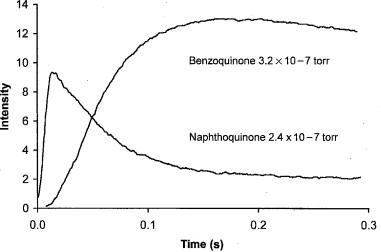
From the known concentrations of the molecules and measured ion abundances, the equilibrium constant for the electron transfer reaction can be obtained. Figure 6.11 presents the kinetic data for thermal charge transfer reactions in the ICR determination. The concentrations of the two molecules have a ratio of BQ/ NQ ¼ 1.33. The rate constant for the electron transfer can be obtained from the initial rise of the BQ intensity and the decline of the NQ intensity. This is reported as approximately 6 10 10 cc/molecule-s. At about 0.15 s, the ratio becomes
118 COMPLEMENTARY EXPERIMENTAL AND THEORETICAL PROCEDURES
Figure 6.11 Ion intensities in an ICR cell containing benzoquinone and naphthoquinone at the indicated pressures, from [56]. The equilibrium constant for electron transfer gives relative electron affinities.
relatively constant and the equilibrium constant can be calculated. It is determined from the concentration ratio and ion ratio as K ¼ [NQ]/[BQ](IBQ/INQ) ¼ 4.4/ 1.33 ¼ 3.2. The original article on the subject stated, ‘‘For the electron transfer
0 |
¼ |
3.2 and |
reaction between naphthoquinone and benzoquinone, we find K |
|
G ¼ RT ln K ¼ 0.7 kcal/mole. Since entropy effects are negligible, the electron affinity of benzoquinone is 0.7 kcal/mole greater than the electron affinity of naphthoquinone.’’ The above Ea reflect these data [56].
In 1983 the HPMS TCT method for determining molecular electron affinities was introduced. It is based on the same fundamental concepts as the ICR method, but the absolute value was anchored to the electron affinity of benzophenone obtained from the ECD. Later, the scale was anchored to the electron affinity of SO2. At present about 300 electron affinities of organic molecules have been determined by the TCT and/or ECD methods [1, 3, 55–59]. The TCT method has been used to measure Ea between 0.50 eV for nitromethane and 3.2 eV for tetracyanoethylene, as shown in Chapter 10.
Many TCT values were determined by both the ion cyclotron resonance (ICR) and high-pressure mass spectrometry (HPMS) variants [3, 55–59]. In the ICR method G values are calculated from measured ion ratios and known concentrations at a single temperature and H obtained by making assumptions about S. For example, in the above study of naphthoquinone and benzoquinone, the entropy changes are assumed to be the same [56]. In the HPMS method measurements are made as a function of temperature so that H and S can be obtained ( H ¼ G þ T S). Good agreement between the independently obtained values
THERMAL CHARGE TRANSFER METHODS |
119 |
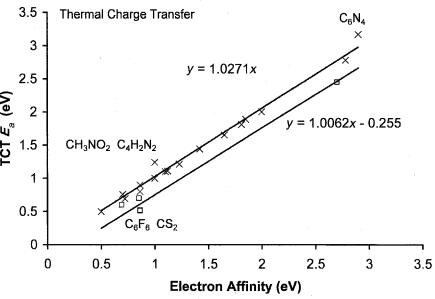
Figure 6.12 Precision and accuracy plot for TCT data. One value for CS2 and one for C6F6 is lower than the current ‘‘best’’ value by 0.3 eV. The value for fluoranil is also lower than the current best value. The random uncertainty in the other values is 0.10 eV.
has been noted. This is especially important because the ICR pressures are about 10 6 torr, whereas the HPMS pressures are about 5 torr. The opportunities for the collisonal deactivation of the ionic reactant are better in HPMS.
The combined random and systematic uncertainties in the absolute values due to the direct measurements and uncertainties in the reference compounds are quoted at0.1 eV for the HPMS method and 0.05 eV from the ICR method. The uncertainties in specific values can be lower or higher. At the extremes the uncertainties in the values can be as large as 0.2 eV. Some of the molecular Ea determined using the ICR and TCT methods are shown in the precision and accuracy plot in Figure 6.12. The ICR value for C6F6 is consistent with the ground-state value of 0.86 0.02 eV obtained from the ECD, NIMS, and PES studies. The data in Figure 6.12 illustrate the precision of the values. The slope of the zero intercept is 1.027(30) and the standard deviation of the values calculated using this equation is 0.1 eV. The largest deviations occur at the extremes. If these are excluded, the standard deviation is reduced to 0.07 eV. The average deviation of the excited-state values is 0.245 eV, confirming the assignments to excited states. The ICR value for fluoroanil (2.45(5) eV), and the HPMS values for C6F6 (0.52(10) eV), CS2 (0.62(10) eV), azulene (0.70(10) eV), and anthracene (0.60(10) eV) are assigned to excited states. The latter two are confirmed by ECD and PES data.
The kinetic method for determining the direction of charge transfer by collisional ionization is based on the competitive dissociation of mass-selected electron
120 COMPLEMENTARY EXPERIMENTAL AND THEORETICAL PROCEDURES
bound ions, M1 M2( ). If we assume that the activation energy for electron transfer is less than that for dissociation, then the relative abundances of the ions are related to the differences in the Ea and the effective temperature of the dimer by Ea ¼ RTeff lnf½M1ð Þ&=½M2ð Þ&g. The effective temperature of the dimer is reported to be over 1200 K by calibrating it to ratios for molecules with measured Ea [60–63].
This method was first applied to relative electron affinities of substituted nitrobenzenes. All but one of these has been measured by HPMS TCT studies. However, the Ea of s-butyl nitrobenzene has only been determined by collisional ionization and is still listed in the NIST tables as 2.17(20) eV. This value is referenced to a ‘‘high’’ value for nitrobenzene and should be about 1 eV lower [60]. The electron affinities of aromatic hydrocarbons have been reported using the collisional ionization method. The value for biphenylene is larger than that obtained from half-wave reduction potentials. The values for pyrene, anthracene, and c-C8H8 are consistent with other reported values, but the values for benzanthracene, coronene, and benzo[ghi]perylene are significantly lower than the largest precise value and are attributed to excited states.
In electron bound complexes of C60 with aromatic hydrocarbons, the intensity of the aromatic hydrocarbon anion from collisional ionization is larger than that for the aromatic hydrocarbon. However, it is known that the adiabatic electron affinities of the aromatic hydrocarbons are significantly lower than that of C60. In these cases the relative intensities were attributed to a localized anion. When the benzanthracene and phenanthrene electron bound dimer is dissociated, the intensity of the phenanthrene anion is only about one-half that of the benzanthracene anion, while the electron affinity of benzanthracene is 0.72 eV and that for phenanthrene is 0.30 eV. The experimental data cannot be disputed. The ion ratio gives a Ea of 0.08 eV or the Ea of benzanthracene ¼ 0.30 þ 0.08 ¼ 0.38(10) eV. Therefore, some other explanation must be presented. In the case of C60 excited anion states are observed and three degenerate LUMO þ 1 are calculated with positive electron affinities. Benzanthracene has an excited-state MO at 0.38 eV that gives an Ea of 0.38 eV. Just as C60 has multiple LUMOs, so also does benzanthracene. Because the collisional ionization values are the most recent, they are returned by a search of the NIST tables for CH molecules. These values are listed in Chapter 10 [61–63].
The TCT method of obtaining relative molecular electron affinities and gas phase acidities has a demonstrated precision of 0.05 to 0.10 eV in the midrange of values from 0.5 eV to 3.0 eV. At the extremes the precision is less,0.2 eV. Most of the TCT Ea are ground-state electron affinities. The exceptions are the HPMS electron affinities determined for azulene, anthracene, C6F6, and CS2, and the ICR value for fluoroanil. The TCT method has been applied to more than 200 molecules. About 30 have been determined by the HPMS and ICR methods and many have been confirmed by the ECD method. Many have also been confirmed by the half-wave reduction potential method and/or solution charge transfer complex spectra. These will be discussed in Chapter 10. The collisional ionization method of measuring relative electron affinities can produce inverted orders of intensities and give excited-state Ea rather than ground-state Ea.
ELECTRON AND PARTICLE BEAM TECHNIQUES |
121 |
6.5ELECTRON AND PARTICLE BEAM TECHNIQUES
The threshold for the reaction of an electron, anion, or alkali metal beam with a molecule to form an anion has been used to measure the electron affinities of molecules and radicals. In this experiment there must be a source for the reactant beam, a source for the test molecule, and a way to measure the onset. The oldest such procedure is the electron impact method in a mass spectrometer source. This gives the vertical electron affinity of the molecule from the peak in ion intensity. The quantity D EaðXÞ is the onset for ion formation. The distribution of the negative ions reveals information about the negative-ion potential energy curve in the Franck Condon region. The measurement of the transmitted electron current as a function of electron energy also gives the vertical electron affinity. The alkali metal beam experiments determine molecular electron affinities from the ionization potential of the metal and the onset of ion pair formation. These also provide the electron affinities of radicals when the threshold is combined with the ionization potential and bond dissociation energy. The difference in the onset for ion pair formation and radical ion formation is the bond dissociation energy [4–6]. The threshold for endothermic electron transfer reactions gives relative electron affinities. Precision is governed by the ability to establish the threshold, whereas accuracy depends on the assignment of the process. The errors in the AMB values are generally postulated to be 0.2 eV, while those of the EnCT method are 0.3 eV. Most of the values obtained using these methods agree with the EvV. For example, the Ea for the diatomic halogen molecules easily agree with the evaluated values within this error [64–66].
The electron impact studies provide the electron affinities of radicals and vertical electron affinities. These have been improved by the use of an electron monochrometer. The observation of a parent negative ion at zero energy is indicative of a positive electron affinity [67]. The identification of an onset for dissociative electron attachment at higher energies gives a value of D EaðXÞ, from which the electron affinity can be determined if D is known. Or alternatively, if the EaðXÞ is known, D can be determined. In addition, the cross-section for anion formation can be determined using electron impact experiments. These data define the vertical electron affinity and slope of a pseudo-two-dimensional curve for the vertical transition. The vertical electron affinity can also be determined in electron transmission spectra. A combination electron transmission and electron impact mass spectrometer now exists that allows the simultaneous determination of both types of data. These data are vital in constructing Morse potential energy curves for dissociative thermal electron attachment.
Experimental data obtained from the electron impact studies of SF6, C6H5Cl, and C6F6 are shown in Figures 6.13 to 6.15 [68–70]. The data for SF6 were obtained in 1979 using a traditional experimental apparatus, whereas the C6H5Cl data are an example of data collected using a combined electron transmission and electron impact source. The observation of a negative-ion peak at zero energy is an indication of a positive adiabatic and vertical ground-state electron affinity. The peak in the cross-section for SF5( ) formation is a measure of an excited-state vertical
122 COMPLEMENTARY EXPERIMENTAL AND THEORETICAL PROCEDURES
Figure 6.13 Electron impact ion intensities for ions from SF6 versus the electron energy, replotted from [68].
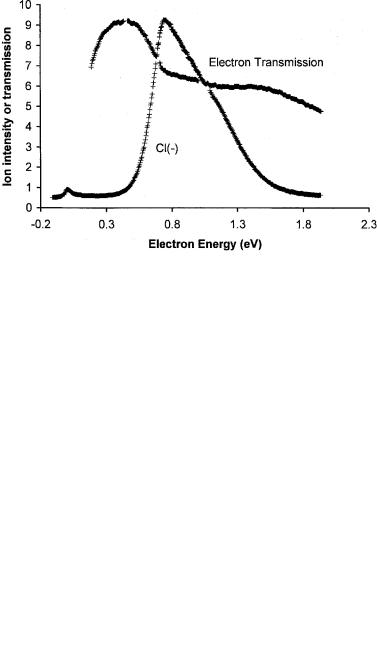
electron affinity. The data for C6H5Cl show a small peak at zero energy. The peak for anion formation at about 0.5 eV is equal to the negative of energy for dissociative electron attachment, EDEA ¼ D Ea(Cl). It gives a value of the C Cl bond dissociation energy of 4.13 eV since the electron affinity of the Cl atom is well
Figure 6.14 Electron impact spectra for Cl( ) from C6H5Cl and simultaneous electron transmission spectra versus the electron energy, replotted from [69].
ELECTRON AND PARTICLE BEAM TECHNIQUES |
123 |
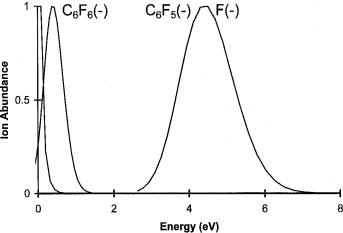
Figure 6.15 Electron impact ion intensities for ions from C6F6 versus the electron energy, replotted from [70].
known. The electron transmission data are reported as a direct signal, not the usual derivative signal. The decline at 0.5 eV is a measure of the vertical electron affinity of an excited state. The electron transmisson experiments can only measure negative vertical electron affinities.
The data for C6F6 indicate a positive vertical and adiabatic electron affinity for the ground state. The presence of a low-lying excited state was observed in other experiments with a vertical electron affinity of 0.4 eV [71]. The higher-energy resonances also result from excited states. These data do not provide direct estimates of the adiabatic electron affinity of a molecule, but have been used to calculate pseudo-two-dimensional Morse potential curves for the molecular anions using data from various sources including the ECD [72].
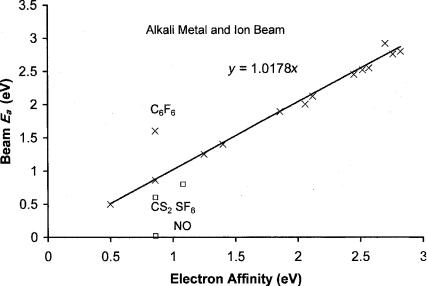
In 1974 the electron affinity of tetracyanoquinodimethane (TCNQ) was reported using the alkali metal beam technique [73]. This confirmed the magnetron determination of 2.8 0.2 eV [2]. A precision and accuracy plot for electron affinities determined using the AMB and EnCT method is shown in Figure 6.16. There are clearly values lower than the evaluated values, specifically SF6, CS2, and NO. The lower values have been assigned to excited states. The value for fluoranil, 2.92(20) eV, is significantly higher than two TCT values. The EnCT value for C6F6 is 1.8(3) eV, significantly higher than other reported values. We do not have an explanation for the high value. The value for C6F5CF3 is 1.7(3). For other fluorinated hydrocarbons the endothermic charge transfer values are the only ones available, but parent negative ions have been observed in swarm beam experiments [23, 64, 74–76].
124 COMPLEMENTARY EXPERIMENTAL AND THEORETICAL PROCEDURES
Figure 6.16 Precision and accuracy plot for AMB and EnCT data. The EnCT value for C6F6 is an outlier and for fluoranil is higher than the current ‘‘best’’ value. The values for CS2, SF6, and NO are significantly lower than the current best value. The random uncertainty in the other values is 0.10 eV.
6.6 CONDENSED PHASE MEASUREMENTS OF ELECTRON AFFINITIES
The Ea from half-wave reduction potential measurements and energies of charge transfer complex absorption in solution support the gas phase measurements from all the cited techniques. The major difference between the gas phase measurements and the solution or solid phase measurements is the interaction between the solvents or solid phase and the anions. These measurements provide a transition between the low values of valence-state electron affinities measured in the gas phase and the negative valence-state electron affinities. Thus, the valence electron affinities for naphthalene and pyridine are 0.17 eV and 0.0 0.2 eV by solution phase techniques [39, 77].
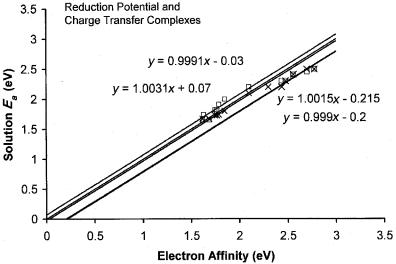
In Figure 6.17 the electron affinities of several substituted quinones determined from E1=2 measurements, and/or charge transfer spectra, are plotted versus the current evaluated gas phase values. They are chosen to give a comparison of the values obtained by the two methods and to note the deviations from the unit slope line. The displacement of the unit slope lines by a constant amount is a systematic uncertainty. This indicates that the solution energy differences and constants used to correlate the charge transfer complex data are both a function of the electron affinity and/or the type of molecules [78]. Thus, it will be possible to reduce deviations by classifying the molecules and identifying the functional relationship.
COMPLEMENTARY THEORETICAL CALCULATIONS |
125 |
Figure 6.17 Precision and accuracy plot for reduction potential and charge transfer complex Ea for various quinones; data published in 1975 [9, 78]. Systematic uncertainties can be identified as shown by parallel lines.
There are many other types of solution data that support the half-wave reduction potential and charge transfer complex data. These include the measurement of cell potentials or equilibrium constants for electron transfer reactions. Another important condensed phase measurement involving a negative ion is the determination of electron spin resonance spectra. In these studies the existence of a stable molecular anion is established and the spin densities can be measured [79]. The condensed phase measurements support the electron affinities in the gas phase and extend the measurements to lower valence-state electron affinities.
6.7COMPLEMENTARY THEORETICAL CALCULATIONS
The underlying physical laws necessary for the mathematical theory of a large part of physics and the whole of chemistry are completely known and the difficulty is only that the application of these laws leads to equations much too complicated to be soluable.
—P. A. M. Dirac
Proceedings of the Royal Society (London)
For the calculation of electron affinities the laws are all known, but it is not possible to rigorously calculate the integrals with exact Hamiltonians and wave functions. It is possible to calculate the electron affinities of some atoms and molecules, but the
126 COMPLEMENTARY EXPERIMENTAL AND THEORETICAL PROCEDURES
problem of obtaining agreement with experiment to chemical accuracy remains (0.04 eV). The possibility of predicting the values of electron affinities by exact quantum mechanical principles continues to be a distant one. Thus, many semiempirical procedures are used to simplify the calculations. In this section the complementary procedures for the theoretical calculation of the electron affinities of atoms, homonuclear diatomic molecules, small molecules, and large organic molecules are briefly discussed. A complete review of theoretical calculations is beyond the scope of this book.
Many of the electron affinities for the elements of the lower main group have been calculated accurately using quantum mechanical procedures. The electron affinity of the hydrogen atom was the first calculated value more accurate than experiment. The electron affinities of elements with large numbers of electrons are not as accurate as experiment. The primary reason for this is electron correlation. This section summarizes the calculation of theoretical atomic electron affinities and the values based on the isoelectronic principle. The simple molecular orbital theory of the homonuclear diatomic molecules is considered. Next, the theoretical effect of geometry will be investigated for triatomic molecules, clusters, and small molecules. Then the theoretical treatment of larger aromatic molecules will be discussed, beginning with the Huckel theory, semi-empirical SCF methods, and closing with a comparison of the ab initio and density functional results for the larger molecules with the CURES-EC procedure.
6.7.1Atomic Electron Affinities
The problem of calculating the electron affinity of an atom consists of evaluating the total energy of the negative ion and the total energy of the neutral atom:
AEa ¼ EðN þ 1Þ EðNÞ |
ð6:2Þ |
where EðN þ 1Þ is the total energy of the ion and EðNÞ the total energy of the atom. For atoms the geometry is the same in the neutral and valence-state anions. For polarization anions, such as those with filled or half-filled orbitals, the distance between the additional electron and the neutral atom can be greater than the average size of the neutral atom. This separation will be the distance at which the polarization attraction is balanced by the repulsion between the two species. The AEa of these atoms will be positive but small. The calculation of valence-state AEa for the remaining elements is more difficult because two ab initio calculations must be carried out and a small difference between large numbers obtained. In addition, unlike the case for the neutral or positive ion, the addition of an electron to the valence shell requires an estimate of the modified correlation energy.
Two general quantum mechanical procedures were applied to the calculation of atomic electron affinities prior to 1960. These were the variational method and Hartree Fock semi-empirical method. Prior to 1960 there were no accurate calculations for elements other than hydrogen. Indeed, only the electron affinities of C and