
Chen The electron capture detector
.pdf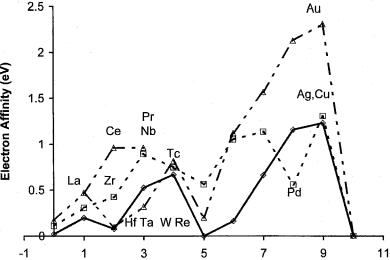
EVALUATION OF ATOMIC ELECTRON AFFINITIES |
177 |
Figure 8.6 Plot of the Ea of the transition elements versus the horizontal number to illustrate the inconsistencies of the electron affinities for Pd and Re.
while the lower value gives 2, which is larger than observed for any other main group element.
The AEa of the d block elements should generally increase across a period with some tendency to increase as one goes down a column. This can be observed in Figure 8.6, where the electron affinities of the elements from IIA (Ca, Sr, Ba) to IIB (Zn, Cd, Hg) are plotted. Two values are plotted for the third block: Ce and Pr approaching from the IIA elements and Re, Ta, W, and Hf approaching from the IIB elements. The inconsistencies suggest interesting characteristics. The ‘‘high’’ value for Nb, Zr, and Tc and the ‘‘low’’ values for Hf, Pd, Ta, and Re based on both horizontal and vertical trends are especially noted. Some of the horizontal inconsistencies in the 5d block are removed if the values of Ce and Pr are considered instead of the values for Hf and Ta. This leaves only the low values for Re and Pd as inconsistencies in both the horizontal and vertical trends. Since these inconsistencies have not been resolved, the periodic trends cannot be used to support complete assignment to the AEa.
The Ea for the d block elements can be supported by theoretical estimates. However, the experience with lanthanides suggests that calculations presently give lower limits to the actual values because of the difficulties of relativity and electron correlation effects. The determination of more precise and accurate experimental values should improve these calculations. For the present the only conclusion that can be reached for the transition elements is that lower limits to the adiabatic electron affinity have been measured and that some of them are equal to the adiabatic electron affinities based on periodic trends.

178 SELECTION, ASSIGNMENT, AND CORRELATIONS OF ATOMIC ELECTRON AFFINITIES
8.3MULLIKEN ELECTRONEGATIVITIES
Now that experimental values for the Ea of almost all the elements have been measured, the Mulliken electronegativities can be calculated from EN ¼ ðIP þ EAÞ=2. These can be correlated with other electronegativities and work functions. Figure 8.7 gives the ionization potentials, electron affinities, and EN tabulated in
Figure 8.7 Electron affinities, ionization potentials, and Mulliken electronegativities of the elements in the form of a Periodic Table. The ionization potentials were taken from [12] and the electronegativity calculated as EN ¼ ðIP þ EaÞ=2.
MULLIKEN ELECTRONEGATIVITIES |
179 |
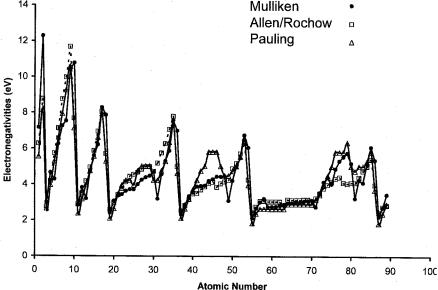
the form of a Periodic Table [12]. In Figure 8.8 the scaled Pauling and Allen Rochow electronegativities and EN are plotted against the atomic number. The Pauling and Allen Rochow electronegativities are scaled to give the minimum deviation from the Mulliken values. The larger values of the Pauling electronegativities of the transition metals, as compared to the Mulliken electronegativities and smaller Allen Rochow values, should be noted. However, the trends in all three scales are consistent. The general trends for the main group elements in all the figures support the assignments of the adiabatic electron affinities of the main group elements. The electronegativities of the d block elements show consistent trends with all three measures of electronegativities and support the assignments for some of the Ea to the ground state.
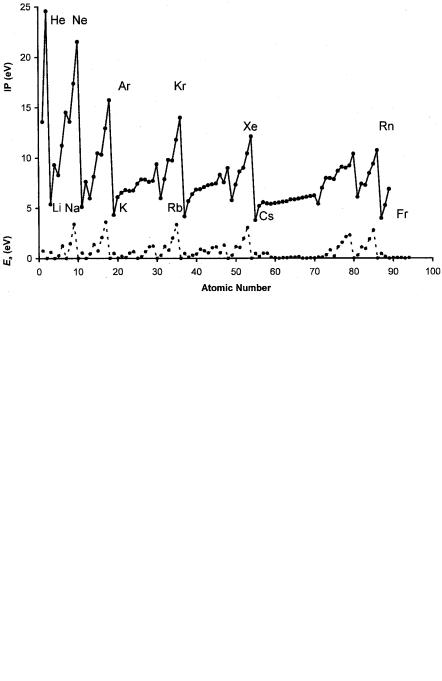
Ionization potentials are plotted against the atomic number in Figure 8.9. When we compare the ionization potential plot in Figure 8.9 with the electron affinity plot, the most striking difference is the range of values. For the electron affinities the values go from 0þ for many elements to 3.61 eV for Cl. The ionization potentials range from 3.89 eV for Cs to 24.59 eV for He. The Ea for Cs is 0.47 eV, while that for He is 0þ. The periodic trends for the electronegativities, ionization potentials, and work functions are apparent. In Figure 8.10 the work functions and Mulliken EN are plotted against the atomic number, with EN replacing the work function for those elements with unmeasured work functions. Figure 8.10 easily visualizes the correspondence between the work functions and Mulliken electronegativities.
Figure 8.8 Plots of the Mulliken, scaled Pauling, and scaled Allen Rochow electronegativities of the elements versus the atomic number to illustrate the consistency and differences between the measures of electronegativity [41, 42].
180 SELECTION, ASSIGNMENT, AND CORRELATIONS OF ATOMIC ELECTRON AFFINITIES
Figure 8.9 Plots of the Ea and IP of the elements versus the atomic number to illustrate the consistency of the IP of a given family and across a period (compare with Figure 8.8).
Figure 8.10 Plots of the Mulliken, electronegativities, and work functions of the elements versus the atomic number to illustrate their consistency and differences [43, 44].

MULLIKEN ELECTRONEGATIVITIES |
181 |
Figure 8.11 Plots of the work function versus the Mulliken electronegativities of the elements to illustrate the constant displacements of groups to determine P ¼ EN-WF [43, 44].
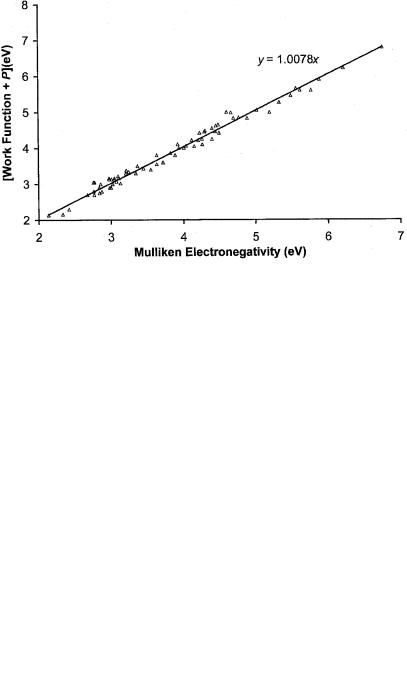
The work functions of the metals are directly related to Mulliken electronegativity. Figure 8.11 is a plot of the experimental work functions of a series of metals against Mulliken electronegativity. In 1978 a systematic investigation of the relationship between electronegativities and work functions was carried out using a constant displacement of the members of different groups of elements [44, 45]. The equation was EN ¼ WF þ P. The quantity P was defined as the periodicity parameter and assigned to 1 of 10-values: 0.3, 0.2, 0.1, 0, 0.2, 0.3, 0.4,0.6, 0.7, and 1.0 eV. By examining Figure 8.11, which is based on additional data for both electron affinities and work functions, five values for P can now be determined: 0.9, 0.5, 0.5, 0.2, and 0.0. The intercepts are fixed at 0.2, 0.5, 0,0.5, and 0.9 and the slopes determined by a linear regression. The slopes are all approximately 1. Twenty-eight of the elements have P ¼ 0. The Group IIIA elements and several 3d elements have P ¼ 0:9. The P ¼ 0:5 group consists of transition elements, Hf, and Tl. The P ¼ 0:2 group consists of Mg, Ca, Rb, Sr, Cd, Y, Ag, Sm, and Yb. Zn, Sb, Te, Eu, Au, and Hg are in the P ¼ 0:5 group. These P values can be used to predict the work function of Tc as 4.6(1) eV. The Mulliken electronegativities are an approximation to the work functions. The corrected values of the work function are plotted against the EN values in Figure 8.12. This is an example of how species can be classified to obtain additional fundamental information. It is similar to the classification of molecules to estimate solution energy differences to obtain Ea from half-wave reduction potentials.
182 SELECTION, ASSIGNMENT, AND CORRELATIONS OF ATOMIC ELECTRON AFFINITIES
Figure 8.12 Plot of the work function þP versus the Mulliken electronegativities of the elements [43, 44].
The P values for the larger set of data are compared to the earlier ones in Table 8.3. Figure 8.13 is a plot of the P values versus the atomic number. Except for Li, Be, and B, there are no data plotted for the first row atoms. The abnormalities can be noted in Table 8.3. The P for Be is 0.0 eV, but the other Group IIA
Figure 8.13 Plot of -P versus atomic number to illustrate the consistency of the values for families of elements.

|
|
|
|
MULLIKEN ELECTRONEGATIVITIES |
183 |
||
TABLE 8.3 Values of P (in eV) to Relate Work Functions and Mulliken |
|
||||||
Electronegativities [12, 45] |
|
|
|
|
|
||
|
|
|
|
|
|
|
|
Atom |
N |
P |
P ½45& |
Atom |
N |
P |
P ½44& |
Zn |
30 |
0.50 |
0.20 |
Tb |
65 |
0.00 |
— |
Sb |
51 |
0.50 |
— |
Dy |
66 |
0.00 |
— |
Te |
52 |
0.50 |
0.50 |
Ho |
67 |
0.00 |
— |
Eu |
63 |
0.50 |
— |
Er |
68 |
0.00 |
— |
Au |
79 |
0.50 |
0.20 |
Tm |
69 |
0.00 |
— |
Hg |
80 |
0.50 |
0.20 |
W |
74 |
0.00 |
0.60 |
Mg |
12 |
0.20 |
0.00 |
Os |
76 |
0.00 |
0.40 |
Ca |
20 |
0.20 |
0.00 |
Ir |
77 |
0.00 |
0.40 |
Sr |
38 |
0.20 |
0.00 |
Pt |
78 |
0.00 |
0.40 |
Y |
39 |
0.20 |
0.20 |
Pb |
82 |
0.00 |
0.20 |
Ag |
47 |
0.20 |
0.20 |
Bi |
83 |
0.00 |
0.10 |
Cd |
48 |
0.20 |
0.20 |
V |
23 |
0.50 |
0.30 |
Sm |
62 |
0.20 |
— |
Mn |
25 |
0.50 |
0.70 |
Yb |
70 |
0.20 |
— |
Fe |
26 |
0.50 |
0.40 |
Li |
3 |
0.00 |
0.10 |
Nb |
41 |
0.50 |
0.30 |
Be |
4 |
0.00 |
0.00 |
Mo |
42 |
0.50 |
0.60 |
B |
5 |
0.00 |
0.10 |
Tc |
43 |
0.50 |
0.70 |
Na |
11 |
0.00 |
0.10 |
Ru |
44 |
0.50 |
0.40 |
Si |
14 |
0.00 |
— |
Rh |
45 |
0.50 |
0.40 |
K |
19 |
0.00 |
0.10 |
Pd |
46 |
0.50 |
0.40 |
Sc |
21 |
0.00 |
0.20 |
La |
57 |
0.50 |
0.20 |
Ge |
32 |
0.00 |
0.20 |
Nd |
60 |
0.50 |
— |
Cu |
29 |
0.00 |
0.20 |
Lu |
71 |
0.50 |
— |
As |
33 |
0.00 |
0.10 |
Hf |
72 |
0.50 |
0.6 |
Se |
34 |
0.00 |
0.30 |
Tl |
81 |
0.50 |
1.0 |
Rb |
37 |
0.00 |
0.10 |
Al |
13 |
0.90 |
1.0 |
Sn |
50 |
0.00 |
0.20 |
Ti |
22 |
0.90 |
0.6 |
I |
53 |
0.00 |
— |
Cr |
24 |
0.90 |
0.6 |
Cs |
55 |
0.00 |
0.10 |
Co |
27 |
0.90 |
0.4 |
Ba |
56 |
0.00 |
0.00 |
Ni |
28 |
0.90 |
0.4 |
Ce |
58 |
0.00 |
— |
Ga |
31 |
0.90 |
1.0 |
Pr |
59 |
0.00 |
— |
In |
49 |
0.90 |
1.0 |
Pm |
61 |
0.00 |
— |
Ta |
73 |
0.90 |
0.3 |
Gd |
64 |
0.00 |
— |
Re |
75 |
0.90 |
0.7 |
WF ¼ 0:5ðIP þ EaÞ P
elements have P ¼ 0:2. Even with a different P value the calculated EN of Be is more than 0.3 eV lower than the ‘‘best’’ value. The Group IIB elements belong to two groups. The electron affinity of Be, Zn, Cd, and Hg was set to zero in calculating the Mulliken electronegativity. Among the Group IVA elements the value of P ¼ 0 for Ge gives a larger deviation of 0.2 eV than for the other Group IVA elements. The work function of carbon must be modified by the band gap energy to be equated to the Mulliken EN. For the most part the value of P is constant for
184 SELECTION, ASSIGNMENT, AND CORRELATIONS OF ATOMIC ELECTRON AFFINITIES
elements in a given column. This could possibly be the physical significance of the P parameter if there is in fact one [44].
8.4ELECTRON AFFINITIES OF ATOMIC CLUSTERS
One of the major applications of the CURES-EC procedure has been in calculating the electron affinities of the carbon clusters Cn [46]. Carbon clusters are common species in nature, since they are a product of combustion and contribute to environmental problems. They have been observed in the interstellar medium. The fullerenes represent one of the most recent discoveries of a new form of carbon. Carbon clusters have many forms—linear chains, cyclic compounds and the fullerenes— because carbon can form covalent bonds. The NIST tables give 54 electron affinities values for Cn; 14 for Sin; 17 for Gen; 45 for Snn; and 55 for Pbn. Only the structures for the carbon compounds from n ¼ 3 to 30 are identified [12].
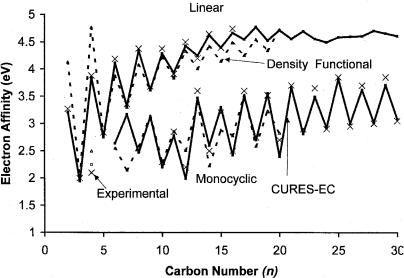
The linear forms of Cn are more stable for n ¼ 1 to 12. Above C10, the monocyclic forms are more stable. The observed Ea for the linear species range from 2.0 eV to about 4.8 eV, while the values for the monocyclic compounds range from 2.0 eV to about 3.9 eV. The uncertainty of the Ea for the linear n ¼ 2 to 9 and 11 is 0.01 to 0.02 eV. The other values are less precise, with uncertainties of 0.1 eV. Both the linear and cyclic forms show an even odd alternation with the even-numbered clusters having the larger electron affinity for the linear form and the odd-numbered clusters having the larger value for the ring structures. The differences are much larger than the uncertainty in the experimental values. This is partially due to the fact that the ground state for the even-numbered linear
clusters from 4 to 20 is the 3 |
g state, while that for the odd numbered clusters is the |
|
|
P |
|
1 |
gþ state. The bond alternation is observed in Figure 8.14, where the experimental |
|
values are shown as X’s. The linear forms are at the top of the graph, while the cyclic forms appear at the bottom [47–49].
The experimental and theoretical data for the anions of carbon clusters were reviewed in 1999 [50]. Earlier theoretical studies concentrated on the linear clusters up to C10. There were limited studies of the cyclic structures. During 2002 two studies focused on the density functional calculations for n ¼ 3 to 13 and 2 to 20 [51, 52]. In 1999 the CURES-EC method was applied to the linear clusters for n ¼ 2 to 30 and cyclic structures for n ¼ 4, 10 to 30. Table 8.4 gives the results of these calculations and additional calculated values for the cyclic C6–9. These are compared to the experimental values, density functional values, and earlier theoretical values. In Figure 8.14 the dotted lines represent the density functional values and the solid lines the CURES-EC values. The CURES-EC values are plotted in Figure 8.15 with the experimental values for the linear chains. The cyclic structures would merge with the data for Si, Ge, Sn, and Pb. The very good agreement between the experimental and CURES-EC values is easily seen. The agreement between the CURES-EC values for the cyclic clusters is not as good as for the linear clusters, but it is better than for the density functional values, as shown in Figure 8.14. The
ELECTRON AFFINITIES OF ATOMIC CLUSTERS |
185 |
Figure 8.14 Plot of experimental and theoretical electron affinities of carbon clusters for cyclic and linear molecules versus number of carbon atoms. The experimental data are from [45–49], the theoretical values from [45, 50, and 51].
largest absolute deviation in the values is 0.3 eV for cyclic C20. It is possible that this large difference results from the isomers of this compound. In addition, the uncertainty in the experimental values is much larger, partially due to the use of the maximum in the photoelectron spectroscopy peaks as the electron affinity.
The density functional values for cyclic C2, C4, and C8 are significantly different from those of the CURES-EC. The PM3 values, not shown, give good agreement with the experimental values up to C10 but the deviations for C12 and C13 are about 0.5 eV. The use of modified electron correlation improves the agreement. The standard deviation between the CURES-EC and experimental values is 0.06 eV. Without the clear outliers for density functional values the standard deviation is 0.2 eV. The CURES-EC values cover a wider range of complexes and agree better with experiment.
The values for the cyclic C5 to C9 and linear C18 to C30 complexes are predictions. Even numbered carbon clusters containing from 32 to 92 carbon atoms have been observed with electron affinities between 3.0 eV and 3.6 eV, the same as the range for the cyclic clusters. The structure of these compounds is unspecified. The Ea of the C92 cluster is 3.0 eV, while the maximum value of 3.6 eV lies in the C50 to C60 range. The odd-numbered clusters reach a maximum of 3.85 eV at C29. The only other Ea reported for an odd-numbered cluster is 3.40 eV for C59. Regardless, the limiting value for the linear clusters (4.75–5 eV) is higher than that for the cyclic clusters (3.0–3.6 eV). The work function of graphite (4.6 eV) is about the same as the limiting value for the linear chains, and less than the value for the Mulliken electronegativity, 6.26 eV.

186 SELECTION, ASSIGNMENT, AND CORRELATIONS OF ATOMIC ELECTRON AFFINITIES
TABLE 8.4 Experimental, CURES-EC, and Density Functional Electron Affinities (in eV) of Carbon Clusters, n ¼ 2 to 30 [45–51]
|
|
Linear |
|
|
|
Monocyclic |
|
|
|
|
|
|
|
|
|
|
|
n |
Exp |
CEC |
DF |
|
Exp |
CEC |
DF |
|
|
|
|
|
|
|
|
|
|
2 |
3.27 |
3.21 |
4.13 |
|
— |
— |
— |
|
3 |
2.00 |
1.94 |
2.03 |
|
— |
— |
— |
|
4 |
3.88 |
3.85 |
4.77 |
2.1 |
2.25 |
2.5 |
|
|
5 |
2.84 |
2.75 |
2.82 |
|
— |
— |
— |
|
6 |
4.19 |
4.12 |
3.88 |
|
— |
2.64 |
2.55 |
|
7 |
3.36 |
3.32 |
3.30 |
|
— |
3.17 |
2.15 |
|
8 |
4.38 |
4.35 |
4.08 |
|
— |
2.47 |
2.59 |
|
9 |
3.68 |
3.62 |
3.62 |
|
— |
3.13 |
3.14 |
|
10 |
4.38 |
4.29 |
4.22 |
2.30 |
2.20 |
2.30 |
|
|
11 |
3.91 |
3.93 |
3.84 |
2.85 |
2.78 |
2.85 |
|
|
12 |
4.5 |
4.43 |
4.33 |
2.20 |
1.99 |
2.51 |
|
|
13 |
4.20 |
4.25 |
4.01 |
3.60 |
3.47 |
3.39 |
|
|
14 |
4.65 |
4.63 |
4.42 |
2.50 |
2.60 |
2.23 |
|
|
15 |
4.40 |
4.40 |
4.15 |
3.20 |
3.30 |
2.88 |
|
|
16 |
4.75 |
4.67 |
4.49 |
2.50 |
2.42 |
2.78 |
|
|
17 |
— |
4.55 |
4.26 |
3.60 |
3.51 |
3.52 |
|
|
18 |
— |
4.78 |
4.55 |
2.75 |
2.7 |
2.59 |
|
|
19 |
— |
4.53 |
4.35 |
3.52 |
3.55 |
3.23 |
|
|
20 |
— |
4.72 |
4.73 |
2.70 |
2.39 |
2.83 |
|
|
21 |
— |
4.56 |
— |
3.70 |
3.67 |
— |
||
22 |
— |
4.70 |
— |
2.90 |
2.81 |
— |
||
23 |
— |
4.56 |
— |
3.65 |
3.49 |
— |
||
24 |
— |
4.50 |
— |
2.90 |
2.92 |
— |
||
25 |
— |
4.59 |
— |
3.85 |
3.82 |
— |
||
26 |
— |
4.60 |
— |
2.95 |
3.00 |
— |
||
27 |
— |
4.61 |
— |
3.70 |
3.62 |
— |
||
28 |
— |
4.71 |
— |
3.00 |
3.02 |
— |
||
29 |
— |
4.66 |
— |
3.85 |
3.71 |
— |
||
30 |
— |
4.61 |
— |
3.05 |
3.08 |
— |
||
|
|
|
|
|
|
|
|
|
The trends for the electron affinities of carbon might also be expected for the clusters of Si, Ge, Sn, and Pb. Table 8.5 lists the electron affinities for some of the lower clusters of these elements. These are plotted versus the number of atoms in Figure 8.15 [53–55]. The general shape of these curves is similar to that for the cyclic Cn compounds, but with less regularity in the alternation. The values for the other Group IV elements level off at about 2.5 to 3.0 up to n ¼ 20. At higher n the electron affinities generally remain the same for Ge to Pb. At n ¼ 45 the Sn value is 3.010 eV, while the Pb value is 2.630 eV. None of the values reach the Mulliken electronegativity or experimental work functions. The Pb value is 3.18(14) eV for n > 200. It has been extrapolated to the work function of Pb,
