

Chen The electron capture detector
.pdfREFERENCES 7
22.Wentworth, W. E. J. Chem. Ed. 1965, 42, 96.
23.Wentworth, W. E. J. Chem. Ed. 1965, 42, 162.
24.Szent-Gyo¨rgi, A. Introduction to a Submolecular Biology. New York: Academic Press,
1960.
25.National Institute of Standards and Technology (NIST). Chemistry WebBook, 2003. Available at http://webbook.nist.gov.
26.The names and events given in this brief chronological history were searched on the Internet. Thales of Miletus electron gives the derivation of the word ‘‘electron,’’ whereas J. Thomson electron offers a complete slideshow on the ‘‘discovery of the electron.’’
27.Thompson, J. J. Philosoph. Mag., 1897, 44, 293, and Thompson, J. and Thompson, G. P. Conduction of Electrons Through Gases, Dover reprint, New York: Vol. 1, 1928, Vol. 2,
1933.
28.Lewis, G. N. Valence and the Structure of Atoms and Molecules. New York: Chemical Catalog Co. 1923.
29.Pauling, L. The Nature of the Chemical Bond, 3rd ed. Ithaca, NY: Cornell University Press,
1960.

 CHAPTER 2
Definitions, Nomenclature, Reactions,
and Equations
2.1INTRODUCTION
The objectives of this chapter are:
1.To define the generally accepted terms applicable to thermal electron reactions. This nomenclature is used specifically in our work.
2.To classify reactions of thermal electrons and negative ions.
3.To describe experiments used to study these reactions.
4.To present the equations relating half-wave reduction potentials and charge transfer absorption spectra to electron affinities.
5.To describe a semi-empirical procedure for quantum mechanical calculations of electron affinities.
6.To present fundamental relationships for the calculation of Morse potentials.
7.To classify negative-ion Morse potentials based on fundamental data.
2.2DEFINITION OF KINETIC AND ENERGY TERMS
Two energy terms applicable to thermal electron reactions referenced to the ground state of the neutral are the electron affinity Ea and the vertical electron affinity VEa. Ea is the difference in energy between the most stable state of the neutral and a specific state of a negative ion. VEa is the difference in energy between the anion and neutral species in the geometry of the neutral. The anion can be temporary and relax to either the ground state, an excited valence-state anion, or dissociate.
Each state will have an Ea and a VEa. By convention Ea are positive when the anion is more stable than the neutral. It was once believed that only one bound
The Electron Capture Detector and the Study of Reactions with Thermal Electrons by E. C. M. Chen and E. S. D. Chen
ISBN 0-471-32622-4 # 2004 John Wiley & Sons, Inc.
8
DEFINITION OF KINETIC AND ENERGY TERMS |
9 |
anion state could exist. However, multiple bound states for anions have been observed. The ground-state or adiabatic Ea, AEa, is the difference in energy between the anion and the neutral when each exists in its most stable state. It is the largest Ea by definition. Since electrons are attracted to all elements, even helium, by ionic polarization forces, the AEa is always positive. The AEa should be greater than the bond energy of He2, where only van der Waal attractions are present. Short-range or valence-state electron affinities can be either negative or positive. When all the valence-state electron affinities, or simply Ea, are negative, the balance between the short-range repulsion and long-range attractions determines the AEa. Molecules with a large dipole moment can form a stable dipole bound (DB) state in the same geometry as the neutral. These DBEA are generally less than 200 meV. All molecules will be bound to electrons by polarization forces leading to a polarization electron affinity PEa. These are smaller than DBEA.
The energy required to eject an electron from the negative ion in its most stable configuration is the photodetachment energy Epd. The reorganization energy Err is equal to the vertical electron affinity minus electron affinity for the same state. The AEa for benzene is a small positive value. The excited state VEa is 1.13 eV and the Ea is 0.78 eV, so Err is 0.35 eV. For naphthalene the VEa is 0.20 eV and the AEa is 0.16 eV, yielding an Err of 0.36 eV. In diatomic molecules there is only one geometrical parameter, the internuclear distance. In polyatomic molecules the energies refer to the completely optimized geometries. These quantities are defined for all states.
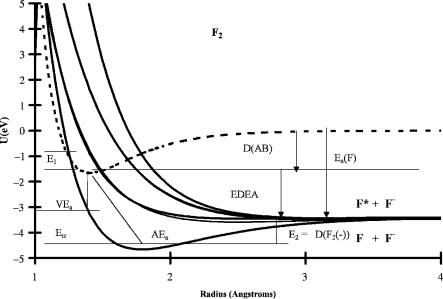
The electron affinities and reorganization energies are illustrated for F2 in Figure 2.1, where semi-empirical Morse potentials for the neutral and negative ions are presented. The properties of the ground-state negative ion have been measured. The vertical electron affinity has been obtained from the solution charge transfer energy ECT. The activation energy for thermal electron attachment has been measured using the electron capture detector (ECD). The dissociation energies of the excited states are obtained through the isoelectronic principle by analogy to the rare gas positive ions. The other parameters for the excited states are obtained from the absorption spectra, or E(abs), of the anion and electron impact (EI) spectra for the formation of the fluorine ion by monoenergetic electrons. The procedures for calculating these types of curves will be discussed in Chapter 7 [1].
Nondissociative electron attachment and detachment are general terms that refer to the process whereby an electron eð Þ reacts with a molecule AB to form the molecular negative ion ABð Þ and the reverse process whereby the electron is removed. It is also designated as the molecular anion formation:
e |
ð Þ þ |
AB |
k1 |
AB |
ð Þ |
ð |
2:1 and 2:2 |
Þ |
|
|
,1 |
|
|
||||
|
|
|
k |
|
|
|
|
|
|
|
|
|
|
|
|
|
|
For thermal electrons nondissociative reactions will take place in the typical temperature range of the ECD when the quantity DAB EaðBÞ is greater than about 1.5 eV, where DAB is the bond dissociation energy and EaðBÞ the electron affinity of the dissociated species. This quantity is defined as minus the energy for
10 DEFINITIONS, NOMENCLATURE, REACTIONS, AND EQUATIONS
Figure 2.1 Morse potential energy curves for the neutral and negative-ion states of F2. The vertical electron affinity VEa, adiabatic electron affinity AEa, activation energy for thermal electron attachment E1, Err ¼ AEa VEa, EDEA ¼ EaðFÞ DðFFÞ, and dissociation energy of the anion E2 are shown.
dissociative electron attachment, or EDEA. Aromatic hydrocarbons, such as anthracene, undergo nondissociative thermal electron attachment reactions sinceEDEA ¼ 4.5 1.5 eV ¼ 3.0 eV. This can be seen in Figure 2.2, where the neutral and negative ion curves are shown in pseudo-two-dimensional Morse potential energy curves. The activation energy to form the ground state is greater than that which forms the first excited state. The rearrangement energy for the ground state is smaller than that for the excited states [2, 3].
The word ‘‘attachment’’ implies that the molecule holds the electron loosely. This is only true for the initial interaction since the added valence-state electron generally resides in the lowest unoccupied molecular orbital (LUMO) of AB. The first step is the loose attachment of the electron to the molecule at a large distance and the second step stabilization to the ground state. The overall rate constant for the formation of the ground state consists of two terms, one of which is dependent on the specific bath gas and the potential relaxation modes of the initial anion. The rate constants for the forward and reverse process are k1 and k 1 [k1 ¼ A1T 1=2 expð E1=RTÞ and k 1 ¼ A 1T expð E 1=RTÞ] with activation energies E1 and E 1. The ratio k1=k 1 is the equilibrium constant Keq for the thermal electron attachment reaction and the reaction energy at 0 K is Ea ¼ E1 þ E 1. Thus, it is possible to determine the electron affinity Ea of the molecule using the ECD. In some experiments, those involving k1, the rate constants for the forward reaction

DEFINITION OF KINETIC AND ENERGY TERMS |
11 |
Figure 2.2 Morse potential energy curves for the neutral and negative-ion states of anthracene. The vertical electron affinity VEa, adiabatic electron affinity AEa, and activation energy for thermal electron attachment E1 are shown. The two Ea are 0.68 eV and 0.53 eV observed in ECD data. There will be nine other negative ion curves, yielding a total of thirteen anion curves, four each for the different C H bonds and a polarization curve. Some of these will be accidentally degenerate.
alone can be determined. The activation energy for electron attachment to F2 is shown in Figure 2.1.
In the event that the combination of the electron and molecule have energies greater than required to form a fragment negative ion Bð Þ, direct dissociation can take place:
k12 |
ð2:3Þ |
eð Þ þ AB ! A þ Bð Þ |
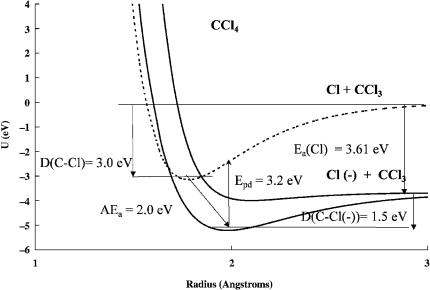
The rate constant for this process is designated as k12 for unimolecular dissociation. The kinetic expression is the same as for direct attachment so that this can also be designated as k1. Activation energies for this reaction with thermal electrons have been measured in the ECD and are as large as 0.5 eV to 0.8 eV. With electron beam studies the distribution of the dissociated ions is measured as a function of electron energy to yield energy-dependent cross-sections. In electron swarms cross-sections can be measured as a function of the average energy of electrons in an electric field. Thermal electron reactions with chlorinated methanes are examples of this type of reaction. This will occur when the bond dissociation energy is less than the Ea of the dissociating species by about 15 kcal/mole or 0.7 eV. In Figure 2.3 this
12 DEFINITIONS, NOMENCLATURE, REACTIONS, AND EQUATIONS
Figure 2.3 Morse potential energy curves for the neutral and negative-ion states of CCl4. The new quantity illustrated in this figure is photodetachment energy. It is larger than AEa and is the peak in the photodetachment spectrum. Thermal electron attachment is exothermic, that is, EDEA ¼ a positive quantity. Two other states dissociating to Cl þ CCl3ð Þ and the polarization curve are not shown.
is illustrated for CCl4. The quantity EDEA is 0.61 eV. Two other curves that dissociate to the limit CCl3( ) þ Cl are not shown. The activation energy for thermal electron attachment is about zero since the negative-ion curve crosses the neutral curve at the internuclear distance of the neutral [4].
Another mode of dissociation occurs via an intermediate molecular ion:
k2 |
ð2:4Þ |
eð Þ þ AB , ABð Þ ! A þ Bð Þ |
The rate constant for this dissociation is k2: k2 ¼ A2T expð E2=RTÞ. The preexponential term ðA2TÞ for these rate constants is one of the largest observed pseudo-Arrhenius terms. Activation energies as large as 40 kcal/mole have been measured in the ECD for fluoronitrobenzenes [5].
The major reactions for the permanent loss of electrons and negative ions recombine with positive ions. These reactions are given as
kD0
eð Þ þ P ! Neutrals
and
kN0
ABð Þ or Bð Þ þ P ! Neutrals
ð2:5Þ
ð2:6Þ
DEFINITION OF KINETIC AND ENERGY TERMS |
13 |
At atmospheric pressure and in the presence of an unchanging concentration of positive ions P, the bimolecular rate constants can be replaced by pseudounimolecular rate constants kD ¼ kD0 ½P& and kN ¼ kN0 ½P&. These are approximately temperature-independent because recombination is exothermic since the energy is Ea IP.
Other experimental procedures measure the energetics and kinetics of thermal electron reactions in the same manner as the ECD and NIMS. These are designated equilibrium methods. The direct capture magnetron method (MGN) and the individual determination of the individual rate constants k1 and k 1 for thermal electron reactions are also equilibrium methods. The latter was first carried out in an electron swarm (ES) for O2, but can be applied to any system to measure thermal electron reactions. These methods differ in how the electron and ion concentrations are generated and measured [6, 7].
The equilibrium methods are based on the measurement of the equilibrium constant Keq for the thermal electron reactions since the energy of reaction at 0 K is Ea ¼ E1 þ E 1. The ratio k1=k 1 is the equilibrium constant
e |
þ |
AB |
k1 AB |
ð |
2:1 and 2:2 |
Þ |
|
|
,1 |
|
|||
|
|
|
k |
|
|
|
|
|
|
|
|
|
|
Keq ¼ k1=k 1 ¼ ½gðAð ÞÞ=fgðAÞgðeð ÞÞg& expðEa=RTÞ |
|
ð2:7Þ |
||||
The gðAð ÞÞ; gðAÞ, and gðeð ÞÞ are the partition functions of the respective
species: |
|
Keq ¼ h3=ð2pmekTÞ3=2Qan expðEa=RTÞ |
ð2:8Þ |
Taking logs and multiplying through by T3=2, we obtain |
|
ln Keq T3=2 ¼ ln½h3=ð2pmekÞ3=2& þ ln½Qan& þ Ea=RT |
ð2:9Þ |
¼ 12:43 þ ln½Qan& þ Ea=RT |
ð2:10Þ |
The value of 12.43 is calculated from fundamental constants h, k, and me. Qan is the ratio of the partition functions of the anion and neutral with the spin multiplicity of the anion canceling that of the electron.
The electron capture coefficient is the experimental molar response of the ECD normalized to a constant concentration of electrons. This concentration may change
because of changes |
in |
impurities |
in the |
carrier gas. |
It is best to minimize |
the changes, but if |
it |
is assumed |
that |
the reactions |
of the impurities only |
reduce the concentration of electrons and do not react with the specific test molecule, the correction is simply a multiplication factor. The electron capture coefficient KECD is calculated from the concentrations of the electrons Ib in the absence of the test molecule, the concentration of the electrons in the presence of the test

14 DEFINITIONS, NOMENCLATURE, REACTIONS, AND EQUATIONS
molecule Ie, and the concentration of the capturing species [AB]. The corresponding equation is
Ib2 Ie2 |
¼ |
K |
ECD½ |
AB |
& |
ð |
2:11 |
Þ |
|||||
IeIb |
|
|
|
|
|
|
|||||||
At the limit of low capture, Ib ¼ Ie, giving |
|
|
|
|
|
|
|
|
|||||
Ib2 Ie2 ¼ ðIb IeÞðIb þ IeÞ ¼ 2IbðIb IeÞ |
ð2:12Þ |
||||||||||||
and equation 2.11 becomes |
|
|
|
|
|
|
|
|
|
|
|
|
|
Ib Ie |
¼ |
K |
ECD½ |
AB |
=2 |
ð |
2:13 |
Þ |
|||||
Ie |
|
|
|
& |
|
|
|
||||||
The electron capture coefficient KECD is related to the fundamental rate constants defined in reactions 2.1 to 2.6, as will be seen in the kinetic model of the ECD and NIMS. The affinity of molecules for electrons and electron capture ability have been loosely used to describe the response of the ECD. These refer to the sensitivity of a molecule in the ECD regardless of the process. Molecules can have a high response for electrons in the ECD without having a high electron affinity. Likewise, some molecules with high electron affinities such as benzoquinone have a low ECD response. The upper limit to the response of the ECD response is based on the DeBroglie wavelength of the electron. The maximum value of A1 for the reactions with thermal electrons is the DeBroglie A1 value (DeBA). The value of ln(DeBA) is about 36 at 400 K [4].
The measurement of the equilibrium constant as a function of temperature leads to an absolute value of the electron affinity. The magnetron technique was the first to obtain accurate electron affinities of organic molecules. Some of the MGN values for quinones are for excited states [4, 7]. Of these techniques, the ECD method has been applied to the greatest number of molecules. In cases where sufficient data exist in the equilibrium region, such as for acetophenone, the electron affinities can be measured to a precision of 2 meV. Both the ground and excited states of hexafluorobenzene and carbon disulfide have been observed in a single ECD experiment. The measurement of the temperature dependence of ions by NIMS can lead to accurate and precise Ea. The mere observation of a negative ion is evidence of the positive electron affinity of a molecule. This has not been utilized extensively, but there is a large body of unanalyzed published data [8]. The addition of an electron monochrometer source to a GC/NIMS makes this observation possible at thermal energies [9].
One of the early confirmations of the ECD model was based on the agreement of the ECD measurements for the rate constants and activation energies for thermal electron attachment to SF6 and C7F14 with the values obtained using the microwave method. In the interim other methods have been developed. Indeed, the determination of the rate constants as a function of both electron energy and temperature has been achieved [10–15].
ADDITIONAL GAS PHASE IONIC REACTIONS |
15 |
2.3ADDITIONAL GAS PHASE IONIC REACTIONS
The first experimental observation of negative ions in the gas phase used the parabola mass spectrometer described by J. J. Thompson [16]. Thus, the halogens sulfur, hydrogen, and oxygen form negative ions, whereas nitrogen and the rare gases do not. Few definitive properties of negative ions were determined before 1950. The only electron affinities in the 1953 review article by H. O. Pritchard [17] matching the current ‘‘best’’ values were identified for F, Cl, Br, I, and CN.
In the second half of the twentieth century four experimental techniques were developed to measure Ea: the equilibrium, the photon, the beam, and the thermal charge transfer methods [4, 18–29]. In addition to the above reactions observed in the ECD and NIMS, negative ions can be formed in other reactions and complementary energetics and kinetics determined. The ECD and NIMS results have been integrated and compared with data obtained from other studies [4]:
|
|
|
|
AB |
ð Þ þ |
CD kET |
AB |
þ |
CD |
ð Þ |
Electron transfer |
ð |
2:14 |
Þ |
|||||||
|
|
|
|
|
|
, |
|
|
|
|
|
|
|
|
|||||||
|
|
|
|
|
|
|
|
k |
ET |
|
|
|
|
|
|
|
|
|
|
|
|
|
|
|
|
|
|
|
|
|
|
|
|
|
|
|
|
|
|
|
|
|
|
AB |
þ |
e |
ð Þ |
or M or |
hn kIP |
P |
ðþÞ þ |
B |
ð Þ |
Ion pair formation |
ð |
2:15 |
Þ |
||||||||
|
|
|
|
|
|
! |
|
|
|
|
|
||||||||||
|
|
|
|
|
|
|
|
k12 |
|
|
|
|
|
|
|
|
|
ð2:16Þ |
|||
|
|
|
|
eð ÞðhyperÞ þ AB ! A þ Bð Þ |
|
|
Electron impact |
||||||||||||||
|
|
|
|
ABð Þ þ hn ! AB þ eð Þ |
Photodetachment |
ð2:17Þ |
|||||||||||||||
|
|
|
|
Að Þ þ BH ! AH þ Bð Þ |
Proton transfer |
ð2:18Þ |
|||||||||||||||
|
|
|
|
AB |
ð Þ þ |
,L |
AB |
ð Þ |
L |
|
Ligand clustering |
ð |
2:19 |
Þ |
|||||||
|
|
|
|
|
|
L kL |
|
|
|
|
|
|
|||||||||
k
Another pertinent energy quantity is the gas phase acidity (GPA) of a molecule. It is also called the deprotonation energy of a molecule. It is the energy for the reaction
AH ! Hþ þ A |
ð2:20Þ |
The deprotonation energy is related to the A H bond dissociation energy, the electron affinity of the radical, and the ionization potential of the hydrogen atom as
GPA ¼ IPðHÞ þ EaðAÞ DðA HÞ |
ð2:21Þ |
The temperature dependence of reactions 2.14 and 2.18 yields relative energetics. If the reactant negative ion is a radical, the hydrogen transfer reaction results in relative gas phase acidities. If the reactant ion is a molecule, the relative molecular electron affinities are obtained. If we assume similar entropy changes, the ratio of the ions and that of the concentration of the neutral reactants give a value of the equilibrium constant and hence a measure of the relative acidity or electron affinity. In some cases only the direction of the reaction is observed to yield limiting electron affinities or acidities. In order to obtain an absolute value, the value of the reference compound must be known. A better procedure is to determine the temperature dependence of the equilibrium constant in order to remove the assumptions
16 DEFINITIONS, NOMENCLATURE, REACTIONS, AND EQUATIONS
concerning the entropy terms. The equilibrium TCT methods have been used to determine the electron affinities of many organic molecules. When relative acidities are obtained, the corresponding bond dissociation energy of the X H bond must be known to obtain the electron affinity of the radical [21–23].
Photodetachment (PD) and photoelectron spectroscopy (PES) utilize reaction 2.17 [24–27]. In the PD method the threshold photon energy for the destruction of the anions is related to the electron affinity of the molecule or radical. In the case of the PES method the electrons generated by the interaction of photons at a fixed frequency are energy-resolved and the electron affinity determined from the threshold. The PD and complementary photoabsorption procedure led to accurate electron affinities of the atoms. In the case of the PD of molecules the onset is equal to Ea, whereas the peak is Epd. This is illustrated in Figure 2.3 for carbon tetrachloride. The PES method has been applied to a few large molecules. The determination of the threshold is complicated by the change in geometry in forming the anion limiting the precision. In PES the state of the negative ion must be identified. The two states for the anthracene anion shown in Figure 2.2 will yield two PES peaks.
Another method used alkali metal beams (AMB) to give a negative ion and a positive ion (equation 2.15). The threshold is the sum of the ionization potential of the alkali metal and the electron affinity of the molecule. A related procedure is the determination of the threshold for endothermic charge transfer (EnCT) from one anion to a neutral to form a second anion. The threshold is equal to the difference in the electron affinities of the species so that the electron affinity of the reactant must be known. These procedures yielded accurate electron affinities of the halogen molecules [18–19, 28, 29].
Electron beam (EB) and electron transmission (ET) experiments measure the vertical electron affinities of molecules. In the EB experiments the ions formed as a function of electron energy are measured. The ion distributions give an indication of a potential energy surface in the Franck Condon region of the neutral. Very good mono-energetic electrons can be obtained. The temperature dependence of the zero energy cross-section can be related to the activation energy for thermal electron attachment. In ET spectroscopy the transmitted current is measured and resonances indicated by a change in the derivative of the electron current as a function of energy. This complements electron impact studies since some transitions do not lead to the formation of negative ions [9, 14, 15]. This VEa is illustrated in Figure 2.2 for anthracene [3].
2.4ELECTRON AFFINITIES FROM SOLUTION DATA
Relative electron affinities of organic molecules can be obtained from half-wave reduction potentials in aprotic solvents. The electron affinities are related to the half-wave reduction potentials by
EaðeVÞ ¼ Eref ð GÞ þ E1=2 ¼ 4:71 ð GÞ þ E1=2 |
ð2:22Þ |