

Chen The electron capture detector
.pdfGENERAL ACCOMPLISHMENTS, 1960 TO 1970 |
27 |
In 1953 Thomas J. Watson and F. N. C. Crick proposed the double helix for the structure of DNA [10]. Even after this was postulated, the problem of a more precise structure of DNA remained. Many studies were begun during this period of time to characterize the electronic structure of the components of DNA, experimentally from spectroscopic studies and theoretically from quantum mechanics. Indeed, there were questions as to whether the components of DNA were acceptors or donors of electrons [11].
In the area of electron affinities of organic molecules, other electrochemical measurements were made and compared with half-wave reduction potentials. Quantum mechanical calculations for aromatic hydrocarbons were carried out using self-consistent field calculations. Many advances were made in the determination of the acidity of organic molecules. The effect of substitution and replacement on electron affinities and bond dissociation energies was recognized. This work is summarized in Chapters 10 and 12. A. S. Streitweiser provides an excellent review of the role of anions in organic chemistry up to 1960 [12].
3.4GENERAL ACCOMPLISHMENTS, 1960 TO 1970
3.4.1Introduction
The use of the ECD in environmental chemistry commenced in the late 1950s. As noted by Lovelock,
In spite of the difficulties of using these primitive detectors, the capable professionals (from the Shell group at Kent, Goodwin et al., and the US FDA, Watts and Klein) successfully and accurately applied the method to the important environmental problem of pesticide residue analysis. . . . They lent veracity to the unprovable statements of that remarkable book by Rachael Carson. [1, 13]
Lovelock was acutely aware of the significance of the electron in biochemistry. As reported,
In testing many compounds of biological significance, it was observed that many of the compounds which responded well in the ECD fell into two categories, those which are important components of the biological system of electron transport or were highly toxic sometimes as carcinogens. It was tempting to speculate that the electron is a fundamental particle of biology as well as of chemistry and physics. It was a challenging coincidence that each alternate acid of the Krebs cycle was one of the very few organic compounds that reacted vigorously with free electrons. . . . It is still unclear as to whether this association is real or coincidental but there is no doubt that a remarkably high proportion of electron absorbers are biologically active and it is this which has made it so important a device in environmental science.
These observations led Lovelock to propose the following hypothesis: ‘‘Electron transport in the living cell proceeds through an ordered sequence of reversible
28 THERMAL ELECTRON REACTIONS AT THE UNIVERSITY OF HOUSTON
electron traps. The introduction of a foreign, especially irreversible trapping agents is harmful because of their ability to remove electrons from the normal sequence’’ [2, 14].
Albert Szent Gyorgi recognized the role of electron transport in biological chemistry and the need to extend biological investigations to the submolecular level. He commented as follows on the concept of collaboration between the biochemist and the physicist in studying the role of the electronic dimension in biology: ‘‘It is not necessary for the biologist to acquaint himself with the intricacies of wave mechanics. . . . The physicist had better stay on his side of the fence than become perhaps a second rate biologist.’’ On the three methods of measuring donor and acceptor strengths, he said,
All three methods of measurement and expression, redox potentials, ionization potentials and electron affinities, as well as orbital energies have their merits and shortcomings and at present there is no universally applicable method available. What would be needed is to bring the three methods to a common denominator that has all of the merits and none of the shortcomings. What would serve our purpose best (of understanding charge transfer in biology) would be a knowledge of IP and EA of all of the molecules in biological media, but this information is not available.
These remarks clearly previewed our studies on half-wave reduction potentials, semi-empirical calculations, and the direct measurement of electron affinities of molecules in the gas phase [15].
3.4.2The Wentworth Group
The stage was set for the development of equilibrium methods of measuring electron affinities of molecules from the temperature dependence of thermal electron reactions, and the ECD, swarm, and magnetron methods. The magnetron direct capture method was the first developed [16]. By this mechanism the equilibrium constant for thermal electron attachment is measured as a function of temperature. Since the reactions are carried out at high temperatures with a hot filament, other processes can take place. However, when the proper temperature dependence is observed, the method gives precise electron affinities of molecules from 1 eV to 3.3 eV. The swarm method was used to obtain an electron affinity of O2 [17]. Wentworth and Becker suggested a method for the measurement of the electron affinities using the ECD [18, 19].
3.4.3Stable Negative-Ion Formation
It was postulated that the response of the ECD could be related to a precisely defined energetic quantity, the electron affinity. This term is defined as the difference in energy between the neutral and the negative ion in their most stable forms. The term ‘‘electron affinity’’ had previously been used to qualitatively describe the ability of a molecule to respond in the ECD, regardless of the mechanism. The
GENERAL ACCOMPLISHMENTS, 1960 TO 1970 |
29 |
carrier gas was a material such as argon/methane, nitrogen, or hydrogen, with no affinity for free electrons. Some misunderstood this rather loose definition and took it to mean thermodynamic electron affinity. Early work had to dispel this notion.
By assuming that the electron capture coefficient is equal to the equilibrium constant for the reaction of thermal electrons with aromatic hydrocarbons, the electron affinity can be obtained by measuring the response as a function of temperature. The equilibrium constant Keq is related to the electron affinity of the molecule by
ln KeqT3=2 ¼ 12:43 þ ln½Qan& þ Ea=RT |
ð3:1Þ |
In equation 3.1 the spin terms of the negative species have been canceled out. The quantity 12.43 is obtained from fundamental constants and the translation partition function of the electron. Qan is the ratio of the remaining partition function of the anion to that of the neutral. If the partition function ratio for the anion and neutral are assumed to be the same, this term is zero. With one value of the equilibrium constant the electron affinity of the molecule can be estimated. The statistical mechanical expression for Keq refers to the absolute zero of temperature so that no temperature correction to Ea is necessary. Unfortunately, there were no values for the equilibrium constants or electron affinities. Thus, the value of Keq for one molecule, anthracene, was determined and the electron affinity of other aromatic hydrocarbons referenced to that value. If the partition function ratios are equal,
EaðunknownÞ ¼ EaðrefÞ RT lnðKref =KunÞ |
ð3:2Þ |
The electron affinities of triphenylene, phenanthrene, chrysene, benzo[c]phenanthrene, anthracene, pyrene, and benz[a]anthracene were reported in 1962 utilizing equation 3.2 and ECD response factors. The Ea of anthracene used to obtain absolute values was 200 meV too low. At the time theoretical SCF Ea of anthracene was calculated to be some 200 meV higher. The ECD values obtained from the original ECD data are the same as the current ‘‘best’’ values within the experimental error using the higher value. In Figure 3.1 a plot of the data for these seven compounds is given with the slope for anthracene set to the then reported theoretical value of 0.63 eV [17–20]. The Ea are next plotted against the current ‘‘best’’ values in Figure 3.2. The standard deviation is 0.08 eV.
Two important methods for verifying the relative values of the electron affinities obtained from the ECD method were introduced in an article cautiously entitled, ‘‘Potential Method for the Determination of Electron Affinities of Molecules: Application to Some Aromatic Hydrocarbons,’’ with comparisons to half-wave reduction potentials and SCF calculations [18, 21]. The relative ECD values agreed with the half-wave reduction potential order from two independent sets of measurements. From this correlation the relative values had an error of 10 to 15%, or for a value of 0.6 eV an absolute error of 0.1 eV, because the electron affinity is logarithmically related to the K value. The agreement was within the experimental and calculation error. It was suggested that electronic absorption spectra, ionization potentials (through the constant electronegativity concept), and
30 THERMAL ELECTRON REACTIONS AT THE UNIVERSITY OF HOUSTON
Figure 3.1 Linear plots of ECD data versus 1; 000=T. The compounds are assumed to have one a region. The intercept is determined by the Ea of anthracene calculated to be 0.63 eV in 1962. Using this value, the relative electron affinities of the other compounds are determined from the relative response of the ECD measured at one temperature [18–21].
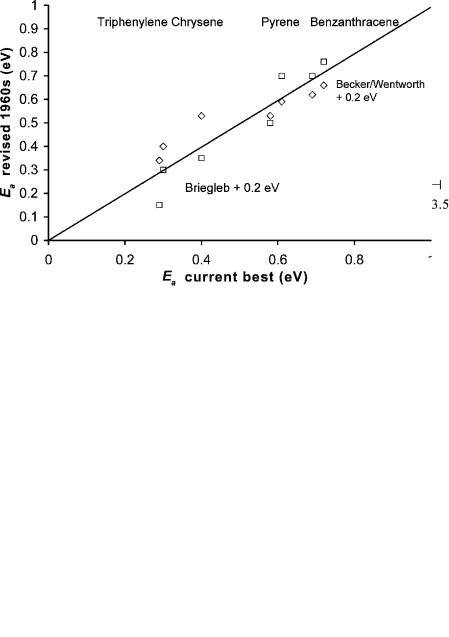
Figure 3.2 The electron affinities of triphenylene, phenanthrene, beno[c]phenanthrene, chrysene, pyrene, anthracene, and benz[a]anthracene given by Becker and Wentworth [18, 19] and by Briegleb [22] incremented by 0.2 eV are plotted versus the current ‘‘best’’ values. The value of 0.2 eV was established by obtaining a unit slope and zero intercept.

GENERAL ACCOMPLISHMENTS, 1960 TO 1970 |
31 |
comparisons with Huckel theory might be fruitful areas of investigation. It was also proposed that solution energies could be determined from comparisons with half-wave reduction potentials. These ideas were successfully pursued in a second paper [19].
In 1964 G. Briegleb reviewed the electron affinities of organic molecules, including results from the ECD, half-wave reduction potentials, and charge transfer complex energies. The latter two methods yielded relative electron affinities that were in the right order for p charge transfer complex acceptors, but did not give accurate electron affinities. Because there were no absolute values available at the time, the values were about 1.4 eV too low. The AEa for the aromatic hydrocarbons were also low by about 0.2 eV because they were scaled to ECD values. A plot of Briegleb’s modified values for the aromatic hydrocarbons is given in Figure 3.2. The standard deviation is 0.08 eV. Briegleb also applied the ECD method to dissociative electron capture [22]. This created confusion in the literature that persisted as late as 1984, with the Ea of chlorobenzene listed as 0.40 eV. The current ‘‘best’’ value is 0.17(5) eV [23].
Lovelock’s odyssey with the ECD continued. He described it as follows:
In 1961, I came to Houston again. . . . This provided at last an opportunity to spend full time in discovering how the electron capture detector really worked. In this I was fortunate to have nearby both Dr. Zlatkis who by then had become a close friend and colleague and Dr. Wentworth and Dr. Chen of the University of Houston. This fruitful collaboration led to the first plausible kinetic model of the electron capture detector. [2]
To test the ECD hypothesis, E. C. M. Chen measured the temperature dependence of the molar response. This entailed a detailed study of all parameters associated with the pulse sampling method. For these molecules the most important reactions were postulated to be electron generation and collection, electron and ion recombination, electron attachment and detachment. It was discovered that the simple thermodynamic model was not applicable and that a kinetic model was necessary to explain the change in temperature dependence. If we assume a steady state exists, an expression can be obtained that relates the ECD molar response to kinetic rate constants for the above reactions [24, 25].
The electron capture coefficient for nondissociative electron attachment is
K |
¼ |
k1ðkN Þ |
ð |
3:3 |
Þ |
|
2 kDðkN þ k 1Þ |
||||||
|
|
When the kinetic expressions kN ¼ AN , kD ¼ AD; k1 ¼ A1 T 1=2 expð E1=RTÞ, and k 1 ¼ A 1 T expð E 1=RTÞ are substituted in equation 3.3, we get
|
|
AN A1 |
T 1=2 exp |
E1 |
=RT |
|
|
|
|
|
K |
¼ |
|
ð |
|
|
Þ |
ð |
3:4 |
Þ |
|
2 AD½AN þ A 1 T expð E 1=RTÞ |
||||||||||
|
|
|||||||||
32 THERMAL ELECTRON REACTIONS AT THE UNIVERSITY OF HOUSTON
At low temperatures the recombination process predominates over the detachment
process and K is relatively constant since kN k 1: |
|
K ¼ k1=2 kD |
ð3:5Þ |
or |
|
ln KT3=2 ¼ lnðA1=TÞ lnð2 ADÞ E1=RT |
ð3:6Þ |
This has been designated the b temperature region. The activation energy for thermal electron attachment and the pre-exponential term for the rate constant for thermal electron attachment are obtained. At that time neither of these two quantities had been measured so comparisons could not be made. kD was estimated from the electron concentration measured as a function of reaction time. The maximum value of k1 was determined by the DeBroglie wavelength of the electron and stabilization to the ultimate ions by collisions at high pressures.
At high T where kN k, the expression for K becomes
K ¼ k1 kN =ð2 kDk 1Þ |
ð3:7Þ |
or |
|
ln KT3=2 ¼ 12:43 þ lnðAN =2 ADÞ þ ln½Qan& þ Ea=RT |
ð3:8Þ |
This has been designated the a region since it was the first observed temperature region. In this region the temperature dependence of the ratio ðAN =2 ADÞ and its dependence on the positive-ion concentration will be minimized since both recombination terms will be affected in the same manner.
By 1967 the kinetic model for nondissociative thermal electron attachment and revised values for the electron affinities of 16 aromatic hydrocarbons and 7 aromatic carbonyl compounds were reported [24–26]. The ECD Ea values were correlated to theoretical calculations, electronegativities, spectroscopic data, and reduction potentials. The majority of these remain the most precise electron affinities for such compounds. Some values are assigned to excited states based on the multistate model of the ECD postulated in the 1990s [27, 28]. The electron affinities of atoms, molecules, and radicals were reviewed in 1966 [24]. The relative Ea of nitrobenzene, CS2, and SO2 were measured by the thermal charge transfer techniques and the Ea of O2 by photodetachment [30–32].
The use of the ECD for physical measurements did not progress as rapidly as its use as an analytical method because of the lack of comparable information on the energetics and kinetics of thermal electron reactions. In the late 1960s and early 1970s many response factors for the ECD were measured, but the importance of temperature was often ignored. L. E. Lyons, G. C. Morris, and L. J. Warren confirmed the Ea for anthracene and pyrene by measuring temperature dependence in a static ECD using ethylene as a carrier in the late 1960s. In addition, an Ea for
GENERAL ACCOMPLISHMENTS, 1960 TO 1970 |
33 |
tetracene was obtained. For many years this value was considered the adiabatic electron affinity. With the two-state model and the determination of the electron affinity of tetracene by other techniques, this value can be assigned to an excited state [28, 33].
In 1965 we purchased a commercial chromatograph with an ECD. The first thing accomplished with the instrument was to obtain the temperature dependence for acetophenone. This work clearly supported the ECD model and formed the basis of the determination of the electron affinity of a series of additional substituted benzaldehydes acetophenones and benzonitrile. Lily Wang Ming, William Ristau, and John Wiley applied the kinetic model of the ECD to a series of aromatic aldehydes and ketones, some of which exhibited a change in geometry upon negative-ion formation [34, 35].
Wang and Charles Han calculated the electron affinities of aldehydes and ketones by using the parameterized Huckel theory. Eight parameters were used to calculate the electron affinities of 16 compounds with a deviation of only 0.05 eV. However, some of the data were not published until the 1970s [35]. By measuring relative electron capture coefficients and scaling to the acetophenone data, more precise electron affinities could be obtained. This was further support for the validity of the ECD model. M. J. S. Dewar reproduced the experimental electron affinities of aromatic hydrocarbons using the MINDO/3 method and calculated Ea from reduction potentials [36].
In 1967 B. H. Mahan and C. E. Young used a new microwave method to determine the rate constant for thermal electron attachment to molecules. These quantities were determined for SF6 and C7F14 using the ECD and agreed with the values reported using the microwave method at room temperature within the experimental error [37, 38]. In addition, the temperature dependence was determined so that activation energies were obtained. This was especially important in the case of strained molecules such as cyclooctatetrene [34].
3.4.4Dissociative Thermal Electron Attachment
In 1964 a brief description of the ECD kinetic model was presented in Nature. This occurred in response to criticism of the use of ECD data to measure the affinity of biological molecules for free electrons. A new procedure for studying electron attachment in swarms and beams had been applied to chlorobenzene. Since the ECD response was originally referenced to that of chlorobenzene, critics emphasized the distinction between dissociative capture and nondissociative capture. They noted that dissociative capture can take place with thermal electrons. This was not disputed. It was realized that certain molecules could undergo dissociative electron capture and that the kinetic model would have to be expanded to include these types of compounds.
Lovelock commented on these exchanges as follows:
The analyst is probably not too perturbed by the assertions of academic scientists that proves that the ECD detector does not work. I well recall the fierce attack on the

34 THERMAL ELECTRON REACTIONS AT THE UNIVERSITY OF HOUSTON
method and its measurements by Stockdale and his colleagues in 1964. Their paper in Nature was a cry of sheer exasperation straight from the heart. It so well expressed the justifiable annoyance of professional chemical physicists who saw their neat and orderly pastures of work on ion molecule reactions trodden over by what seemed to be a mob of clumsy peasants. It is only fair to add that within a year the same authors confirmed the validity of measurements using the ECD.
This initial criticism led to an increase in the data for organic molecules in swarm and beam experiments and an understanding of the ECD kinetic model [39–41].
In the case of dissociative reactions, the ECD capture coefficient is given by
K |
¼ |
ðk1 þ k12ÞðkN þ k2Þ |
ð |
3:9 |
Þ |
|
2 kDðkN þ k 1 þ k2Þ |
||||||
|
|
Roberta Tai Tung studied dissociative electron capture. The model was extended to unimolecular dissociative electron capture by recognizing that k12 and k1 are the same if no molecular negative ion is formed. There is one b region where equation 3.6 applies. The positive slope is the activation energy for dissociative thermal electron attachment. The intercept is related to the DeBroglie wavelength of an electron. For endothermic reactions the activation energy will be at least equal to the energy for dissociative electron attachment. For exothermic reactions, such as for CCl4, the activation energy will approach zero and the capture coefficient will be large. For the first time qualitative potential energy curves were used to describe the ECD mechanisms. It was noted that the prexponential was larger for the aromatic halogenated compounds [42–47]. Thus, a new mechanism had to be proposed. In this case there is a change in the direction of the temperature dependence in a transition from the a region to a new region called the g region where ðk2 > kN < k 1Þ, and the K value will be given by
K |
¼ |
k1ðk2Þ |
ð |
3:10 |
Þ |
|
2 kDðk 1Þ |
||||||
|
|
In this region the phenomenological activation energy will be equal to D EaðXÞ. Since the electron affinity of the halogen atoms is well established, this experimental property can be used to obtain the bond dissociation energy.
Tai Tung, Robert George, Joe Steelhammer, and Herman Keith also studied dissociative electron capture in the ECD [42–47]. The kinetic model was extended to three temperature regions, one of which presented a way to measure the electron affinities of acetate and the NO2 radicals. Steelhammer recognized that dissociative thermal electron attachment could take place via a molecular ion intermediate. He also discovered a variation on that mechanism, whereby dissociation could occur through a single potential energy curve. In this case the experimental activation energy is equal to the quantity D EaðBÞ so that if one is known, the other can be determined. In the instance of acetic anhydride the bond dissociation energy is well known so the electron affinity of the acetate radical is obtained [43].
GENERAL ACCOMPLISHMENTS, 1960 TO 1970 |
35 |
Han refined the kinetic model and investigated the effect of flow rate on the model and the use of ethylene as a dopant in the ECD [46]. By 1969 the kinetic model of the ECD was firmly established, as summarized in one review [47]. The ECD, swarm, and beam data were consolidated into a consistent picture by applying the nonlinear least-squares procedure to the ECD data and by postulating that ‘‘two-dimensional’’ Morse potential energy curves could be used to represent the cross-section through a potential energy surface that then represents the negative ions. Steelhammer constructed pseudo-two-dimensional Morse potentials to describe these processes by relating the negative-ion curves to the properties of the neutral. These curves used the available data for dissociative capture from electron beam and swarm techniques [47].
Lovelock summarized the reasons for developing the ECD method as follows:
In view of the many highly developed and accurate techniques already described, the introduction of a new method of measurement in electron-attachment studies would seem to need more than usual justification. The pulse-sampling method arose not from a perverse desire for novelty but as a simple and inexpensive qualitative detector for gas chromatography. Its later consideration as a potential method for electron attachment studies was made not because it was better able to perform the physical measurements, but because none of the previous methods are able to satisfy the severe chemical constraints imposed during the measurements of weakly volatile, highly polar, and possibly impure organic compounds, for example, steroids. The method is dynamic and designed for the observation of brief pulses of ultra pure, dilute vapor emerging from a chromatograph column. Static methods of observing electron attachment, although quite adequate with pure permanent gases are quite unsuited for this purpose. [25]
3.4.5Nonlinear Least Squares
One of the major accomplishments of the Wentworth group has been the application of the nonlinear least-squares procedure to chemical problems. This has been generally recognized by the fact that two articles on the subject published in the Journal of Chemical Education in 1965 have become ‘‘classics.’’ The following is taken from the March 31, 1986, Current Contents issue:
Many equations in chemistry and related physical science are non-linear with respect to various parameters. The subject article describes how a least squares adjustment can be carried out rigorously using properly weighted observations. The procedure is illustrated by application to a kinetic rate expression and the Arrhenius equation. In 1986, these papers have been cited in over 340 and 115 publications respectively. [48, 49]
Wentworth was asked to write a comment about how this article came into being:
While I was a graduate student in chemistry, I had several occasions to fit data to equations using the principle of least squares. However, I noticed that upon rearrangement
36 THERMAL ELECTRON REACTIONS AT THE UNIVERSITY OF HOUSTON
of the equation I would obtain a different least squares solution. This was puzzling to me and I could never get the problem resolved. Upon leaving graduate school in 1956, I decided to work as an applied mathematician in the ‘‘new’’ missile industry. Recall that digital computers were in their infancy at that time and all programming was carried out in machine language. It was during this employment as an applied mathematician that I was introduced to the generalized least squares adjustment. It became immediately apparent that there was only one least squares adjustment and the different least squares solutions that I had obtained in graduate school were the neglect of weighting the residuals. Once the appropriate weighting factors are used, there is only one solution. This assumes that the errors are sufficiently small that a Taylor’s Series expansion including only the first order terms is satisfactory. This is the case when the parameters are defined with reasonable precision.
The generalized least squares adjustment was described thoroughly in a book written by W. E. Deming in 1943, well before the advent of digital computers [50]. Since the calculations required performing non-linear least squares adjustments are very tedious, it is understandable that the technique was not used extensively. In retrospect, I believe the reason for the attention given to my paper was a matter of timing. In the early to mid-1960s digital computers were finding their way into universities, and it was only natural that non-linear least squares would appeal to experimentalists who for years had struggled with less satisfactory approximation methods. My interest in writing the article was to present the subject at a level that the average experimental chemist could understand. Most chemists at that time did not have a background in matrix algebra and I tried to avoid the extensive use of matrices. The popularity of the article was apparent when 250 reprints were exhausted within two months and another 250 at the end of the year. Even today (1986), I get an occasional reprint request.
As graduate students in the Wentworth laboratory, we were all required to use nonlinear least squares initially, sometimes with a mechanical calculator whose best feature was that it could take precise square roots. Later, as we tested the ECD method, we dropped the least-squares procedure for the simpler determination of a slope through straight lines. This was generally correct, but as we learned when the dissociative mechanism of the ECD was included, there was a need to use the complete ECD equation. Hirsch studied the temperature dependence of the ECD and sought new correlations of the electron affinities and hydrogen bond strengths. In order to obtain the thermodynamic parameters for the complexes from the data, a nonlinear least-squares procedure to include data determined by other experiments was developed [51]. This procedure was applied to the ECD data for the multistate model.
The general least-squares procedures can now be implemented in spreadsheets programmed with macros. Adjustments once impossible are now trivial. The classification of molecules to obtain electron affinities from half-wave reduction potentials is an example of a linear least-squares adjustment. The determination of the adiabatic electron affinity for acetophenone is an example of a nonlinear twoparameter least-squares procedure. The nonlinear least-squares adjustment of ECD to the expanded kinetic model is one of the major advances of the 1990s.