

History of Modern Genetics in Germany
.pdfThree-Phase Oxygen Absorption and Its Effect on Fermentation |
63 |
Fig. 3. Comparison the one- (Eq. 24) and the two dimensional model (Lin et al. [44]) results as a function of dispersed phase holdup at different values of particle distance from the interface
(D = 2 ¥ 10–9 m2 s–1, ko = 8.5 ¥ 10–5 m s–1, Dr = 1, H = 10, dp = 20 ¥ 10–6 m, e = 0.1, N = 15, M = 0)
mentation in the presence of conventional organic phases with H values up to 20–25.
Another important question is the applicability of the one-particle model, i.e., when only one particle is assumed to be located in the diffusion path perpendicular to the gas-liquid interface. Brilman [42] simulated, using his one-di- mensional model,the effect of the particle number in the diffusion path in range of H between 4 and 100 with dp = 3 mm and ko = 1 ¥ 10–4 m s–1 . The increase in the absorption rate due to the second particle ranges from zero to 30%, while that due to the third particle is less than about 8%. Similar results were obtained by Nagy [48]. Generally, it can be stated that the effect of the second and third particles, etc. must not be neglected using the dispersed organic phase with H values up to 25 and under conventional mass transfer conditions. The multiparticle mass transfer rate is illustrated in Fig. 4 and partly in Fig. 5, too. Figure 4 shows the local values of enhancement, Eloc at differential radial positions from
the particle center. The Eloc function was simulated for 1, 2, and 3 particles located next to each other. The distance from the interface, d0 was assumed to be
equal to zero. Practically, the bave value can be obtained by averaging the values shown in Fig 4 over the heterogeneous part of the interface. The figure clearly shows that, following from the one-dimensional character of our model, enhancement does not exist at radial positions that are larger than dp (dp = 3 mm). The Eloc strongly decreases with increasing distance from the particle center.The results obtained by Brilman et al. [42] using twoand three-dimensional models for the simulation show that the Eloc values is larger than unity in the radial position range of 3 to 5 mm, too, though these values gradually decrease down to unity. This indicates the role of lateral diffusion. It should be noted that the lat-

64 |
E. Nagy |
Fig. 4. Local enhancement as a function of radial positions from the particle center using the one-dimensional model presented (D = 1.24 ¥ 10–9 m2 s–1, Dr = 0.56, H = 103, dp = 3 ¥ 10–6 m, M = 0)
Fig. 5. Enhancement as a function of the physical mass transfer coefficient without dispersed phase at different particle numbers and dispersed phase holdups (D = 2.3 ¥ 10–9 m2 s–1, Dr = 0.56, H = 18, dp = 10 ¥ 10–6 m, d0 = 0, M = 0)
Three-Phase Oxygen Absorption and Its Effect on Fermentation |
65 |
eral diffusion also has an additional effect, namely, it lowers the values of Eloc at every point of the radial position within the particle radius. The Eloc values obtained by Brilman et al. [42] are much smaller than that in Fig. 4. That is why the difference in the enhancements obtained by the two models, at lower values of H, is rather low.
The three-phase absorption rate should strongly depend on the physical mass transfer coefficient. In principle, the decrease in the contact time of droplets at the interface should decrease their effect on the mass transfer rate. In reality, the situation is more complex as is shown in Fig. 5. The enhancement has a maximum as a function of the physical mass transfer coefficient,ko. In the range of ko where the E value increases to its maximum, the diffusion through the droplets dominates the absorption rate while at higher ko values, where E decreases monotonously, the diffusion in the continuous phase between the gas-liquid interface and the first particle dominates mostly the E values due to the decreasing diffusion depth of the absorbing component. In this regime the diffusion depth will gradually become smaller than the value of d0 + d, and then have the value of d0 . At lower values of ko, ko< about 2 ¥ 10–4 m s–1 in Fig. 5, the diffusion depth is much larger than the particle size and, as a consequence, the multiparticle model should be used for this regime. Calculations were carried out at e values of 0.1 and 0.3 and at different numbers of particles in the diffusion path. At values of e = 0.1 and N = 1, enhancement was also calculated in the case of cubic particles (dotted line) to compare these data to those of spherical ones. Difference between them exists at larger ko values only, it increases with the increase of ko but it is less than about 15% in the parameter range investigated.
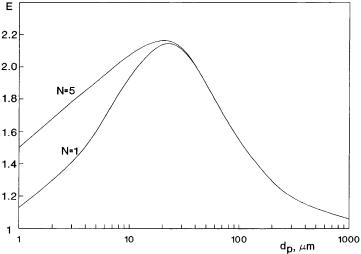
Droplet diameter is also an important parameter.According to the results obtained by Lin et al. [44] and Nagy [48], the absorption rate increases with the increase of the particle size up to a maximum.When the particle size is larger than the penetration depth, the enhancement decreases with increasing particle size. This conclusion is in contradiction to that of van Ede et al. [49]. According to their model, the absorption rate decreases with the particle diameter. Assuming that the first droplet located at the interface, the dispersed phase holdup increases with the increase of the droplet size and, consequently, the absorption rate should increase in the size range of dp < d. Figure 6 illustrates the effect of the droplet size. The absorption rate increases with the size up to dp = 20 – 30 mm. In this size range the diffusion depth is larger than the droplet diameter, thus, the multiparticle model must be used. With a particle size (dp) greater than about 30 mm,the size will be larger than the penetration depth,and, due to this fact, the absorption rate gradually decreases with the droplet diameter.
2.1.5
Effect of Chemical Reactions
One must pay great attention to the role of the continuous phase chemical reaction because the reaction rate may continuously change during fermentation. This will have an effect on the absorption rate which will also change during the process and this has also to be taken into account. In reality, the reaction rate in
66 |
E. Nagy |
Fig. 6. Enhancement as a function of the particle size (D = 2.3 ¥ 10–9 m2 s–1, Dr = 0.56, H = 18, ko = 1 ¥ 10–4 m s–1, d0 = 0, e = 0.1, M = 0)
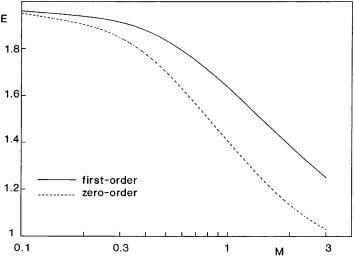
fermenters is not very high, therefore it might be expected that its effect on the absorption rate can be neglected in most cases. To make a decision you need exact calculations for this problem. To my knowledge, the effect of the continuous phase reactions on the three-phase absorption rate has not been discussed yet. As expected, the absorption rate should decrease with the increase in the reaction rate [60]. Namely, with the increase in the reaction rate, the penetration depth decreases, therefore, the role of the mass transport inside the droplets gradually diminishes. Figure 7 shows the effect of the reaction modulus, M on the enhancement in the cases of both the zeroand first-order reactions. As can be seen,the E value can be regarded to be constant when M is smaller than about 0.4. At larger values of M, enhancement strongly decreases with the increase in the reaction rate. The effect of the zero-order reaction, this is mostly the case during fermentation, is somewhat higher than that of the first-order chemical reaction. It can be stated that the effect of the chemical reaction on the absorption rate in a three-phase system must be considered only when M > 0.4.
2.1.6
Verification of the Model Results
Several researchers have measured the absorption rate at the presence of dispersed organic phase [1, 17–18, 37, 39, 49, 51–53]. Bruining et al. [37] measured the oxygen absorption in stirred vessels with plane interface in the presence of small amounts of decane, hexadecane, e = 0.01 – 0.1 while van Ede et al. [49] applied octene as a dispersed phase. Littel et al.[39] used carbon dioxide for absorption in dispersion of toluene droplets with e = 0 – 0.4. The theoretical data in the literature were mostly verified by the experimental results of the above
Three-Phase Oxygen Absorption and Its Effect on Fermentation |
67 |
Fig. 7. The effect of the external chemical reactions on enhancement (D = 2.3 ¥ 10–9 m2 s–1, Dr = 0.56, H = 18, dp = 10 ¥ 10–6 m, ko = 1 ¥ 10–4 m s–1, d0 = 0, e = 0.1)
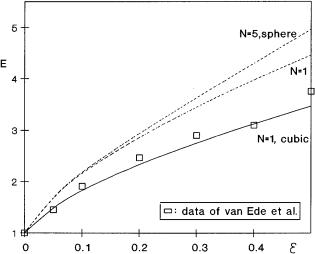
authors because the gas-liquid interface is known in those cases [43, 44, 46, 49] . The gas-liquid interfacial area in the case of intensive mixing, when the gas-liq- uid interface is no longer flat, can strongly change with the dispersed phase holdup [52, 53]. Enhancement is affected by the interfacial area, as well, in those cases. Because its values are mostly not known the real value of enhancement is difficult to determine. Generally, the verifications of model data are in good agreement with the experimental ones. However, it has to be mentioned that the d0 value and the e in the boundary layer have not been measured yet, therefore the verification results must be treated carefully. Figure 8 shows an example for the verification of the theoretical data. The experimental data of van Ede et al. [49] are compared to the calculated data using the presented multiparticle model . The calculated data are somewhat higher than the measured ones for the case of d0 = 0. At somewhat higher values of d0 , not shown in Fig. 8, the theoretical model gives the same results as the measured ones. To get more exact verification, among other values, the d0 must be estimated or measured. Comparing the theoretical data to other experimental ones [42, 44, 46, 48], one can conclude that the models agree with the experimental results. Thus, it can be concluded that the analytical mass transfer models [46, 48] are accurate enough to be used for the prediction of the mass transfer rates in chemicalor biochemical technologies.
2.2
Fermentation with an Enhanced Absorption Rate of Oxygen
As previously discussed, the oxygen absorption rate can essentially be increased using a dispersed organic phase with higher solubility and/or diffusivity. The
68 |
E. Nagy |
Fig. 8. Verification of the experimental and theoretical data (D = 2.3 ¥ 10–9 m2 s–1, Dr = 0.56, H = 18, dp = 22 ¥ 10–6 m, ko = 0.92 ¥ 10–4 m s–1, d0 = 0)
use of an organic phase in a fermentation broth can have several negative effects as well. The most important one is its potential influence on the microorganisms. The question is how the microorganisms can tolerate the organic phase. There are numerous reports of cell growth reduction in the presence of a dispersed phase. For example, Lowe et al. [55] showed that some perfluorocarbons led to inhibition of growth and other negative effects on mammalian cells. Chandler et al. [56] showed that growth of Escherichia coli was inhibited by perfluorocarbon. Electron microscopy showed vacuoles and other structural perturbations of the microorganisms after prolonged contact. Silicon oil also causes loss of activity of the microbial cells [57]. The use of an oxygen acceptor selector such as p-benzoquinone, after longer contact, however, can also reduce the activity of microorganism over a longer period of time [58]. An alternative method for avoiding the negative effects of the organic phase might be to encapsulate the oxygen carrier within an ultra-thin, oxygen-permeable membrane, providing an inert barrier between the organic droplets and the cells [21, 22, 59]. With this method, the direct contact between the cells and liquid medium can be eliminated, and thus, the toxicity problems related to direct contact can also be avoided.
Junker et al. [1] investigated the cell mass productivity in a wide range of perfluorocarbon volume fractions using a variety of organisms such as Baker’s yeast, Candida lipolytica, Acetobacter pasteurianus and Gluconobacter oxydans. All cells grew adequately in the presence of perfluocarbon, the experimental growth rates,lag times,and cell yields were unaffected by the organic phase. Due to the longer exponential growth periods and higher cell densities, the oxygen uptake rate was increased drastically. For instance, for Candida lipolytica, the maximum oxygen uptake rate was six times higher in the presence of a 75% or-
Three-Phase Oxygen Absorption and Its Effect on Fermentation |
69 |
ganic phase, compared to that without an organic phase. While, the maximum cell density was increased from 30 kg dry cell wt m–3 at 0% to 145 kg dry cell wt m–3 at 75% perfluorocarbon. The exponential growth phase of Acetobacter pasteurianus more than doubled in length with the maximum cell density increasing from 5 to 43 kg dry cell wt m–3. For these fermentations, the oxygen uptake rate increased by a factor of 6.5 on an aqueous volume basis. Overall, the observed increases in oxygen uptake rate were found to be linearly related to cell mass productivity, substrate uptake, and product formation rate for a variety of microorganisms. Silicon oil was successfully applied as an oxygen carrier for the production of dihydroxyaceton from glycerol with Gluconobacter oxydans [21, 22, 59]. Silicon oils were microencapsulated within polyamide (nylon) membranes cross-linked with polyethylenimine. The addition of 20% encapsulated silicone oil will increase the oxygen availability by a factor of 6.5, in comparison to the reference culture without silicon oils. In batch fermentation, improved oxygen transfer capacity and the removal of oxygen limitation raised the productivity by a factor of five. A toxic effect or inhibition was not observed in the course of fermentation. Therefore, the microencapsulation technique avoids the toxic effects as well as maintaining the high oxygen transfer capacity [21].
2.2.1
Integrated Model of Fermentation
During fermentation,the enhanced absorption rate of oxygen increases the bulk concentration and, as a consequence, the production rate of cells can be increased as well. To predict this effect, the enhanced transfer rate has to be incorporated into the differential mass balance equations of fermentation processes studied. If you know the mathematical expression of the biochemical reactions and their dependence on oxygen concentration as well as the enhanced absorption rates due to the dispersed organic phase, you can calculate the fermentation exactly after solving the equation system obtained.
The kinetic modeling of the external transport limitation is successful with aid of a double-substrate-limitation function [61–63]:
m = mmax K |
S |
OL |
(26) |
+ S K + O |
|||
0s |
94 |
||
|
|
O |
L |
The above equation can be used as a formal kinetic approach without assuming a mechanism. This equation should be incorporated into the mass balance equations for oxygen in which the enhanced oxygen transfer rate due to the dispersed phase should also be considered.
Let us consider an ideal continuously stirred tank reactor with constant broth volume. The mass balance equation for substrate as a carbon source (Eq. 27), biomass (Eq. 28) and oxygen in the fermentation broth (Eq. 29) can be given for the liquid phase, as follows [65, 66]:
dS = – mX + 3D (Sin – S) |
(27) |
|
dt |
YX/S |
|
5 |
7 |
|

70 |
|
|
|
E. Nagy |
dX = mX – 3DX |
|
|
(28) |
|
5dt |
|
|
|
|
dOL |
|
mX |
+ D3(OL,in – OL) |
(29) |
dt |
= 3600 J*het – Y |
|||
7 |
|
7 |
|
|
X/O
The absorption rates,J* are given in Eqs. 24 and 25. It was assumed that the bio-
het
mass concentration in the inlet liquid is equal to zero and that the oxygen concentration in the gas phase is constant and, as a consequence, the O* value will also be constant during our simulation. The gas concentration can practically be kept as a constant if the volumetric gas flow rate is high enough. Its change during absorption can easily be taken into account [65, 66]. The above equation system (Eqs. 26–29) can only be solved by numerical methods. For the solution, the Runge-Kutta-Feldberg method was used [64].
2.2.1.1
Simulation of a Batch Stirred Tank Reactor
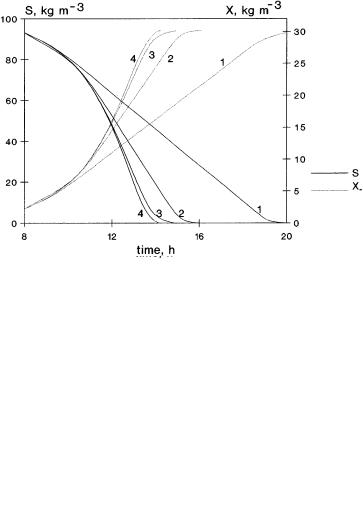
For a batch process, the dilution rate is zero. Typical results are shown in Figs. 9 and 10 where the substrate, oxygen and biomass concentrations in the fermentation broth, as well as the growth rate, are plotted as a function of time. The parameter values used for simulations are given in Table 1. These are practical values that are close to that of bio-chemical processes [61]. Data of the organic phase in the Table corresponds to octene [49]. The values of parameters that are different from that of Table 1 are given separately in the figure legends. Time courses of oxygen concentrations in Fig. 9 are very interesting. Their values gradually decrease as a function of time, reaching a minimum and, when the substrate consumption is practically finished, it starts to increase again. The effect of the dispersed phase holdup is significant. The oxygen concentration is shifted to the right-hand side with the increase of the value of e and the minimum of curves for oxygen also increases. When the parameter regime is investigated, the initial value of enhancement changes between 1 to 3.9 due to change of e value. This large increase in the absorption rate causes significant change in the time course of fermentation. Namely, the higher bulk oxygen concentration causes a higher growth rate and, thus, a faster rate of substrate consumption as well as higher production rate. Time for the complete fermentation decreases to
Table 1. Data of parameters used for simulation of fermentation in bacth and continuous fermenters shown in Fig. 9–12
Sin = 100 kg m–3 |
Xin = 0.05 kg m–3 |
mmax = 0.5 h–1 |
KS = 6 kg m–3 |
D3 = 0 or 0.2 h–1 |
YX/S = 0.3 kg kg–1 |
koa = 200 h–1 |
D = 2.3 ¥ 10–9 m2 s–1 |
dispresed phase: |
|
H = 18 |
ko = 1 ¥ 10–4 m s–1 |
dp = 20 ¥ 10–6 m |
e = 0.1 |
O* = 9 ¥ 10–3 kg m–3 KO = 0.016 ¥ 10–3 kg m–3 YX/O =1 .9 kg kg–1
Dr = 0.56 d0 = 0 m
Three-Phase Oxygen Absorption and Its Effect on Fermentation |
71 |
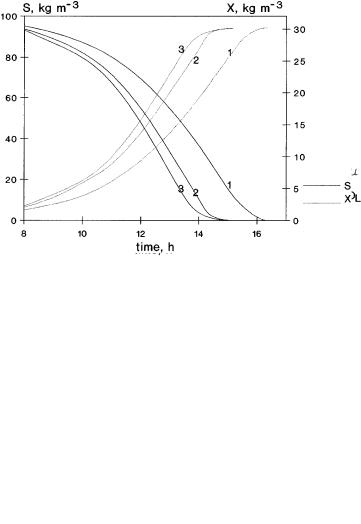
Fig. 9. Time course of concentrations, S, O, X and the m value; simulated data without (curve 1) and with dispersed phase (1 – e = 0; 2 – e = 0.07; 3 – e = 0.2; 4 – e = 0.39; enhancement for M = 0 are 1, 1.9, 2.9, 3.9, respectively)
about 30%, it is lowered from about 20 h down to 14 h due to the enhanced absorption rate.
The KO saturation coefficient of oxygen in the Monod-type kinetic equation is an important parameter, too. Its value strongly influences the specific growth rate, especially when the value of oxygen concentration is of the same order of magnitude as or lower than the KO value. Its effect is illustrated in Fig. 10 in the presence of a dispersed organic phase, e = 0.2. The increasing value of KO (KO was chosen to be equal to 0.64 ¥ 10–3, 0.16 ¥ 10–3 and 0.016 ¥ 10–3 kg m–3) has a
72 |
E. Nagy |
Fig. 10. Time course of concentrations, S, OL, X and the m value at different values of KO , using dispersed organic phase (e = 0.2, thus E = 2.9 if M = 0); for curves 1, 2 and 3 the values of KO are equal to 0.64 ¥ 10–3 kg m–3, 0.16 ¥ 10–3 kg m–3 and 0.016 ¥ 10–3 kg m–3, respectively;
complex effect on the growth rate, m.At the beginning it lowers the m value which then affects the concentrations of reagents and, accordingly, the change of m, as well. This is responsible for the oxygen curves being shifted towards the higher concentrations. Its minimum will also be increased. The greater values of KO need lower enhancement of the absorption rate in order to avoid the potential, critical oxygen concentration level.
An important question is how the reaction rate modulus for the continuous phase, M changes during fermentation process. It is well known when OL KO
- #
- #15.08.20134.04 Mб15Hastie T., Tibshirani R., Friedman J. - The Elements of Statistical Learning Data Mining, Inference and Prediction (2002)(en).djvu
- #
- #
- #
- #
- #
- #
- #
- #15.08.201315.44 Mб23Hudlicky M, Pavlath A.E. (eds.) - Chemistry of Organic Fluorine Compounds 2[c] A critical Review (1995)(en).djvu
- #