

History of Modern Genetics in Germany
.pdfThree-Phase Oxygen Absorption and Its Effect on Fermentation |
73 |
then Monod kinetics is a zero-order reaction, while in the case of OL KO it is a first-order reaction. There exists an intermediate reaction range where the reaction order lies between unit and zero. The reaction rate constants can be obtained from Eq. 26 as limiting cases above mentioned, for zero- (Eq. 30) and for first-order reaction (Eq. 31).
S |
X |
|
|
(30) |
|
k0 = mmax K + S Y |
|
|
|
||
0s |
8 |
|
|
||
|
|
X/O |
|
|
|
S |
1 |
X |
(31) |
||
k1 = mmax K + S K |
|
Y |
|
||
0s |
6 8 |
|
|||
|
|
O |
|
X/O |
|
The rate constants, k0, k1 differ from each other by a factor of KO, namely k0 = k1KO. During our simulation we calculated the M value in the following manner: when OL >KO then Eq. 30 was assumed to be valid,and when OL <KO then Eq. 31. With these assumptions, the M value could be calculated continuously during the whole fermentation process. Then, the M value obtained was used to estimate enhancement of the absorption rate during the fermentation. It was obtained that the E value practically does not change in the course of fermentation. As can be seen in Fig. 11, M has rather low values, namely M < 0.3, as a function of the oxygen concentration during the fermentation. If we take into account the curves in Fig. 7, where enhancements are shown as a function of M, it can be stated that the effect of the chemical reaction in the continuous phase, under the conditions investigated, can be neglected. This may be true in most cases during bio-chemical processes. However, at higher values of biomass concentration and/or maximum growth rates (mmax),the M value can be higher,as well. In these cases, the effect of the continuous phase reaction on the absorption rate can no
Fig. 11. The change of the reaction-diffusion modulus as a function of the oxygen concentration during the fermentation (parameters are same as in Fig. 10; curve 1: KO = 0.64 ¥ 10–3 kg m–3; curve 2: KO = 0.016 ¥ 10–3 kg m–3)

74 |
E. Nagy |
longer be neglected. This can be estimated exactly from the rate equations given in this paper.
2.2.1.2
Simulation of Continuous Stirred Tank Reactor
Many reviews and several books [61, 62] have appeared on the theoretical and experimental aspects of the continuous, stirred tank reactor – the so-called chemostat. Properties of the chemostat are not discussed here. The concentrations of the reagents and products can not be calculated by the algebraic equations obtained for steady-state conditions, when m = 3D (the left-hand sides of Eqs. 27–29 are equal to zero), because of the double-substrate-limitation model (Eq. 26) used. These values were obtained from the time course of the concentrations obtained by simulation of the fermentation. It was assumed that the dispersed organic phase remains in the reactor and the dispersed phase holdup does not change during the process. The inlet liquid phase does not contain either organic phase or biomass.
Figure 12 shows typical values of concentrations as a function of time, without (curves 1) and with a dispersed organic phase (curves 2). The difference between the two cases is significant. The oxygen concentration rapidly decreases down to zero when there is no dispersed phase in the fermentation broth.In contrast, when you use a dispersed phase, the oxygen level remains rather high during the whole process. Even at the minimum, it reaches about 40% of its saturation concentration. After a short period of time, the oxygen concentration, after its minimum, starts to increase up to its stationary value, that is, up to 70% of its
Fig. 12. Simulation of chemostat without (curves 1) and with (e = 0.2, thus, E = 2.9 if M = 0) dispersed organic phase (curves 2; D3 = 0.2 h–1)
Three-Phase Oxygen Absorption and Its Effect on Fermentation |
75 |
saturation concentration. According to the different oxygen levels of the two cases, substrateand biomass concentrations also show great differences. The stationary outlet concentration of substrate is practically close to zero,it is about 4 kg m–3 using an organic phase while its value is about 37 kg m–3 without organic phase. The change of biomass concentration follows from these values.
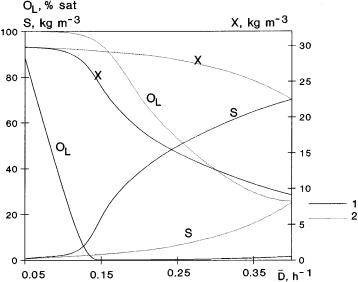
The effect of the dilution rate is shown in Fig. 13. The stationary outlet concentrations were obtained from the time course data of concentrations. The time needed to reach the steady-state conditions (not plotted here) depends very strongly on the dilution rate and enhancement. Figure 13 shows data with and without organic phases. The oxygen concentration rapidly decreases as a function of the dilution rate when the fermentation takes place without a dispersed organic phase (curves 1).While,with an organic phase,it has relatively high level even at high values of the dilution rate. In the latter case, the substrate concentration is also low. That should mean that the fermentation process can be carried out at a much higher dilution rate using a suitable organic phase. Consequently, the productivity of the fermentation process should be much higher with a dispersed phase. Obviously, the use of an organic phase means additional costs during the process but these costs should be much less than the financial advantage caused by the increase in production.
2.3
Baker’s Yeast Production
Though baker’s yeast production is a rather complex process,its kinetics are well known [67, 68]. Software developed by Kristiansen [68] for simulation of this
Fig. 13. The change of the steady-state concentrations as a function of the dilution rate without (curves 1) and with (e = 0.2, thus, E = 2.9 if M = 0) dispersed organic phase (curves 2)

76 |
E. Nagy |
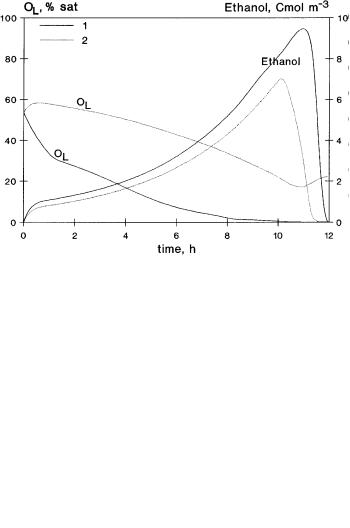
fermentation offered us an excellent opportunity to apply it for the estimation of the effect of a dispersed organic phase on this process as an example. The specific growth rate of baker’s yeast consists of three partial specific rates according to three routes: aerobic and anaerobic degradation of sugar, and aerobic degradation of ethanol. Both the sugarand ethanol concentration as well as the oxygen concentration affect the specific growth rate.According to the Monod model,the rate of glycolysis increases with increasing sugar concentration up to a maximum value. When the rate of glucose consumption exceeds a critical value, a considerable part of the sugar may be converted into carbon-dioxide and ethanol even if there is no oxygen limitation. When the oxygen uptake rate is, or can be, greater than the rate of sugar consumption, aerobic growth on ethanol occurs. Anaerobic ethanol production takes place under oxygen limitation or oxygen starvation. It is important to operate at maximum oxygen transfer capacity of the production vessels.In large bioreactors as used in baker’s yeast production, oxygen limitation can occur very often. If this is the case, reduction in yield may be experienced. Details about this process can be found in the literature [67,68].We want only to show how the dispersed organic phase can enhance the oxygen concentration in the fermentation broth during the fermentation and, consequently, the production of baker’s yeast. Figure 14 shows the calculated concentrations of sugar, S, oxygen, OL, biomass, X and ethanol without and with organic phases. The oxygen concentration was related to that of its saturation value. That was assumed to be equal to 0.28 mol m–3 [22]. The reactor data and other parameter values are listed in Table 2. The kinetic data of the baker’s yeast production used for the simulation are the same as given by Kristiansen [69]. The effect of organic phase was taken into account in such a manner that the real mass transfer coefficient of the fermenter obtained with data of Table 2 was multiplied by factor of 2.9. This value corresponds to enhancement of the absorption rate caused by the organic phase with properties given in Table 1 in the case of e = 0.2. It has to be noted that the same increase of the mass transfer coefficient can be achieved by the increase of the stirrer speed by a factor of 2.4. As can be seen in Fig. 14, the oxygen concentration is significantly higher due to its enhanced absorption rate. This causes the ethanol production to decrease and the productivity increases. The biomass production during the enhanced absorption rate increases 18% more than that obtained without an organic
Table 2. Data of parameters used for simulation of baker’s yeast fermentation in fed-bacth fermenter shown in Fig. 14–15
|
fermenter: |
|
|
stirrer speed: 30 rpm |
fermenter diameter: 4.7 m |
stirrer diameter: 1.5 m |
|
Powernumber : 6 |
Fg = 3600 m3 h–1 |
FL = 10 m3 h–1 |
|
|
initial values: |
|
|
|
|
|
|
V = 11 m3 |
S = 2500 Cmol m–3 |
X = 300 Cmol m–3 |
|
ethanol: 0 Cmol m–3 |
OL = 0.15 mol m–3 |
CO2 = 0.1 mol m–3 |
|
|
inlet liquid: |
|
|
|
|
|
|
Sin = 1750 Cmol m–3 |
Xin = 0 Cmol m–3 |
ethanol: 0 Cmol m–3 |
|
OL, in = 0.15 mol m–3 |
CO2 = 0.05 mol m–3 |
|
|
Three-Phase Oxygen Absorption and Its Effect on Fermentation |
77 |
Fig. 14. Time course of baker’s yeast fermentation without (curves 1) and with (E = 2.9) dispersed organic phase (curves 2); simulation of fed-batch fermenter with constant liquid feed rate using data of Table 2
phase (the end concentrations of biomass are equal to 581 and 685 Cmol m–3 without and with enhanced absorption rates, respectively). Taking into account that the reactor volume is about 130 m3 at the end of the fermentation this difference means a large amount of biomass. Figure 15 is also typical representation of the time course for the case when the fed liquid rate is gradually increased during the fermentation. Here oxygenand biomass concentrations are plotted as functions of time. Changes in concentration are similar to those ob-
78 |
E. Nagy |
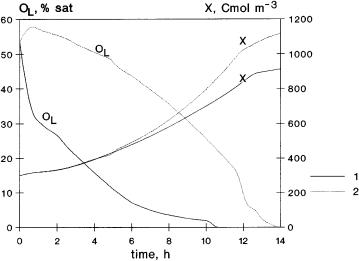
Fig. 15. Time course of baker’s yeast fermentation without (curves 1) and with (E = 2.9) organic phase (curves 2) with stepwise increasing, in every hour 1 m3 h–1 from the 5th hour, of the liquid feed rate from 5 up to 12 m3 h–1 (the inlet sugar concentration was here: 3000 Cmol h–1, other data as in Table 2)
tained in Fig. 14. The oxygen concentration decreases to zero at the end of fermentation, only, in the case of an enhanced absorption rate. Its value is much higher in the whole fermentation time. The increase of biomass production is also significant, it is equal to about 20%.
Generally, it is clear from the results given above that baker’s yeast production, in principle, can essentially be increased by a dispersed organic phase. The same effect obtained by increased stirrer speed needs additional energy and this can be disadvantageous in systems with shear-sensitive cells. This mechanical stress can be avoided using an organic phase instead of higher stirring rates. Obviously, circumspect analysis is needed to consider each important effect, either negative or positive, caused by the presence of an organic phase.
3
Concluding Remarks
Using a dispersed organic phase in the fermentation broth, with higher oxygen capacity and diffusivity than that of the aqueous phase, can significantly enhance the oxygen absorption rate. As has been shown these enhancements are directly translatable into enhancements in fermenter productivity. The production can increase by factor of 3–6 or even more in the presence of an organic phase. Knowing the enhanced absorption rate equation and by coupling it with the mass balance equations of fermentation, the effect of dispersed phase on the production can be predicted exactly. The examples discussed show significant effects of the dispersed organic phase on the oxygen supply of microorganisms
Three-Phase Oxygen Absorption and Its Effect on Fermentation |
79 |
and on the production rate. The main problem caused by the dispersed organic phase might be its potential toxic or inhibitory effects which may be observed using living cells. A promising method to avoid this problem is to produce an oxygen-permeable polymeric membrane for coating the dispersed organic phase [21]. The results obtained by the authors in this respect can be regarded as the first steps. Further research is needed in order to improve the properties of the polymeric membrane, its mechanical resistance, etc., and to check its behavior during fermentation with various fermentation solutions,living cells and operation conditions.
Acknowledgements. The author would like to thank the Hungarian Research Foundation under Grant No. OTKA T 15864 for the financial support of this work.
References
1.Junker B, Hatton TA, . Wang DIC (1990) Biotechnology Bioengineering 35:578
2.Ghommidh C, Cutayer JM, Navarro JM (1986) Biotechnol Lett 8:13
3.Yamada S, Wada M, Chibata J (1978) J Environ Ferment Technol 56:29
4.Jansen NB, Flickinger M, Tsao GT (1984) Biotechnology Bioengineering 26:362
5.Sablayrolles JM, Goma G (1984) Biotechnology Bioengineering 26:148
6.Fuchs R, Wang DIC (1974) Biotechnology Bioengineering 16:1529
7.Liu YC, Chang WM, Lee CY (1999) Bioprocess Engineering 21:227
8.Sriram G, Rao YM, Suresh AK, Sureshkumar GK (1998) Biotechnol Bioeng 59:715
9.Schlegel HG, Ibraim HG (1980) Biotechnology Bioengineering 22:1877
10.Holst O, Enfors SO, Mattiasson (1982) Eur J Appl Microbiol Biotechnol 14:64
11.Adlercreutz P, Holst O, Mattiasson B (1982) Enzyme Microb Technol 4:395
12.Mimura A, Takeda I, Wakasa R (1973) Biotechnol Bioeng Symp 4:467
13.Ho CS, Ju LK, Baddour RF (1990) Biotechnol Bioeng 36:1110
14.Ju LK, Lee JF. Armiger WB (1991) Biotechnol Prog 7:323
15.Adlercreutz P, Mattiasson B (1985) Appl Microbiol Biotech 16:165
16.Leonhardt A, Szwajcer E, Mosbach K (1985) Appl Microbiol Biotech 21:162
17.Rols JL, Goma G (1989) Biotech Adv 7:1
18.Rols JL, Conderet JS, Fonade C, Goma G (1990) Biotechnology Bioengineering 35:427
19.Ju LK, Lee JF, Armiger WB (1991) Biotechnol Prog 7:323
20.Rols JL, Goma G (1991) Biotechnol Lett 13:7
21.Leung R, Poncelet D, Neufeld RJ (1997) J Chem Tech Biotechnol 68:37
22.Poncelet D, Leung R, Centomo L, Neufeld RJ (1993) J Chem Tech Biotechnol 57:253
23.Jia S, Li P, Park YS, Okabe M, (1993) J Ferment Bioeng 19:661
24.Liu HS, Chiung WC, Wang YC (1994) Biotechn Techn 8X:17
25.McMillan JD, Wang DIC (1990) Ann. N.Y. Acad. Sci. p 289
26.Yoshida F,YamaneT, Miyamoto Y (1970) Ind Eng Chem Proc Des Dev 9:570
27.Alper E, Deckwer WD (1981) Chem Engng Sci 36:1097
28.Nagy E, Blickle T, Ujhidy A (1986) Chem Engng Sci 41:2193
29 Janakirman B, Sharma MM (1985) Chem Engng Sci 40:235
30.Holstvoogd RD, van Swaaij WPM, van Dierendonck LL (1988) Chem Engng Sci 43:2181
31.Wimmers OJ, Paulussen R,Vermeulen DP, Fortuin JMH (1984) Chem Engng Sci 39:1415
32.Demmink JF, Mehra A, Beenackers AACM (1998) Chem Engng Sci 53:2885
33.Holsvoogd RD, Ptasinski KJ, van Swaaij WPM (1986) 41:867
34.Zarzycky R, Chacuk A (1993) Absorption: Fundamentals and Application, Pergamon Press, Oxford
35.Mehra A, Pandit A, Sharma MM (1988) Chem Engng Sci 43:913
36.Vinke H, Hamersma PJ, Fortuin JMH (1992) Chem Engng Sci 48:2197
80 |
E. Nagy |
37.Bruining WJ,Joosten GEH,Beenackers AACM,Hofman H (1986) Chem Engng Sci 41:1873
38.Mehra A (1988) Chem Engng Sci 43:899
39.Littel RJ,Versteeg GF, van Swaaij WPM (1994) AIChE J 40-1629
40.Nagy E, Moser A (1995) AIChE J 41:23
41.Karve S, Juvekar VA (1990) 45:587
42.Brilman DWF,van Swaaij WPM,Versteeg GF (1998) Chemical Engineering and Processing 37:471
43.Brilman DWF (1998) Mass transfer and chemical reaction in gas-liquid-liquid Systems, Thesis Twente
44.Lin C, Zhou M, Xu CJ (1999) Chem Engng Sci 54:389
45.Junker BH, Wang DIC, Hatton TA (1990) Biotechnology Bioengineering 35:586
46.Nagy E (1995) Chem Engng Sci 50:827
47.Froment GF, Bischoff KB (1979) Chemical Reactor Analysis and Design, Wiley, New York
48.Nagy E (1998) Hung J Ind Chemistry 26:229
49.van Ede CJ, van Houten R, Beenackers AACM (1995) Chem Engng Sci 50:2911
50.Brilman DWF (1998) Mass transfer and chemical reaction in gas-liquid-liquid Systems, Thesis Twente, p 143
51.Mehra A, Sharma MM (1985) Chem Engng Sci 40:2382
52.Lekhal A, Chaudhari RV, Wilhelm AM, Delmas H (1997) Chem Engng Sci 52:4069
53.Chaudhary RV, Jayasree P, Gupte SP, Delmas H (1997) Chem Engng Sci 52:4197
54.Brilman DWF, Goldschmidt MJV, Versteeg GF, van Swaaij WPM (2000) Chem Engng Sci 55:2793
55.Lowe KC, King AT, Mulligan BJ (1989) Biotechnol 7:1037
56.Chandler D, Davey MR, Lowe KC, Mulligan B (1987) Biotechnol Letters 9:195
57.Chibata I,Yamada S, Wada M, Izuo N,Yamaguchi T (1974) US Patent 3 850 783
58.Adlercreutz P, Holst O, Mattiasson B (1984) Appl. Microbiol. Bitechnol 20:296
59.Munaretto F (1997) Evaluation of microencapsulated silicone oils as oxygen carriers in the production of dihydroxyacetone by Gluconobacter oxydans, Thesis, McGill University, Montreal
60.Danckwerts PV (1970) Gas-Liquid Reactions, McGraw-Hill, New York
61.Moser A (1981) Bioprocess Technology. Springer, Berlin Heidelberg New York
62.Schügerl K (1985) Bioreaktionstechnik Band 1. Salle+Sauerlaender, Frankfurt am Main
63.Sinclair CG, Ryder DN, (1975) Biotechnol Bioeng 17:375
64.Burden RL, Faires JD (1985) Numerical Analysis 3ed, Academic Press, Boston p.226
65. Nagy E (1996) 5th Word Congress of Chemical Engineering, San Diego Vol. III. p 711
66.Nagy E (1997) 11th Forum for Applied Biotechnology, Gent Vol. II. p 1573
67.Enfors SO, Hedenberg J, Olsson K (1990) Bioproc Eng 5:191
68.Kristiansen B (1994) Integrated design of a fermentation plant, the production of baker’s yeast,VCH, Basel
69.Kristiansen B (1994) Integrated design of a fermentation plant, the production of baker’s yeast,VCH, Basel, p 44
Received: July 2000

Microbial Sensors on a Respiratory Basis for Wastewater Monitoring
Klaus Riedel1, Gotthard Kunze2, Andreas König3
1 Leobschützer Strasse 28, 13125 Berlin, Germany
2Institut für Pflanzengenetik und Kulturpflanzenforschung, Corrensstrasse 3, 06466 Gatersleben, Germany, e-mail: kunze@ipk-gatersleben.de
3Universität Stuttgart, Institut für Siedlungswasserbau, Wassergüteund Abfallwirtschaft, Bandtäle 2, 70569 Stuttgart, Germany, e-mail: koenig@iswa.uni-stuttgart.de
In respect of their rapidity, their online capabilities, and their moderate costs, biosensing systems generally offer an attractive alternative to the existing methods of water analysis. Additionally, one particular advantage of microbial biosensors is the ability to measure direct effects on living cells, e.g., their respiratory activity and its alteration caused by environmental pollutants. It is true that microbial sensors, often do not provide the optimum solution for the determination of individual analytes when compared to established physico-chemical analysis methods. However, these biosensing devices are predestined for the summary determination of environmentally relevant compounds and their complex effects, respectively. For this reason,microbial sensors allow an integral evaluation of the degree of environmental pollution including the interaction of various compounds. Moreover,in some cases specific metabolic pathways in microorganisms are used,resulting in the development of microbial sensors for the more selective analysis for those compounds or pollutants, which cannot be measured by simple enzyme reactions, e.g., the determination of aromatic compounds and heavy metals.
This chapter gives an overview of microbiological biosensors on respiratory basis for the measurement of the following environmentally relevant compounds: inorganic N-com- pounds, heavy metals, organic xenobiotics and the estimation of sum parameters or so-called complex parameters such as BOD, ADOC, N-BOD, and the inhibition of nitrification.
Keywords. Microbiological biosensors, Wastewater, BOD, Nitrification, Organic compounds, Heavy metals
1 |
Introduction . . . . . . . . . . . . . . . . . . . . . . . . . . . . . . |
82 |
2 |
Structure and Function of a Microbial Sensor . . . . . . . . . . . |
83 |
2.1 |
Design of a Microbial Sensor . . . . . . . . . . . . . . . . . . . . . |
84 |
2.2 |
Function and Specialties of Microbial Sensors . . . . . . . . . . . |
84 |
3 |
Applications of Microbial Sensors in Water Monitoring . . . . . . |
86 |
3.1 |
General Considerations . . . . . . . . . . . . . . . . . . . . . . . . |
86 |
3.2 |
Determination of Sum Parameters . . . . . . . . . . . . . . . . . . |
86 |
3.2.1 |
Biochemical Oxygen Demand (BOD) . . . . . . . . . . . . . . . . |
86 |
3.2.1.1 |
BOD-Sensors . . . . . . . . . . . . . . . . . . . . . . . . . . . . . . |
86 |
3.2.1.2 |
Differences Between SensorBOD and BOD5 . . . . . . . . . . . . . |
87 |
3.2.1.3 |
Improvement of the Coincidence of SensorBOD and BOD5 |
|
|
by Selection of Suitable Microorganisms . . . . . . . . . . . . . . |
90 |
3.2.1.4 |
Improvement of the Coincidence of SensorBOD and BOD5 |
|
|
by Pre-incubation of the Sensor with Wastewater . . . . . . . . . . |
93 |
|
Advances in Biochemical Engineering/ |
|
|
Biotechnology,Vol. 75 |
|
|
Managing Editor: Th. Scheper |
|
|
© Springer-Verlag Berlin Heidelberg 2002 |
|

82 |
K. Riedel, G. Kunze, A. König |
|
3.2.1.5 |
Improvement of the Coincidence of SensorBOD and BOD5 |
|
|
by Pretreatment of Wastewater Samples . . . . . . . . . . . . . . . |
94 |
3.2.1.6 |
Calibration of the BOD-Sensor . . . . . . . . . . . . . . . . . . . . |
96 |
3.2.1.7 |
Modifications of Transducers for the Design of BOD-Sensors . . . |
96 |
3.2.2 |
Determination of Available Dissolved Organic Carbon (ADOC) . |
97 |
3.2.3 |
Determination of Toxicity . . . . . . . . . . . . . . . . . . . . . . . |
97 |
3.2.4 |
Determination of the Activity and the Inhibition of Nitrification . |
98 |
3.3 |
Determination of Individual Substances . . . . . . . . . . . . . . . |
101 |
3.3.1 |
Determination of Inorganic Substances . . . . . . . . . . . . . . . |
101 |
3.3.1.1 |
N-Compounds . . . . . . . . . . . . . . . . . . . . . . . . . . . . . |
101 |
3.3.1.2 |
Inorganic S-Compounds . . . . . . . . . . . . . . . . . . . . . . . |
103 |
3.3.1.3 |
Heavy Metals . . . . . . . . . . . . . . . . . . . . . . . . . . . . . . |
103 |
3.3.1.4 |
Cyanide . . . . . . . . . . . . . . . . . . . . . . . . . . . . . . . . . |
104 |
3.3.2 |
Determination of Organic Compounds . . . . . . . . . . . . . . . |
105 |
3.3.2.1 |
Phenols and Polycyclic Aromatic Hydrocarbons . . . . . . . . . . |
105 |
3.3.2.2 |
Halogenated Aromatics . . . . . . . . . . . . . . . . . . . . . . . . |
109 |
3.3.2.3 |
Detergents . . . . . . . . . . . . . . . . . . . . . . . . . . . . . . . |
111 |
4 |
Conclusion . . . . . . . . . . . . . . . . . . . . . . . . . . . . . . . |
111 |
References . . . . . . . . . . . . . . . . . . . . . . . . . . . . . . . . . . . . |
112 |
|
List of Abbreviations
ADOC |
Available Dissolved Organic Carbon |
AOX |
Adsorbate Fraction of Organic Halogenated Compounds |
BOD |
Biochemical Oxygen Demand |
2,4-D |
2,4-Dichlorphenoxy acid |
LAS |
Linear Alkylbenzene Sulfonates |
PAH |
Polycyclic Aromatic Hydrocarbons |
PCB |
Polychlorinated Biphenyls |
1 Introduction
The increasing pollution of the environment especially with toxic compounds and substances presenting a potential human health risk is a problem of enormous importance. Therefore, a rapid and sensitive analytical control of the environment is necessary. In general, it is beneficial if analytical methods are simple and rapid to perform, if they have a sufficient sensitivity and precision and, finally, if all this is possible at reasonable costs. However, traditional instrumental analysis is very costly and time-consuming. As an example, the average cost of a laboratory analysis for environmental samples is in the range of $130– $200, whereas it is generally agreed that a price of $1–$15 would be desirable [1].
All these requirements can be met with biosensors. Biosensors are the combination of a biological component consisting of microorganisms, enzymes, an-
- #
- #15.08.20134.04 Mб15Hastie T., Tibshirani R., Friedman J. - The Elements of Statistical Learning Data Mining, Inference and Prediction (2002)(en).djvu
- #
- #
- #
- #
- #
- #
- #
- #15.08.201315.44 Mб23Hudlicky M, Pavlath A.E. (eds.) - Chemistry of Organic Fluorine Compounds 2[c] A critical Review (1995)(en).djvu
- #