

History of Modern Biotechnology II
.pdf50 |
K. Schügerl |
(GOD). Updike and Hicks were the first to immobilize a (GOD)-receptor in a gel. [117]. Enzyme electrodes were also developed by Reitnauer [118]. The first analytical instrument with immobilized enzyme was Model 23 A was put on the market by Yellow Springs Laboratory [119]. Lactate analyzer 640 La Roche was the next commercial instrument [120]. The first enzyme-thermistor was developed by Mosbach [121], and Loewe and Goldfinch [122] developed the first optical sensor. A bacterium was used as receptor instead of enzyme for alcohol analysis by Divies [123]. Cell organelles were used by Guibault for NADH analysis [124], and synzymes by Ho and Rechnitz [125]. Antibodies were introduced by Janata [126] and receptor proteins by Belli and Rechnitz [127] for biosensors. In the last 15 years, the different types of biosensors were being developed [128]. Their application is restricted to laboratory investigations. They are often used in flow injection analysis (FIA) systems as chemically specific detectors [129, 130]. A short analysis time is a prerequisite for process control. Flow-injection analysis, with response times of few minutes, is especially suitable for on-line process monitoring. Flow-injection analysis, developed by Ruzicka and Hansen [131], became popular in the last twenty years in both chemistry [132] and biotechnology [133].
2.5.3
On-line Sampling, Preconditioning and Analysis
The prerequisites of on-line process monitoring are aseptic on-line sampling, sample conditioning, and analysis. The first on-line sampling systems used a steam flushed valve system, consisting of a sampling transfer-tube from the reactor to the analyser, steam supply, a condenser, and four valves for successively sterilizing the transfer tube, withdrawing the sample, and cleaning the transfer tube. Such systems were used for on-line sampling by Leisola et al. [134, 135]. The medium losses, which were considerable, were reduced by miniaturization [136, 137]. Dialysers were the first cell-free sampling systems [138, 139, 140]. Later on, UF membrane filtration was used for sampling and analysis of low molecular-weight analytes, and MF membrane filtration for sampling and analysis of proteins. The first external cross-flow aseptic membrane module that was integrated into a medium recirculation loop [141] was commercialized by B. Braun Melsungen (BIOPEM®); another system [142] was produced by Millipore. The first internal in situ filter for sampling [143] was commercialized by ABC Biotechnologie/Bioverfahrenstechnik GmbH. A coaxial catheter for cell-content sampling was developed by Holst et al. [144], but it was not commercialized. For gas sampling, silicon-membrane modules can be used [145].
Sample conditioning for the analysis of low-molecular-weight components of the medium consists of cell removal, protein removal, dilution or enrichment of the analytes, correction of pH and buffer capacity, removal of toxic components and bubbles, degassing the sample, suppression of cell growth by growth inhibitors, etc. [146].
Modern on-line monitoring systems offer automated sampling, sample conditioning, and analysis [147–149]. Short sampling-, preconditioning-, and analysis times are prerequisites for process control. The internal in situ sampling
Development of Bioreaction Engineering |
51 |
system and flow injection analysis with response times of few minutes are especially suitable for on-line process monitoring. On-line gas chromatography (GC) [150, 151, 152] and high performance liquid chromatography (HPLC) [153, 154] are used for process monitoring as well, but their analysis times are several minutes. Mass spectrometry is used for in-line off-gas analysis [155]. Lately, in situ process monitoring with near-infrared Fourier transform (NIR-FT) spectroscopy [156] and 2D-fluorescence spectroscopy [157] became possible. The present state of bioprocess monitoring has been described by Schügerl [130, 158].
2.5.4
Process Control
The classical low-level automatic controls include analog-, on off, sequence-, and feedback control [159, 160].
Low-level controllers are used for the control of flow (PI), gas pressure (PI), temperature (PID), rotational speed of the stirrer (PI), pH-value, dissolved oxygen (PI) and sequence (sterilization, batch and fed-batch process).
Modern control theory was developed between 1950 and 1960 and was applied in biotechnology in the 1970 s. At the same time, advanced computer hardware, especially microcomputers were being developed. Pioneers in computer control were Armiger and Humphrey [161], Bull [162], Hampel [163], Hatch [164], Jefferis [165], Lim [166], Weigand [167], and Zabriskie [168]. The development of computer control is well represented by presentations in the Congresses on Computer Application in Biotechnology [169–173]. The state of the art of control of bioreactor systems has been described by Wang and Stephanopoulos [174], by Lim and Lee [175], and by Bastin and Dochain [176].
2.6
Mathematical Models
The earliest models related growth to the growth-limiting substrate [85, 177–182], and were extended by including inhibition kinetics. (For a review, see Reference [183].)
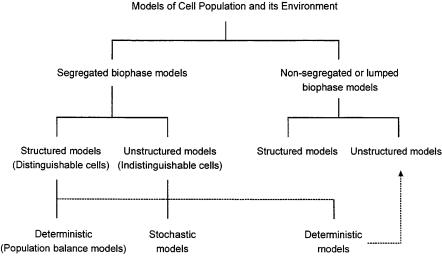
Later, models of cell population with segregated and structured models were been developed. Tsuchiya et al. [184] classified the mathematical models of microbial populations according to Fig. 1. Segregated models consider the heterogeneity of individuals, whereas structured models take the various cell components into account.
Ramkrishna et al. [185, 186] introduced cybernetic modeling, which assumes that the cells choose the possible pathways that optimize their proliferation. Shuler et al. [187, 188] developed large-scale computer models for the growth of a single cell. Other structured cell models, developed by Perretti and Bailey [189, 190], take into account the perturbation of the metabolism that occurs as a result of the introduction of recombinant plasmids. The genetically structured models of Lee and Bailey [191] consider plasmid replication in recombinant microorganisms. Other models deal with the proliferation rate influenced by
52 |
K. Schügerl |
Fig. 1. Classification of mathematical models of microbial population [144]
exogenous growth factors [191]. The metabolic engineering models, recommended by Bailey [192], use the known stoichiometric structure of the intracellular reaction network by assuming a quasi-steady state of the intermediate intracellular metabolites, in order to obtain intracellular fluxes.
However, for process optimization and control, simple structured (so-called compartment) models are used. Harder and Roels compiled common twoand three-compartment models in their review [193].
Several mathematical models, based on the cellular regulation model of Jacob and Monod [194], were developed for the genetic control of enzyme synthesis. These publications were reviewed by Harder and Roels [193]. A typical process model was presented by Bellgardt [195].
3
Interrelation Between Physical, Chemical and Biological Processes
The prerequisites for the determination of the interrelation between physical chemical and biological processes are:
1)closely monitored and controlled cultivation;
2)monitoring of the key fluid-dynamic properties;
3)monitoring of the concentrations of the key medium components;
4)monitoring of the concentration and biological state of the cells.
Very few investigations are known that fulfil all of these essentials, but several have been published that satisfy two or three of them.
Development of Bioreaction Engineering |
53 |
3.1
Influence of Fluid Dynamics and Transport Processes on Microbial Cultures
Most of the microbial cultivations are performed with monocultures. The important prerequisite is a monoseptic operation, using sterile medium and avoiding infection during the cultivation. The sterility of the bioreactors, necessary for the large-scale production of penicillin, was accomplished by the development of suitable rotating seals for the stirrer shaft. The connections, which are necessary for the fluid-dynamic and mass-transfer measurements, impair the performance of the process and the sterility of the system. Therefore, special setups and runs are necessary for the evaluation of these properties.
The determination of the specific power input (P/V) is only possible for large reactors, because instruments for torque measurement with torsion dynamometer and strain gauges are on the market only for large stirrers. Power monitoring with a wattmeter is only accurate for large reactors, for which the power uptake by frictional losses at the rotating seals of the stirrer shaft are negligible in comparison with the power uptake by mixing and gas dispersion. Therefore, for investigations in laboratory stirred-tank (ST) reactors, power-input data are not available. The specific power input can be calculated from the aeration rate in bubble-column (BC)- and airlift-tower-loop (ATL) reactors. The measurement of the gas hold-up in ST reactors is difficult. In BC and ATL reactors, it can be calculated from the pressure difference between the bottom and the headspace, and by monitoring the liquid level with capacity sensors. Steel and Maxon [196–198] performed the first systematic investigation of the influence of specific power-input on fermentation performance. They investigated the production of Novobiocin by Streptomyces niveus in stirred-tank reactors of different capacity (20 l, 250 l, 3000 l, and 6000 l) and with various impellers [196–198]. Their main interest was the dependence of gas hold-up (eG), oxygen transfer rate (OTR), and productivity (Pr) on the specific power input (P/V), speed (N), and diameter (dN) of the impeller, the aeration rate (QG) and the viscosity of the culture medium (h). In a review, Cooney and Wang compared the OTR and OTR-efficiencies – with regard to power input – of yeast, Endomyces, and Streptomyces) in cultures in different industrial reactors varying in volume form 30 to 128 m3 [199].
Based on the early investigations, the Rushton impeller became the standard stirrer in biotechnology. Only recently, new impellers such as the Scaba agitator and hydrofoil agitators (Lightnin A315 and Prochem Maxflow T), with higher mixing and oxygen transfer efficiencies, have come into used (see [200, 201]).
In the early days of bioprocess technology, bubble column reactors were preferred, because it was easier to maintain their sterility. After the sterile rotation seal for stirrer shaft was developed, ST reactors became the standard reactors for industrial production, because of their flexibility and high performance, especially for highly viscous culture media. AS reactor size increased, ST reactors were replaced by bubble-column (BC)- and airlift-tower-loop (ATL) reactors, mainly in the aerobic wastewater treatment plants of chemical factories. Comparison of these reactor types indicated that ST is a high-performance reactor with low OTR-efficiency with regard to the power input, whereas BC

54 |
K. Schügerl |
and ATL are medium performance-reactors with high OTR-efficiency with regard to the power input [202–205]. Therefore, less heat is evolved during the operation in BC and ATL reactors than in ST reactors.
Fiechter and Adler [206, 207] compared the performances of compact stirred-loop (CSL)-reactors with overall volume of 50 l, 550 l, an ATL reactor with 2300 l ATL overall volume, a 100 l torus reactor, and 7 l, 30 l standard STs, by cultivating the yeast Trichosporon cutaneum,, which is insensitive to glucose repression and does not produce ethanol under oxygen limitation. Therefore, there is a direct relationship between the rates of growth and of oxygen uptake. The growth rate can be calculated from the OTR, and the cell concentration from the consumed oxygen. Xanthan production by Xantomonas campestris in a highly viscous medium [204, 208, 209] and T. cutaneum cultivation in a medium of low viscosity [210, 211] were used for the comparison of the performances of 30 l, 1200 l ATL/BC bioreactors with 15 l, 300 l, 1500 l, 3000 l ST reactors by Deckwer et al [208–211]. They recommended relationships for the calculation of the volumetric mass transfer coefficient (kLa) as well. Several investigations were carried out with other microorganisms (Table 4). In Table 4
Table 4. Fluid-dynamic investigations with microbial cultivation systems. Stirred tank (ST), Airlift-tower-loop (ATL)-, Bubble-column (BC)-, compact-stirred-loop (CSL)-, and stirredloop (SL) reactors
Organisms |
Reactor |
Volume (L) |
Measurements |
Ref. |
|
|
|
|
|
Trichosporon cutaneum |
ST |
7, 30 |
P/V, OTR, RX |
[206, 207] |
T. cutaneum |
CSL |
50, 550 |
P/V, OTR, RX |
[206, 207] |
T. cutaneum |
ATL |
2300 |
P/V, OTR, RX |
[206, 207] |
T. cutaneum |
Torus |
100 |
P/V, OTR, RX |
[206, 207] |
T. cutaneum |
BC/ATL |
30, 1200 |
OTR, kLa, RX |
[210] |
T. cutaneum |
ST |
300, 1500, 3000 |
OTR, kLa, P/V |
[211] |
Xanthomonas campestris |
BC |
13 |
kLa |
[203] |
X. campestris |
ATL/BC |
50, 1200 |
kLa, OTR, MWPr , h |
[204] |
X. campestris |
ST |
1500 |
kLa, OTR, MWPr , h |
[204] |
X. campestris |
ST |
15, 100 |
OTR, MWPr , h |
[208] |
X. campestris |
ST |
15, 100 |
kLa, h, P/V |
[209] |
X. campestris |
SL |
900 |
kLa, h, P/V |
[209] |
X. campestris |
ST |
10 |
OTR, SR, SS |
[212] |
Escherichia coli |
ATL |
60 |
ML , pO2 , OTR, kLa, |
[205] |
E. coli |
ST |
10 |
OTR, kLa |
[205] |
E. coli |
ATL |
100 |
pO2 (z), dBl (r), d, eG (r), |
[213] |
|
|
|
OTR, kLa(r), a, wL(r), |
|
|
|
|
wBl (r), Tu(r), MTS(r), |
|
|
|
|
PS, EDS, TDT(r) |
|
Saccharomyces cerevisiae |
ATL |
4000 |
wL (r), RTD, tc , DL |
[214] |
S. cerevisiae |
ATL |
250 |
eG , tc |
[215] |
S. cerevisiae |
ATL |
4000 |
RTD |
[216] |
S. cerevisiae |
ATL |
4000 |
RTDG , wL , DL , DG |
[217] |
|
|
|
|
|
Development of Bioreaction Engineering |
|
|
55 |
|
Table 4 (continued) |
|
|
|
|
|
|
|
|
|
Organisms |
Reactor |
Volume (L) |
Measurements |
Ref. |
|
|
|
|
|
S. cerevisiae |
ATL |
80, 4000 |
RTDG , wL , eG , DL , DG , |
[218a, b, c] |
|
|
|
wB , (in riser and |
|
|
|
|
down-comer) |
|
Gluconobacter oxydans |
ST |
3.2, 90 |
ML |
[219] |
G. oxydans |
ST |
25,000 |
tc , pc, kLa, pO2 |
[220, 221] |
Methyphilus methylo- |
ATL |
30 |
ML , tc |
[222] |
trophus |
|
|
|
|
Candida utilis |
BC |
20 |
a |
[223] |
Leuconostoc mesenterius |
BC |
20 |
a |
[223] |
Penicillium chrysogenum |
ST |
7, 15, 41 |
ML , h |
[224] |
P. chrysogenum |
ST |
1500 |
RTDG |
[225] |
Aspergillus niger |
ST |
50 |
OTR |
[226] |
Bacillus subtilis |
ST |
14 |
pO2 (<100 ppb) |
[227] |
|
|
|
butanediol, pO2 |
|
|
|
|
(>100 ppb) acetoin |
|
Neurospora sitophila |
ATL |
1000 |
tc , eG, h |
[221] |
Chaetomium celluloly- |
BC |
40 |
tc , eG , h |
[228] |
ticum |
|
|
|
|
C. cellulolyticum |
ATL |
1300 |
eG , h, OTR, kLa |
[229] |
N. sitophila |
ATL |
1300 |
eG , h, OTR, kLa |
[229] |
C. cellullyticum |
BC |
40 |
kLa, h, s, a(calc.) |
[230] |
Kluyveromyces fragilis |
ATL |
120,000 |
kLa, OTR, pO2 , |
[231] |
K. fragilis |
ST |
15, 100 |
OTR |
[232a, b, c] |
Hansenula polymorpha |
ATL |
60 |
pO2 (z), , OTR, kLa, a, |
[232a, b, c] |
|
|
|
dBl , dS |
|
H. polymorpha |
ATL |
60 |
pO2 (z), dBl (r), dS , |
[213] |
|
|
|
eG (r), OTR, kLa, a, |
|
|
|
|
wL (r), wBl (r), Tu(r), |
|
|
|
|
MTS(r), PS, EDS, |
|
|
|
|
TDT(r) |
|
Streptomyces niveus |
ST |
20, 250, 15,000 |
P/V, OTR, Pr |
[196, 197, |
|
|
|
|
198] |
S. aureofaciens |
ST |
112,000 |
pO2 , h, T, kLa |
[233] |
S. avermitilis |
ST |
800 |
kLa, OTR, P/V |
[200] |
S. rimosus |
ST |
20, 60 |
Nu, h |
[234] |
S. albus |
ST |
20, 60 |
Nu, h |
[234] |
Streptomyces |
BC/ATL |
20,000 |
ML , tc , kLa, h, P/V, |
[235] |
|
|
|
pO2 , pH |
|
Bacillus licheniformis |
ST |
100, 67,500 |
kLa, h, P/V |
[236] |
Endomyces sp. |
ST |
20, 40 |
P/V, h |
[237] |
Aureobasidium pullulans |
ST |
8, 14 |
DOC |
[238] |
Candida boidinii |
ATL |
60 |
eG , dBl , dS , OTR, kLa, |
[239] |
|
|
|
a, P/V, Pr, pO2 , (con- |
|
|
|
|
current and counter- |
|
|
|
|
current operation) |
|
cell free system |
ATL(m.m) |
60 |
wL , DL ,wB (small, large |
[240] |
|
|
|
horizontal, vertical) |
|
cell free system |
ATL |
160 |
wL (r), wG (r), eG (r), |
[241] |
|
|
|
|
|
56 |
K. Schügerl |
only investigations are listed that were performed with stirred-tank-, bubble- column-, and airlift-tower-loop reactors with volumes of at least 20 l, because the fluid dynamics in smaller reactors considerably differs from those in large ones. In most of these investigations, the temperature, (T), the stirrer speed (N), the aeration rate (QG ), and the pH-value were controlled, and the dissolved-oxy- gen concentration (pO2 ) was monitored. In addition to the concentrations of the cell mass, the substrate (S), and the product (P), the composition of off-gas (O2 , CO2 ) were measured. Based on the mass balances, these data allow the evaluation of the specific growth rate (m), the specific substrate-uptake rate (s), and specific product-formation rate (p), as well as the volumetric mass-trans- fer coefficient (kLa), the rates of carbon dioxide formation (CPR) and oxygen uptake (OUR) and their ratio – the respiratory quotient (RQ). The yield coefficients of growth and product formation with regard to the substrate consumption (YX/S and YP/S) are calculated as well. These process variables were determined in several modern fluid-dynamic investigations that were performed during microbial cultivation. The relationships, which were developed on the basis of these investigations, differentiate between low viscous cultivation media (e.g., T. cutaneum) [211] and highly viscous non-Newtonian cultivation media (e.g., Xanthomonas campestris) [209]. However, this classification only holds true for systems in which the high viscosity is caused by the product (e.g., xanthan), and not by the microorganisms (fungi or streptomycetes). In the latter case, the cell morphology has a considerable influence on the interrelationship between fluid dynamics and transport processes, and – thus – on cultivation performance. Therefore, no generally applicable relationships exist.
With increasing reactor size, cell concentration, and medium viscosity, the distributions of substrate and dissolved oxygen in a reactor becomes less and less uniform. In large ST reactors, three relatively distinct regions with different mixing intensities exist: (a) a well mixed impeller region (micro-mixer); (b) a slightly mixed bulk region (macro-mixer); and (c) a wall region (dead water). The microorganisms circulate through the micro-mixer – with high substrate and dissolved oxygen concentrations, and the macro-mixer – with low substrate and dissolved oxygen concentrations. Depending on the circulation-time distribution, the microorganisms can become substrate and oxygen limited, respectively, in the macro-mixer region. Bajpai and Reuss considered the coupling of mixing and microbial kinetics in different reactors [226]. In ATL reactors, only the riser is aerated, therefore, oxygen limitation can occur in the downcomer, again depending on the circulation-time distribution in the reactor.
To investigate the dynamic behaviour of the cells in periodically varying environmental conditions, several authors cultivated yeast cells in a small reactor varying the dissolved oxygen concentration periodically and circulating the cell suspension through aerated and nitrogen gassed small reactors, respectively, or adding glucose pulse to the reactor and monitoring the concentrations of cell-mass, ethanol, dissolved oxygen, and NAD(P)H-dependent culture fluorescence [242–249]. The measurements in industrial Baker’s yeast ATL reactors indicated that the ethanol, which was produced by the yeast in the down-comer, was consumed in the riser, as long as the volume ratio of riser to down-comer
Development of Bioreaction Engineering |
57 |
was large enough [250, 251]. However, in large ST reactors with highly viscous media this phenomenon impairs reactor performance considerably [226].
3.2
Process Identification by Advanced Monitoring and Control
The regulation of metabolic flux and intracellular metabolite concentrations is exerted at various levels, which can be roughly divided into two categories: (a) modulation of enzyme specific activity or affinity to substrates; and (b) modulation of enzyme concentration. Typical examples of the first category include cooperative effects, allosteric effects, and covalent modifications, whereas the second includes transcriptional and translational control [252]. Metabolic control analysis (MCA) had already been developed in the 1970 s [253–256], but the practical application of these results was hindered by experimental difficulties. Twenty years later, the experimental techniques attained the necessary level for the application of MCA. In addition to the standard process variables (T, N, QG , pH, X, Pr, S, pO2 , O2 , CO2 ), several other variables have to be monitored for metabolite control of growth and product formation. Such variables are the concentrations of phosphate, ammonium, amino acids, primary metabolites (acetate, lactate, pyruvate, succinate, ethanol, etc.), the precursors of the secondary metabolites, NAD(P)H, RNA, DNA, proteins, and cell morphology [130, 257]. The heat generated by the microorganisms [258–263] and the intracellular enzyme activities and metabolites [264–269] are monitored as well. In special cases, the intracellular enzyme activities were measured on-line [270–274].
Using advanced measurement and control techniques in well-mixed reactors, highly reproducible data were obtained[275], allowing pathway analysis in microorganisms, e.g., glucose transport [276], oxygen utilization, and the determination of tricarboxylic acid cycle activity [277]. On-line process identification, by means of elemental and macroscopic balancing and advanced data processing, thus became possible [68, 69, 166, 278, 279].
3.3
Metabolic Engineering, Metabolic Flux Analysis
The regulation of metabolic networks is complex, because they involve several enzymes and a great variety of control mechanisms. Quantitative analysis of intracellular fluxes is an important tool for investigating control mechanisms.
Intracellular fluxes can be determined by measuring the rates of change of extracellular metabolite concentrations and using the total mass and carbon balance to calculate them. The determination of intracellular enzyme activities and metabolite concentrations can supplement these measurements. Particular fluxes along some pathways can be measured directly by NMR spectroscopy using 1H and 13C-, or 31P-isotopes. However, direct flux measurements with NMR is impaired by insensitivity. The combination of the mass balances and NMR spectroscopy allows the identification of the critical junctions (nodes) in a network that influence the partitioning of the fluxes, and the intracellular

58 |
K. Schügerl |
measurements permit the determination of the type of enzymatic modification. In Table 5, several investigations are compiled.
The extension of metabolite balancing with carbon-isotope labeling experiments allows the quantitative determination of the flux of bidirectional reactions in both directions [306]. The simultaneous application of flux balancing, fractional 13C-labeling of proteinogenic amino acids and twodimensional NMR-spectroscopy, as well as automatic analysis of the spectra, provides a rapid, double checked analysis of the fluxes [306]. The application of the combination of these techniques led to important new results on the
Table 5. Metabolic flux, metabolic pathway investigations (The NMR-measurements were combined with mass balancing)
Organism |
Method |
Product |
Reference |
|
|
|
|
Bacillus subtilis |
mass balancing |
|
[280] |
B. subtilis |
2D[1H, 13C]-NMR |
riboflavin |
[281] |
Corynebacterium glutamicum |
in-vitro-13C NMR |
lysine |
[282] |
C. glutamicum |
mass balancing |
lysine |
[283] |
C. glutamicum |
in-vitro-13C NMR |
lysine |
[284] |
C. glutamicum |
mass balancing |
lysine |
[285] |
C. glutamicum |
in-vivo-1H, 13C NMR |
lysine |
[286] |
C. melassecola |
mass balancing |
glutamic acid |
[287] |
Escherichia coli |
mass balancing |
(acetate) |
[288] |
E. coli |
mass balancing |
(acetate) |
[289] |
Hybridoma |
in-vivo-13C NMR |
MAB |
[290] |
Hybridoma |
in-vitro-13C NMR |
MAB |
[291] |
Hybridoma |
mass balancing |
MAB |
[256, 292] |
Penicillium chrysogenum |
mass balancing |
penicillin G |
[293] |
P. chrysogenum |
mass balancing |
penicillin G |
[258, 294] |
P. chrysogenum |
mass balancing |
penicillin G |
[295] |
Saccharomyces cerevisiaea |
in-vivo-31P NMR |
(ethanol) |
[295] |
S. cerevisiae |
mass balancing |
|
|
|
intracell. comp |
|
|
|
(ethanol) |
|
[297] |
S. cerevisiae |
mass balancing |
|
|
|
intra cell. comp. |
|
|
|
(ethanol) |
|
[298] |
S. cerevisiae |
mass balancing |
|
|
|
intra cell comp. |
|
|
|
(ethanol) |
|
[299] |
S. cerevisiae |
mass balancing |
(ethanol) |
[300] |
S. cerevisae |
mass balancing |
(ethanol) |
[301] |
Spodoptera frugiperda |
mass balancing |
DNA, RNA, protein |
[302] |
Streptococcus lactis |
mass balancing |
lactic acid |
[303] |
Zymomonas mobilis |
mass balancing |
|
|
|
intracell. enzyme activity |
|
|
|
ethanol |
|
[304] |
Z. mobilis |
in-vivo-31P NMR |
ethanol |
[305] |
Z. mobilis |
in-vivo-1H, 13C NMR |
ethanol |
[306] |
a immobilized cells

Development of Bioreaction Engineering |
59 |
distribution of metabolic flux in the cells. Recent results on metabolic engineering are reported in a special issue of Biotechnology Bioengineering [307].
3.4
Expert Systems, Pattern Recognition
Expert systems form a special class of artificial intelligence (AI) [308–310]. They handle problems by reasoning, drawing on a knowledge-base generated by human experts who are well versed in the problem in question [311]. Expert systems have been used in chemical engineering [312, 313] and biochemical engineering [314–339]. In Table 6, several biotechnological applications of expert systems are compiled that combine mathematical models with additional heuristic knowledge. Biotechnological processes are highly non-linear and – especially – non-stationary. Hence, their dynamic characteristics change with the time and, consequently, the parameters of the model vary during cultivation. A common way of coping with this problem is to use less detailed models and parameter-adaptive techniques to periodically fit these models to the actual process data. Another way of solving this problem is to use a distributive model – consisting of several sub-models – by which the accuracy of the Extended Kalman Filter used for the estimation of the procedure can be improved, and fuzzy reasoning techniques to incorporate additional heuristic knowledge about the process [332]. By using a modular set of artificial neural networks (ANN), it is possible to obtain reliable real-time state estimations and process predictions [333].
Pattern recognition is used to reconstruct characteristics of the system that are only partially known. Patterns in technological processes are defined as a
Table 6. Application of expert systems
Biological system |
References |
|
|
Baker’s yeast cultivation |
[314–316] |
Bacillus subtilis (a-amylase production) |
[317, 318] |
Escherichia coli cultivation |
[319–323] |
Escherichia coli (a-interferon production) |
[324] |
Lactobacillus casei (lactic acid production) |
[325, 326] |
Zymomonas mobilis cultivation |
[327] |
Penicillium chrysogenum (penicillin G production) |
[328, 329] |
Antibioticum production |
[330] |
Bacillus amyloliquefaciens (a-amylase production) |
[331] |
Glucoamylase production |
[327] |
Fusarium graminearum cultivation |
[328] |
Beer production |
[332–334] |
Enzyme production |
[335] |
Mammalian cell cultivation |
[336, 337] |
Hybridoma cell (monoclonal antibody production) |
[338] |
CHO-bioreactor development |
[324] |
a-interferon recovery and purification |
[324] |
Pilot plant operation in Eli Lilly Co. |
[339] |
|
|
- #
- #
- #15.08.20134.04 Mб14Hastie T., Tibshirani R., Friedman J. - The Elements of Statistical Learning Data Mining, Inference and Prediction (2002)(en).djvu
- #
- #
- #
- #
- #
- #
- #
- #15.08.201315.44 Mб23Hudlicky M, Pavlath A.E. (eds.) - Chemistry of Organic Fluorine Compounds 2[c] A critical Review (1995)(en).djvu