

1Foundation of Mathematical Biology / Foundation of Mathematical Biology
.pdfUCSF |
Conclusions |
|
|
|
|
The most important thing to understand is the relationship between statistics and probability distributions
Many statistics have been developed that have known distributions, and of which we can make use for tests of hypotheses
If you need to make use of serious parametric statistics, you should learn a package like R or S-plus
Statistics books are notoriously opaque in terms of just saying what the formula is!
If you are actually concerned with knowing whether you have a real result, use non-parametric tests with resampling methods to decide significance (next lectures).

UCSF
BP-203: Foundations of Mathematical Biology
Statistics Lecture II: October 23, 2001, 2pm
Instructors: Ajay N. Jain, PhD Jane Fridlyand, PhD
Email: ajain@cc.ucsf.edu
Copyright © 2001
All Rights Reserved
UCSF |
Non-parametric statistics |
|
|
|
|
Parametric statistics
♦Require an assumption about the underlying distributions of data
♦With those assumptions, they often provide sensitive tests of significance
♦However, the assumptions are often not reasonable, and it can be difficult to establish reasonableness
Non-parametric statistics
♦Make no assumption about distributional characteristics
♦Lacking those assumptions, they may not be as sensitive as appropriately applied parametric tests
♦However, one avoids the issue of whether a set of distributional assumptions is correct
♦Note: if your data are so close to the edge of nominal significance that you need to play games with different statistical tests, you have bigger problems to worry about.
UCSF |
Resampling and permutation-based methods |
|
|
|
|
Non-parametric statistics reduce reliance on distributional assumptions about your data
However, the distributions of the statistics themselves are often derived based on approximations that involve other assumptions
Resampling and permutation-based methods move toward deriving everything from the data observed
UCSF |
Lecture II |
|
|
|
|
Non-parametric statistical tests
♦Unpaired data
•Rank sum test
•Comparisons of distributions
·Kolmogorov-Smirnov test
·Receiver-operator characteristic curves: measure separation of distributions
♦Paired data
•Signed rank test
•Spearman’s rank correlation
•Kendall’s Tau
Resampling methods: Jane Fridlyand, PhD
♦The bootstrap (Efron), Jacknife
♦Using resampling methods for confidence intervals and hypothesis testing
UCSF |
Lecture III (Tuesday) |
|
|
|
|
General procedure for applying permutation-based methods to derive significance
Application of resampling and permutation methods to array-based data
General strategy for designing experiments involving large numbers of measurements
Homework will be assigned (it will not require programming)
UCSF |
A test of location: The rank-sum test |
|
|
|
|
The rank sum test is used to test the null hypothesis that two population distribution functions corresponding to two random samples are identical against the alternative hypothesis that they differ by location
Also called the Wilcoxon or Mann-Whitney rank sum test (Wilcoxon invented it)
UCSF |
A test of location: The rank-sum test |
|
|
|
|
Two samples with n1 and n2 observations
♦Order all observations from low to high
♦Assign to each observation its rank
♦For ties, assign each observation the average rank (e.g. if 3 tied observations occupy ranks 9, 10, 11, we assign each 10)
♦Sum the ranks for the set 1
♦Sum the ranks for the set 2
♦If n1 = n2, take the smaller sum: this is T
♦If not:
T1 = sum _ of _ smaller _ n
T2 = n1 (n1 + n2 +1) −T1
T = min(T1,T2 )
UCSF |
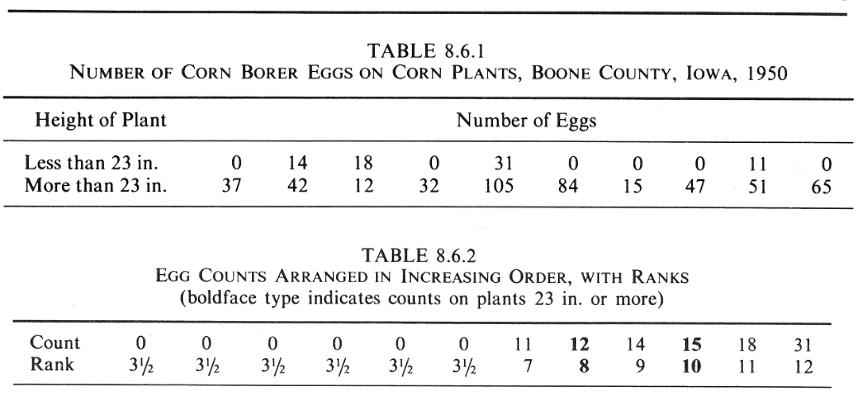
Example: Rank sum test |
|
|
|
|
So, T = 60
For small n, we can look up the numbers in a table

UCSF |
Rank sum significance |
|
|
|
|
For larger n, we must use an approximation based on the normal distribution:
Z = ( µ −T − 0.5) / σ
µ = n1 (n1 + n2 +1) / 2
σ =  n2 µ / 6
If Z > 1.96 we have significance at p = 0.05