

Pharmacokinetics and Metabolism in Drug Design Edited by D. A. Smith, H. van de Waterbeemd, D. K. Walker, R. Mannhold, H. Kubinyi, H.Timmerman
.pdf44 3 Absorption
Fig. 3.11 Structures of the fibrinogen receptor antagonist L-767,679 and its benzyl ester (L-775,318) analogue.
3.5
Models for Absorption Estimation
A number of models have been suggested to estimate the absorption potential in humans (see Table 3.2) [16, 17]. These vary from low throughput (in situ rat model) to high throughput (in silico) models. Most companies will use a combination of these approaches. The human colon adenocarcinoma cell lines Caco-2 and HT-29 are widely used as screening models for absorption [18, 19]. An alternative is offered by the MDCK cell line which is a faster growing cell [20]. These cell lines express typical impediments for absorption such those mentioned above for P-glycoprotein and CYP3A4 isoenzyme. They are thus believed to by a good mimic of the physicochemical and biological barrier of the g. i. tract.
Tab. 3.2 Models for absorption estimation.
•In vivo
•In situ (rat perfusion)
•In vitro (Caco-2 and other cell lines; Ussing chamber)
•Physicochemical properties
•In silico (in computro)
3.6
Estimation of Absorption Potential
A simple dimensionless number, absorption potential (AP), has been proposed to make first approximation predictions of oral absorption (Eq. 3.3) [3].
AP = log P + log Fnon + log (So · VL/Xo) |
(3.3) |
In this equation, log P is the partition coefficient for the neutral species, log Fnon the fraction of non-ionized compound, So the intrinsic solubility, VL the lumenal vol-

3.7 Computational Approaches 45
ume and Xo the given dose. By extending this approach the effect of particle size on oral absorption has also been modelled [21].
An approach to estimating the maximum absorbable dose (MAD) in humans is based on Eq. (3.4) [22,23].
MAD (mg) = S · ka · IFV · RT |
(3.4) |
S is the solubility in phosphate buffer at the pH 6.5 (in mg mL–1), ka the absorption rate constant in rats (min–1), IFV is the intestinal fluid volume (250 mL), and RT is the average residence time in the small intestine (270 min).
3.7
Computational Approaches
As mentioned above, hydrogen bonding and molecular size, in combination with lipophilicity have an important influence on oral absorption. A number of methods are available to compute these properties. A further example of the correlation between H-bonding, expressed as polar surface area, is found in Figure 3.12 [24,25]. Such a sigmoidal relationship is found for compounds which are absorbed by passive diffusion only and not hindered by efflux or metabolism, and which are not involved in active uptake. Otherwise deviations will be found [25].
Combination of several descriptors believed to be important for oral absorption have been used in various multivariate analysis studies [26]. The general trend is that a combination of size/shape and a hydrogen bond descriptor, sometimes in combination with log D, has good predictive value. At present such models do not account for the biological function of the membrane, such as P-gp-mediated efflux.
Fig. 3.12 Correlation between polar surface area (PSA) and intestinal absorption [24, 25].

46
References
1Van de Waterbeemd H, In: Oral Drug Absorption. Prediction and Assessment, Dekker, New York, Eds. Dressman J, Lennernäs, H, pp. 31–49.
2Yalkowski SH, Valvani SC, J. Pharm. Sci. 1980, 69, 912–922.
3Dressman JB, Amidon GL, Fleisher D,
J. Pharm. Sci. 1985, 74, 588–589.
4Amidon GL, Lennernas H, Shah VP, Crison JR, Pharm. Res. 1995, 12, 413– 420.
5Vacca JP, Dorsey BD, Schleif WA, Levin RB, McDaniel SL, Darke PL, Zugay J, Quintero JC, Blahy OM, Roth E, Sardana VV, Schlabach AJ, Graham PI, Condra JH, Gotlib L, Holloway MK, Lin J, Chen I-W, Vastag K, Ostovic D, Anderson PS, Emini EA, Huff JR, Proc. Natl Acad. Sci. USA 1994, 91, 4096–4100.
6Macheras P, Reppas C, Dressman JB (Eds) Biopharmaceutics of Orally Administered Drugs, Ellis Horwood, London,
1995.
7Conradi RA, Burton PS, Borchardt RT, In: Lipophilicity in Drug Action and Toxicology (Eds Pliska V, Testa B, Van de Waterbeemd H), pp. 233–252. VCH, Weinheim, 1996.
8Raevsky OA, Grifor’er VY, Kireev DB, Zefirov, NS, Quant. Struct. Activity Relat.
1992, 14, 433–436.
9Lipinski CA, Lombardo F, Dominy BW, Feeney PJ, Adv. Drug Del. Rev. 1997, 23, 3–25.
10Von Geldern TW, Hoffman DJ, Kester JA, Nellans HN, Dayton BD, Calzadilla SV, Marsch KC, Hernandez L, Chiou W, J. Med. Chem. 1996, 39 982–991.
11Wu C, Chan MF, Stavros F, Raju B, Okun I, Mong S, Keller KM, Brock T, Kogan TP, Dixon RAF, J. Med. Chem. 1997, 40, 1690–1697.
12Seelig A, Eur. Biochem. 1998, 251, 252–261.
13Travsch B, Oertel R, Richter K, Gramatt T, Biopharm. Drug Dispos. 1995, 16, 403–414.
14Spahn-Langguth H, Baktir G, Radschuweit A, Okyar A, Terhaag B, Ader P, Hanafy A, Langguth P, Int. J. Clin. Pharmacol. Ther. 1998, 36, 16–24.
15Prueksaitanont T, Deluna P, Gorham LM, Bennett MA, Cohn D, Pang J, Xu X, Leung K, Lin JH, Drug Metab. Dispos. 1998, 26, 520–527.
16Borchardt RT, Smith PL, Wilson G, (Eds) Models for Assessing Drug Absorption and Metabolism. Plenum Press, New York, 1996.
17Barthe L, Woodley J, Houin G, Fund. Clin. Pharmacol. 1999, 13, 154–168.
18Hidalgo IJ, In: Models for Assessing Drug Absorption and Metabolism (Eds Borchardt RT, Smith PL, Wilson G),
pp.35–50. Plenum Press, New York,
1996.
19Artursson P, Palm K, Luthman K,
Adv. Drug Deliv. Rev. 1996, 22, 67–84.
20Irvine JD, Takahashi L, Lockhart K, Cheong J, Tolan JW, Selick HE, Grove JR, J. Pharm. Sci. 1999, 88, 28–33.
21Oh D-M, Curl RL, Amidon GL, Pharm. Res. 1993, 10, 264–270.
22Johnson KC, Swindell AC, Pharm. Res. 1996, 13, 1794–1797.
23Lombardo F, Winter SM, Tremain L, Lowe III JA, In: Integration of Pharmaceutical Discovery and Development: Case Studies (Eds Borchardt RT et al.),
pp.465–479. Plenum Press, New York,
1998.
24Palm K, Luthman K, Ungell A-L, Strandlund G, Beigi F, Lundahl P, Artursson P, J. Med. Chem. 1998, 41, 5382–5392.
25Clark DE, J. Pharm. Sci. 1999, 88, 807–814.
26Van de Waterbeemd H, In: Pharmacokinetic Optimization in Drug Research: Biological, Physicochemical and Computational Strategies (Eds Testa B, Van de Waterbeemd H, Folkers G, Guy R), Verlag HCA, Basel, 2001, pp. 499–511.

Pharmacokinetics and Metabolism in Drug Design 47
Edited by D. A. Smith, H. van de Waterbeemd, D. K. Walker, R. Mannhold, H. Kubinyi, H. Timmerman Copyright © 2001 Wiley-VCH Verlag GmbH ISBNs: 3-527-30197-6 (Hardcover); 3-527-60021-3 (Electronic)
4
Distribution
Abbreviations
CNS |
Central nervous system |
Symbols |
|
Clp |
Plasma clearance |
Clu |
Unbound clearance of free drug |
∆log P |
Difference in log P values in octanol and cyclohexane |
H-bond |
Hydrogen bond |
kel |
Elimination rate constant |
log D7.4 |
Distribution coefficient at pH 7.4 (usually octanol/water) |
log P |
Partition coefficient (usually octanol) |
pKa |
Ionization constant |
Tmax |
Time to maximum observed plasma concentration |
Vd(f) |
Unbound volume of distribution of the free drug |
4.1
Membrane Transfer Access to the Target
Distribution of drugs across the membranes of the body can be regarded as passive diffusion. Similar considerations to those already outlined for oral absorption apply, although for significant penetration to intracellular targets the aqueous pore pathway does not readily apply. Similarly, as previously outlined the tight junctions of the capillaries supplying the CNS render the paracellular pathway very inefficient. These aspects of distribution were also described in Section 2.10, concerning the unbound drug model and barriers to equilibrium. Figure 4.1 depicts a scheme for the distribution of drugs. Penetration from the circulation into the interstitial fluid is rapid for all drugs since the aqueous pores present in capillary membranes have a mean diameter of between 50–100 Å. Thus there is ready access to targets located at the surface of cells such as G-protein coupled receptors. The exception to this is the cerebral capillary network, since here there is a virtual absence of pores due to the continuous tight intercellular junctions. For intracellular targets, if only the free drug is

48 4 Distribution
Fig. 4.1 Schematic illustrating drug distribution. Drug is present in the circulation as either free or bound, only the free drug is available for distribution, bound drug 1 in tissues is the drug bound to intracellular proteins and constituents, bound drug 2 is that bound to the cell and intracellular membranes.
considered, then at steady state the concentrations present inside the cell and in the circulation should be similar for a drug that readily crosses the cell membrane.
The overall amount of drug present in a tissue is determined by the amount that is bound either to intracellular proteins or, as discussed below, to the actual cell membranes themselves. Albumin is present in many tissues and organs and is available to bind drugs. Other intracellular proteins that can bind drugs include ligandin, present in liver, kidney and intestine, myosin and actin in muscular tissue and melanin in pigmented tissue, particularly the eye. Normally, as previously discussed, the free drug is that which determines the pharmacological activity. Note also, as previously stated, that the concentration of free drug in the circulation depends at steady state on free drug clearance and not the extent of plasma protein or even blood binding. In certain instances, as will be highlighted later, certain toxicities can derive directly due to membrane interactions (disruption, phospholipidosis, etc.). Key factors which determine the ease of crossing cell membranes are, lipophilicity, as defined by partition coefficient, hydrogen bonding capacity [1] and molecular size [2]. For simple small molecules with a minimum of nitrogenor oxygen-containing functions, a positive log D value is a good indicator of ability to cross the membrane. For more complex molecules, size and H-bonding capacity become important.
4.2
Brain Penetration
The work of Young et al. [1] provides a classic example of the role of increased H- bonding potential in preventing access to the CNS (crossing capillary and astrocyte cell membranes; Figure 4.2). In this example ∆log P provided a measure of H-bond- ing potential.
Much of the data produced in studies such as this has measured the partitioning of drugs into whole brain from blood or plasma. The importance of lipophilicity in brain distribution has therefore been highlighted in many reviews [3,4], however the majority of these have concentrated on total drug concentrations which, given the lipid nature of brain tissue, over-emphasizes the accumulation of lipophilic drugs.
Whilst giving some ideas of the penetration into the brain, such data are limited in understanding the CNS activity of drugs. Whole brain partitioning actually repre-

4.2 Brain Penetration 49
Fig. 4.2 Penetration of antihistamine compounds into the CNS correlated with Dlog P (log P cyclohexane – log P octanol ) as a measure of hydrogen bonding potential.
sents partitioning into the lipid of the brain, and not actually access to drug receptors. For instance, desipramine partitions into brain and is distributed unevenly [5]. The distribution corresponds to lipid content of the brain regions and not to specific desipramine binding sites. Thus correlations such as those above describe the partitioning of the drug into lipid against the partitioning of the drug into model lipid. For receptors such as 7TMs ECF concentrations determine activity. The ECF can be considered as the aqueous phase of the CNS. CSF concentrations can be taken as a reasonable guide of ECF concentrations. The apparent dramatic differences in brain distribution described for total brain, as shown above (three to four orders of magnitude), collapse to a small ratio when the free (unbound) concentration of drug in plasma is compared to the CSF concentration. Whole brain/blood partitioning reflects nothing but an inert partitioning process of drug into lipid material.
The lack of information conveyed by total brain concentration is indicated by studies on KA-672 [6], a lipophilic benzopyranone acetylcholinestrase inhibitor. The compound achieved total brain concentrations of 0.39 M at a dose of 1 mg kg–1 equivalent to the IC50 determined in vitro (0.36 M). Doses up to 10 mg kg–1 were without pharmacological effect. Analysis of CSF indicated concentrations of the compound were below 0.01 M readily explaining the lack of activity. These low concentrations are presumably due to high (unbound) free drug clearance and resultant low concentrations of free drug in the plasma (and CSF).
Free unbound drug partitioning actually reflects the fact that the drug is reaching the receptor and is having a pharmacological effect. Unless active transport systems are invoked the maximum CSF to plasma partition coefficient is 1. This should be contrasted to the 100or 1000-fold affinity of total brain compared to blood or plasma. The minimum partitioning based on a limited data set appears to be 0.1. Figure 4.3 compares lipophilicity (log D) in a series of diverse compounds that illustrate the limited range of partitioning. It should be noted that the term log D is not a perfect descriptor and some of the measures which incorporate size and hydrogen bonding may be better. Clearly though, the CNS is more permeable than imagined, allowing drugs such as sulpiride (Figure 4.3) to be used for CNS applications.

50 4 Distribution
Fig. 4.3 CSF concentration/free (unbound) plasma concentration ratios for neutral and basic drugs: 1, ritropirronium; 2, atenolol; 3, sulpiride; 4, morphine; 5, cimetidine; 6, metoprolol; 7, atropine; 8, tacrine; 9, digoxin; 10, propranolol; 11, carbamazepine; 12, ondansetron; 13, diazepam; 14, imipramine; 15, digitonin; 16, chlorpromazine and acidic drugs, a, salicylic acid; b, ketoprofen; c, oxyphenbutazone and d, indomethacin compared to log D.
The use of microdialysis has enabled unbound drug concentrations to be determined in ECF, providing another measurement of penetration across the blood–brain barrier and one more closely related to activity. A review of data obtained by microdialysis [7], showed that free drug exposure in the brain is equal to or less than free drug concentration in plasma or blood, with ratios ranging from 4 % for the most polar compound (atenolol) to unity for lipophilic compounds (e.g. carbamazepine). This largely supports the similar conclusions from the CSF data shown above. This relationship is illustrated in Figure 4.4.
Somewhat surprisingly, microdialysis has also revealed that the time to maximum concentration (Tmax) within the CNS is close to the Tmax value in blood or plasma, irrespective of lipophilicity. For example, the CNS Tmax for atenolol (log D7.4 = – 1.8) occurs at 2 min in the rat after intravenous administration [8]. In addition the rate of elimination (half-life) of atenolol and other polar agents from the CNS is similar to that in plasma or blood. The implication of these data is that poorly permeable drugs do not take longer to reach equilibrium with CNS tissue than more lipophilic agents
Fig. 4.4 Relationship between lipophilicity and CNS penetration expressed as free drug AUC ratio in brain to blood (data from reference [16]).
4.3 Volume of Distribution and Duration 51
as might be assumed. To explain these observations, it has been postulated that nonpassive transport (i.e. active) processes play a role in determining CNS exposure [7].
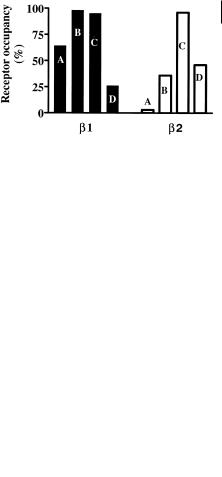
The fact that hydrophilic compounds have ready access to the CNS, albeit up to 10fold lower than lipophilic compounds, is not generally appreciated. In the design of drugs selectivity over the CNS effects has sometimes relied on making compound hydrophilic. Clearly this will give some selectivity (up to 10-fold), although this may not be sufficient. For instance β-adrenoceptor antagonists are known to cause sleep disorders. In four drugs studied the effects were lowest with atenolol (log D = – 1.6), intermediate with metoprolol (log D = – 0.1), and highest with pindolol (log D = – 0.1) and propranolol (log D = 1.2). This was correlated with the total amount present in brain tissue [9], which related to the log D values. Further analysis of this data [10] using CSF data and receptor affinity to calculate receptor occupancy, demonstrated that there was high occupation of the β1 central receptor for all drugs. Propranolol showed a low occupancy, possibly because the active 4-hydroxy metabolite is not included in the calculation. In contrast, occupation of the β2 central receptor correlated well with sleep disturbances. The incidence of sleep disturbances is therefore not about penetration into the CNS but the β1/β2 selectivity of the compounds (atenolol > metoprolol > pindolol = propranolol). The relative receptor occupancies are illustrated in Figure 4.5.
Fig. 4.5 Central receptor occupancy after oral administration of β-adrenoceptor antagonists: A, atenolol; B, metoprolol; C, pindolol; D, propranolol. The high occupancy of β1 receptors does not correlate with physicochemical properties (lipophilicity). The occupation of
β2 receptors correlates with sleep disturbances and the intrinsic selectivity of the compounds.
For a small drug molecule, penetration into the target may often be easier to achieve than duration of action. Assuming duration of action is linked to drug halflife, then distribution as outlined below can be an important factor.
4.3
Volume of Distribution and Duration
The volume of distribution of a drug molecule is, as described previously, a theoretical number that assumes the drug is at equal concentration in the tissue and in the circulation and represents what volume (or mass) of tissue is required to give that concentration. Volume of distribution, therefore, provides a term that partially reflects tissue affinity. However, it is important to remember that affinity may vary between different tissues and a moderate volume of distribution may reflect moderate concentrations in many tissues or high concentrations in a few. For an illustration of

52 4 Distribution
Fig. 4.6 Free (unbound) volumes of distribution of neutral (triangles) and basic (squares) drugs, also indicating amlodipine and nifedipine together with their free (unbound) clearance value (Clu).
how the manipulation of distribution affects systemic concentration the following examples will use free volume rather than total, although either could equally apply.
Taking the simplest case of neutral drugs, where increasing log D7.4 reflects increased binding to constituents of blood and cells and increased partitioning of drugs into membranes, there is a trend for increasing volume of distribution with increasing lipophilicity (Figure 4.6). In this case, for uncharged neutral molecules, there are no additional ionic interactions with tissue constituents. In most cases, the volume of distribution is highest for basic drugs ionized at physiological pH, due to ion-pair interactions between the basic centre and the charged acidic head groups of phospholipid membranes as described previously.
This ion pairing for basic drugs results in high affinity and also ensures that the ionized fraction of the drug is the predominant form within the membrane. This is particularly important, since most alkylamines have pKa values in the range 8-10 and are thus, predominantly in ionized form at physiological pH. The increase in volume for basic drugs is also illustrated in Figure 4.6.
The importance of volume of distribution is in influencing the duration of the drug effect. Since half-life (0.693/kel where kel is the elimination rate constant) is
determined by the volume of distribution and the clearance (Clu = Vd(f) × kel), manipulation of volume is an important tool for changing duration of action. Here the
small amount of drug in the circulation is important, since this is the compound actually passing through and hence available to the organs of clearance (liver and kidney). Incorporation of a basic centre into a neutral molecule is therefore a method of increasing the volume of distribution of a compound. An example of this is the discovery of the series of drugs based on rifamycin SV (Figure 4.7). This compound was one of the first drugs with high activity against Mycobacterium tuberculosis. Its clinical performance [11], however, was disappointing due to poor oral absorption (dissolution) and very short duration ascribed at the time to rapid biliary elimination (clearance).
Many different analogues were produced, including introduction of basic functions with a goal of increased potency, solubility, and reduction in clearance. Rifampicin is a methyl-piperazinyl amino methyl derivative [12] with much better duration and has become a successful drug. The basic functionality however does not alter clearance but increases volume substantially (Figure 4.7). Duration is enhanced further [12] by the more basic spiropiperidyl analogue, rifabutin (Figure 4.7). Again

4.3 Volume of Distribution and Duration 53
Fig. 4.7 Structures of (A) rifamycin, (B) rifampicin and (C) rifabutin, together with their pharmacokinetic properties. Volume of distribution (Vd) and plasma clearance (Clp) are for free unbound drug.
the desirable pharmacokinetic (and pharmacodynamic) properties are due to effects on volume of distribution rather than effects on clearance.
This strategy of modification of a neutral molecule by addition of basic functionality was employed in the discovery of the dihydropyridine calcium channel blocker, amlodipine. The long plasma elimination half-life (35 h) of amlodipine (Figure 4.8) is due, in large part, to its basicity and resultant high volume of distribution [13].
Fig. 4.8 Structures of the dihydropyridine calcium channel blockers, nifedipine (neutral) and amlodipine (basic).