

T H E E C O N O M I C S Y S T E M
E L E A N O R D O Y L E

Copyright 2005 |
John Wiley & Sons Ltd, The Atrium, Southern Gate, Chichester, |
|
West Sussex PO19 8SQ, England |
|
Telephone (+44) 1243 779777 |
Email (for orders and customer service enquiries): cs-books@wiley.co.uk
Visit our Home Page on www.wiley.com
All Rights Reserved. No part of this publication may be reproduced, stored in a retrieval system or transmitted in any form or by any means, electronic, mechanical, photocopying, recording, scanning or otherwise, except under the terms of the Copyright, Designs and Patents Act 1988 or under the terms of a licence issued by the Copyright Licensing Agency Ltd, 90 Tottenham Court Road, London W1T 4LP, UK, without the permission in writing of the Publisher. Requests to the Publisher should be addressed to the Permissions Department, John Wiley & Sons Ltd, The Atrium, Southern Gate, Chichester, West Sussex PO19 8SQ, England, or emailed to permreq@wiley.co.uk, or faxed to (+44) 1243 770620.
This publication is designed to provide accurate and authoritative information in regard to the subject matter covered. It is sold on the understanding that the Publisher is not engaged in rendering professional services. If professional advice or other expert assistance is required, the services of a competent professional should be sought.
Other Wiley Editorial Offices
John Wiley & Sons Inc., 111 River Street, Hoboken, NJ 07030, USA
Jossey-Bass, 989 Market Street, San Francisco, CA 94103-1741, USA
Wiley-VCH Verlag GmbH, Boschstr. 12, D-69469 Weinheim, Germany
John Wiley & Sons Australia Ltd, 33 Park Road, Milton, Queensland 4064, Australia
John Wiley & Sons (Asia) Pte Ltd, 2 Clementi Loop #02-01, Jin Xing Distripark, Singapore 129809
John Wiley & Sons Canada Ltd, 22 Worcester Road, Etobicoke, Ontario, Canada M9W 1L1
Wiley also publishes its books in a variety of electronic formats. Some content that appears in print may not be available in electronic books.
Library of Congress Cataloging-in-Publication Data
The economic system / Eleanor Doyle. p. cm.
Includes bibliographical references and index. ISBN-13 978-0-470-85001-5 (pbk. : alk. paper) ISBN-10 0-470-85001-9 (pbk. : alk. paper)
1. Economics. I. Title. HB171.5.D65 2005 330—dc22
2004027116
British Library Cataloguing in Publication Data
A catalogue record for this book is available from the British Library
ISBN-13 978-0-470-85001-5
ISBN-10 0-470-85001-9
Typeset in 11/15 New Baskerville by Laserwords Private Limited, Chennai, India Printed and bound in Great Britain by Scotprint, Haddington, East Lothian
This book is printed on acid-free paper responsibly manufactured from sustainable forestry in which at least two trees are planted for each one used for paper production.

C O N T E N T S
Chapter 1 The Economic System |
1 |
|
Chapter 2 Market Analysis: Demand And Supply |
35 |
|
Chapter 3 Beyond Demand: Consumers in the Economic System |
77 |
|
Chapter 4 Beyond Supply: Firms in the Economic System |
113 |
|
Chapter 5 Economic Activity: The Macroeconomy |
155 |
|
Chapter 6 Competition in the Economic System |
197 |
|
Chapter 7 Money and Financial Markets in the Economic System |
239 |
|
Chapter 8 |
Challenges for the Economic System: Unemployment and Inflation |
283 |
Chapter 9 |
Developing the Economic System: Growth and Income Distribution |
321 |
Glossary |
|
361 |
Index |
|
387 |

D E T A I L E D C O N T E N T S
Preface |
|
xiii |
|
Acknowledgements |
xv |
||
Chapter 1 The Economic System |
1 |
||
1.1 |
Introducing the Economic System |
1 |
|
1.2 |
Economic Resources and Markets |
2 |
|
1.3 |
The Economics Approach: Theory-Based Analysis |
6 |
|
1.4 |
Describing and Interpreting Economic Relationships |
9 |
|
1.5 |
Microeconomics and Macroeconomics |
14 |
|
|
1.5.1 The Environment for Economic Decisions |
16 |
|
1.6 |
Resource Scarcity and Prices in the Economic System |
18 |
|
|
1.6.1 Using Resources and Centralized Decision-Making |
20 |
|
1.7 |
Resource Use, Opportunity Costs and Efficiency |
22 |
|
1.8 |
Alliance of Economic Perspectives |
27 |
|
1.9 |
Positive/Normative Economics |
29 |
|
1.10 |
Summary |
30 |
|
Chapter 1 Appendix |
31 |
||
Review Problems and Questions |
31 |
||
Further Reading and Research |
32 |
||
References |
|
32 |
|
Chapter 2 Market Analysis: Demand and Supply |
35 |
||
2.1 |
Introduction |
35 |
|
2.2 |
Exchange – A Central Feature of Markets |
36 |
|
2.3 |
Demand |
40 |
|
|
2.3.1 Non-Price Determinants of Demand |
42 |
|
2.4 |
Supply |
|
46 |
2.5 |
Market Interaction: Demand and Supply |
52 |
|
|
2.5.1 |
Changes in Equilibrium |
55 |
2.6 |
Government Affecting Prices |
56 |
|
|
2.6.1 |
Price Ceiling |
56 |

viii |
T H E E C O N O M I C S Y S T E M |
|
2.6.2 |
Price Floor |
57 |
|
2.6.3 Problems of Price Ceilings and Floors |
57 |
|
2.7 |
Information and Knowledge in the Market System |
58 |
|
|
2.7.1 |
Decentralized Decision-Making – The Optimal Form of Organization? |
61 |
2.8 |
More on Equilibrium in the Demand and Supply Model |
63 |
|
2.9 |
A Market at Work: The Labour Market |
64 |
|
|
2.9.1 |
Labour Demand |
64 |
|
2.9.2 Labour Supply: Individual Supply Decision |
70 |
|
|
2.9.3 Equilibrium in the Labour Market |
71 |
|
2.10 |
Summary |
72 |
|
Review Problems and Questions |
73 |
||
Further Reading and Research |
74 |
||
References |
|
75 |
|
Chapter 3 Beyond Demand: Consumers in the Economic System |
77 |
||
3.1 |
Introduction |
77 |
|
3.2 |
Demand and the Importance of Consumers |
78 |
|
|
3.2.1 |
Consumption Goods |
79 |
3.3 |
Consumer Satisfaction – Utility |
81 |
|
|
3.3.1 The Assumption of Rationality in Economics |
83 |
|
3.4 |
Marginal Utility, Prices and the Law of Demand |
84 |
|
|
3.4.1 The Law of Demand – Income and Substitution Effects |
87 |
|
3.5 |
Demand, Consumers and Consumer Surplus |
90 |
|
|
3.5.1 Consumer Surplus and Consumer Welfare |
92 |
|
3.6 |
Consumers’ Response to Price Changes |
93 |
|
|
3.6.1 Price Elasticity of Demand |
94 |
|
|
3.6.2 Applications of Elasticity Analysis |
98 |
|
|
3.6.3 |
Other Elasticity Examples |
99 |
3.7 |
Consumer Choice and Product Attributes |
101 |
|
|
3.7.1 The Attribute Model: Breakfast Cereals |
101 |
|
3.8 |
Aggregate Consumer Behaviour |
103 |
|
3.9 |
Government Policies – Consumer Focus |
107 |
|
3.10 |
Summary |
109 |
|
Review Problems and Questions |
110 |
||
Further Reading and Research |
112 |
||
References |
|
112 |
|

D E T A I L E D C O N T E N T S |
ix |
Chapter 4 Beyond Supply: Firms in the Economic System |
113 |
||
4.1 |
Introduction |
113 |
|
4.2 |
Firms in Economic Action |
114 |
|
4.3 |
Why Organize an Economic System Around Firms? |
115 |
|
|
4.3.1 Decisions of Firms and the Role of Time |
116 |
|
|
4.3.2 |
Firm Revenue |
117 |
|
4.3.3 Firm Output (Product): Marginal and Average Output |
120 |
|
|
4.3.4 |
Firm Costs |
123 |
|
4.3.5 Marginal and Average Costs |
125 |
|
4.4 |
Maximizing Profits in the Long Run |
131 |
|
|
4.4.1 Profit Maximization, Normal Profit and Efficiency |
133 |
|
|
4.4.2 Maximizing Profits Over the Short Run |
137 |
|
4.5 |
Supply, Producers and Producer Surplus |
139 |
|
4.6 |
Producers’ Response to Price Changes |
140 |
|
4.7 |
Firms’ Investment Behaviour |
142 |
|
4.8 |
Government Influence on Supply and Production |
144 |
|
|
4.8.1 Using Subsidies – An Example with International Trade |
145 |
|
|
4.8.2 Environmental Taxes – Effects on Production |
147 |
|
|
4.8.3 |
Tax Incidence |
149 |
4.9 |
Summary |
150 |
|
Review Problems and Questions |
151 |
||
Further Reading and Research |
153 |
||
References |
|
153 |
|
Chapter 5 Economic Activity: The Macroeconomy |
155 |
||
5.1 |
Introduction |
155 |
|
5.2 |
Economic Activity and the Circular Flow |
156 |
|
5.3 |
Real Output and the Business Cycle |
158 |
|
|
5.3.1 Explanations/Causes of Business Cycles |
161 |
|
|
5.3.2 Implications for Business and Government |
165 |
|
5.4 |
Real Output and its Components |
165 |
|
|
5.4.1 Other Measures of Economic Activity |
167 |
|
|
5.4.2 Economic Activity: GNP, GDP and Income |
168 |
|
5.5 |
Equilibrium Economic Activity |
170 |
|
|
5.5.1 |
The Price Level |
171 |
|
5.5.2 |
Aggregate Demand |
172 |

x |
T H E E C O N O M I C S Y S T E M |
|
5.5.3 |
Aggregate Supply |
175 |
|
5.5.4 Bringing AD and AS Together: The Short Run |
177 |
|
5.6 |
Equilibrium Economic Activity and the Multiplier |
178 |
|
5.7 |
International Integration |
181 |
|
|
5.7.1 Explaining Growing International Trade |
182 |
|
|
5.7.2 Benefits and Costs of International Trade |
184 |
|
5.8 |
Government Activity |
187 |
|
|
5.8.1 Another Perspective on Economic Activity: The Economy |
|
|
|
|
as a Production Function |
190 |
5.9 |
Summary |
192 |
|
Review Problems and Questions |
193 |
||
Further Reading and Research |
195 |
||
References |
|
195 |
|
Chapter 6 Competition in the Economic System by Edward Shinnick |
197 |
||
6.1 |
Introduction |
197 |
|
6.2 |
Competition in the Economic System |
198 |
|
|
6.2.1 Competition as a Process |
199 |
|
|
6.2.2 Entrepreneurship, Discovery and the Market Process |
201 |
|
6.3 |
Alternative Models of Competition and Market Structure |
204 |
|
|
6.3.1 |
Perfect Competition |
206 |
|
6.3.2 |
Monopoly |
209 |
|
6.3.3 Perfect Competition vs. Monopoly |
211 |
|
|
6.3.4 |
Monopolistic Competition |
213 |
|
6.3.5 |
Oligopoly |
215 |
6.4 |
Austrian and Traditional Perspectives: A Comparison |
221 |
|
6.5 |
When Markets Fail |
223 |
|
|
6.5.1 Why Markets May Fail |
223 |
|
|
6.5.2 Implications of Market Failure |
225 |
|
6.6 |
Government Regulation of Competition |
226 |
|
|
6.6.1 |
Competition Spectrum |
229 |
|
6.6.2 Structure, Conduct and Performance |
229 |
|
|
6.6.3 |
Competition Policy |
230 |
6.7 |
Summary |
236 |
|
Review Problems and Questions |
236 |
||
Further Reading and Research |
237 |
||
References |
|
237 |
|

D E T A I L E D C O N T E N T S |
xi |
Chapter 7 Money and Financial Markets in the Economic System |
239 |
||
7.1 |
Introduction |
239 |
|
7.2 |
Money and Exchange |
240 |
|
7.3 |
Liquidity, Central Banks and Money Supply |
242 |
|
|
7.3.1 |
The Money Multiplier |
244 |
7.4 |
Money Demand |
246 |
|
7.5 |
The Money Market: Demand and Supply |
247 |
|
|
7.5.1 |
Which Interest Rate? |
248 |
|
7.5.2 |
Nominal and Real Interest Rates |
249 |
7.6 |
Quantity Theory of Money and Explaining Inflation |
251 |
|
|
7.6.1 |
Inflation Expectations, Interest Rates and Decision-Making |
253 |
7.7 |
The Foreign Exchange Market |
255 |
|
|
7.7.1 |
Demand in the Foreign Exchange Market |
256 |
|
7.7.2 |
Supply in the Foreign Exchange Market |
256 |
|
7.7.3 |
Exchange Rate Determination |
257 |
|
7.7.4 |
Causes of Changes in Exchange Rates |
258 |
7.8 |
Speculation in Markets |
260 |
|
|
7.8.1 |
Investment in Bond Markets |
263 |
|
7.8.2 |
Bonds, Inflation and Interest Rates |
266 |
7.9 |
Monetary Policy |
268 |
|
|
7.9.1 |
Difficulties in Targeting Money Supply |
269 |
|
7.9.2 |
Alternative Targets |
270 |
|
7.9.3 |
Taylor Rules and Economic Judgement |
272 |
7.10 |
International Monetary Integration |
272 |
|
|
7.10.1 Considering the Euro |
274 |
|
7.11 |
Summary |
278 |
|
Review Problems and Questions |
279 |
||
Further Reading and Research |
280 |
||
References |
|
280 |
|
Chapter 8 Challenges for the Economic System: Unemployment and Inflation |
283 |
||
8.1 |
Introduction |
283 |
|
8.2 |
Unemployment |
284 |
|
|
8.2.1 Labour Market Analysis: Types of Unemployment |
286 |
|
|
8.2.2 Analysing Unemployment: Macro and Micro |
291 |
|
|
8.2.3 Unemployment and the Recessionary Gap |
293 |
|
|
8.2.4 The Costs of Unemployment |
295 |
|

xii |
T H E E C O N O M I C S Y S T E M |
8.3 |
Inflation |
296 |
|
|
8.3.1 |
The Inflationary Gap |
297 |
|
8.3.2 Trends in International Price Levels |
299 |
|
|
8.3.3 Governments’ Contribution to Inflation |
303 |
|
|
8.3.4 Anticipated and Unanticipated Inflation – the Costs |
304 |
|
8.4 |
Linking Unemployment and Inflation |
306 |
|
|
8.4.1 A Model Explaining the Natural Rate of Unemployment |
309 |
|
|
8.4.2 Causes of Differences in Natural Rates of Unemployment |
312 |
|
8.5 |
Cross-Country Differences – Inflation and Unemployment |
314 |
|
|
8.5.1 |
Employment Legislation |
316 |
8.6 |
Summary |
317 |
|
Review Problems and Questions |
318 |
||
Further Reading and Research |
318 |
||
References |
|
319 |
|
Chapter 9 Developing the Economic System: Growth and Income Distribution |
321 |
||
9.1 |
Introduction |
322 |
|
9.2 |
Living Standards and Labour Productivity Relationships |
322 |
|
|
9.2.1 |
The Dependency Ratio |
327 |
9.3 |
Economic Growth over Time |
331 |
|
9.4 |
Modelling Economic Growth: The Solow Growth Model |
333 |
|
|
9.4.1 |
More on Savings |
337 |
|
9.4.2 The Solow Model and Changes in Labour Input |
341 |
|
|
9.4.3 The Solow Model and Changes in Technology |
343 |
|
|
9.4.4 Explaining Growth: Labour, Capital and Technology |
344 |
|
|
9.4.5 Conclusions from the Solow Model |
345 |
|
|
9.4.6 |
Endogenous Growth |
347 |
9.5 |
Income Distribution |
349 |
|
|
9.5.1 |
Intra-Country Income Distribution |
351 |
9.6 |
Summary |
356 |
|
Review Problems and Questions |
357 |
||
Further Reading and Research |
358 |
||
References |
|
358 |
|
Glossary |
|
361 |
|
Index |
|
|
387 |

P R E F A C E
A good economics student manages to understand the workings of the components within the economic system. An excellent student manages to appreciate the broader picture of the system with all its complexity of networks, interrelationships and organization. This requires an ability to understand economic models and their role in supporting analysis of economic issues plus an appreciation of their usefulness when we attempt to understand economic phenomena at a particular point in time, within their specific, and often complicated, microand macroeconomic contexts. It was with this in mind that I wrote The Economic System. The aim of
The Economic System is to provide an appropriate mix of topical and historical, practical and theoretical principles of economics that create a tool-box appropriate for understanding, analysing and addressing the economic issues that we face and attempt to understand.
Any writer or reader of economics textbooks, particularly those aimed at the principles of economics market, is aware of the variety of alternatives currently available. The Economic System is novel in that it does not follow a strict compartmentalization of chapters into microeconomics and macroeconomics distinctions but rather groups material appropriate to the central focus of the chapter to guide learning. The essentials of microand macroeconomic theory and analysis are provided within a context where their overlap within the ‘economic system’ is emphasized. A key focus of the book is on highlighting the relationships between microeconomic and macroeconomic analysis in a way that contributes to a better understanding of their intrinsic relationships and to a better appreciation of how the economic system works.
This approach addresses a limitation I have experienced where often even those students who appear to solidly grasp concepts and models display weaknesses in using them to better understand or analyse problems and to transfer their application to alternative settings or examples. Transferability of concepts is a real challenge especially for a subject that focuses on being a problem-solving discipline where students should learn skills useful to support decision-making, i.e. criteria for choosing between alternatives. An explicit aim in The Economic System is to clarify how models and concepts in economics are useful as tools that support rigorous, methodical analysis and not simply useful to solve mathematical ‘puzzles’.
xiv |
T H E E C O N O M I C S Y S T E M |
The use of a small number of chapters, nine in total, that focus on related material to highlight these system features of the economy achieves this end. There are some further topics that could also have been included in the text; however, I followed the view that learning should not be rushed and that understanding what is here is a solid foundation for further learning. The activity of information integration requires time and to learn and derive knowledge from that information is a complex cognitive process.
Another novel perspective is included with references to the ‘Austrian approach’ to economics and to entrepreneurship activity in particular, which is explained and referred to several times in the text. This presents students with an interesting focus on the process element of economic analysis as well as the product element provided in the appropriately comprehensive standard neoclassical analysis.
Real world examples and learning features
Also included within the text are many topical issues including globalization, outsourcing, EMU and the advantages and disadvantages of a single currency. Extensive end-of-chapter material is provided including mini case studies, further reading and review questions and problems. Students are required to develop their range of problem-solving, numerical, analytical and argumentative skills in generating their answers to these questions.
Online resource package
For students and lecturers, a comprehensive online support package is provided with the text. The website includes PowerPoint slides, multiple choice questions, weblinks, online glossary, and further review questions and exercises, plus model answers to all of the end-of-chapter questions provided.

A C K N O W L E D G E M E N T S
The contribution of a network of individuals made work on the text substantially more enjoyable and challenging. Thanks must primarily go to the many students in the Principles of Economics BA course at University College Cork who have contributed to the development of this book and whose feedback has been gratefully received and much appreciated. The teaching assistants, including Krystle Healy, James Nolan and Rory O’Farrell, who have supplied their expertise to support the course delivery and test-driven the course materials, also deserve special appreciation.
I am extremely grateful to many colleagues in the Department of Economics, UCC who have generated a positive working environment where the role of teaching is highly valued. For providing many references and nuggets to be followed up or just reflected upon throughout this project sincere thanks to Connell Fanning. Edward Shinnick, the author of Chapter Six, whose timely and focused contribution was vital in achieving the end result, is deserving of many thanks. For valuable and timely feedback on various chapters that was much appreciated, I must thank Eoin O’Leary, Brendan McElroy and Niall O’Sullivan. Thanks to Kay Morrison and Emer Doyle for editorial and proofreading assistance. For support with content and development of online materials I am very grateful to Eileen O’Sullivan, Krystle Healy and particularly Gerard Doolan who did trojan work.
Staff at Wiley were supportive above and beyond the call of duty and Anna Rowe comes in for particular thanks here along with Deborah Egleton, Rachel Goodyear and Steve Hardman.
Without family support from Fred and Robert, who bore the brunt of ‘book time’, no text would have been possible. Thank you. Any remaining errors of omission or commission are, of course, mine alone.

C H A P T E R 1
T H E E C O N O M I C S Y S T E M
L E A R N I N G O U T C O M E S
By the end of this chapter you should be able to:
Define what is meant by an economic system.
Describe the roles played by the main players in the system including individuals, firms and countries.
Describe how and why:
•the principle of exchange;
•the existence of markets; and
•the role of prices
are central to understanding how an economic system functions.
Clarify the role played by concepts, theories and models in economic analysis.
Explain how rules and laws facilitate and govern decisions within the economic system.
Illustrate how each of the following concepts:
•scarcity;
•opportunity cost; and
•economic efficiency
underpins economic analysis.
1 . 1 I N T R O D U C I N G T H E E C O N O M I C S Y S T E M
This chapter provides an introduction to the economic system to illustrate the interconnectedness between the different participants in and features of an economy, which contribute to economic decisions and outcomes. An economy can aptly be described as a ‘system’ as it relates to the following definitions of what a system entails:
•a group of interacting interrelated or interdependent elements forming a complex whole;

2 |
T H E E C O N O M I C S Y S T E M |
•an organized set of interrelated ideas or principles;
•a functionally related group of elements;
•an organized and coordinated method; a procedure.
The main participants and features of an economy are outlined in the chapters that follow. The study of economics focuses on identifying and trying to understand the patterns and relationships between these elements.
To begin it is useful to define what a study of the economic system entails. It involves understanding how:
•the production of goods and services is organized and influenced by individuals, organizations (including companies – both publicly and privately owned, trades unions, employer groups, etc.) and governments;
•products and services are used to satisfy the requirements of these same individuals, households, organizations and government.
Analysis of production includes the consideration of decisions regarding what is produced and how production decisions are made, which inputs to use in production (factors of production) and the way in which they are organized together to produce output. How production meets the demands of buyers is a central factor in analysis of the economic system.
Factors of production: the resources necessary for production. They include:
• |
land – all natural resources (including minerals and other raw materials); |
• |
labour – all human resources; |
• |
capital – all man-made aids to production that have been produced (e.g. |
|
machines, factories, tools). It is used with labour to produce and/or market |
• |
more goods and services; |
entrepreneurship in business organization and willingness to take busi- |
|
|
ness risks. |
1 . 2 E C O N O M I C R E S O U R C E S A N D M A R K E T S
A key focus of economists’ attention is the relationship between an economy’s resources, both in quantity and quality, and what it can produce again in quantity and quality. The concept of efficiency helps in the analysis of this relationship.

T H E E C O N O M I C S Y S T E M |
3 |
Economic efficiency: optimum production given the quantity and quality of available factors of production and their cost.
An economy is efficient if it is maximizing the output it can produce within the constraints of its available inputs or resources. These constraints may take the form of rules or laws governing how inputs may be used, such as limits to the hours people are permitted to work per week.
Economists’ focus on output and production is driven by an inherent interest in trying to understand how society could be better off and this is evident as far back as 1776 in An Inquiry into the Nature and Causes of the Wealth of Nations by Adam Smith, the acknowledged ‘father’ of economics. What is produced in an economy has a direct bearing on the income – the flow of money earned – and wealth – the stock of money held – of people in that economy.
When an economy increases the quantity of goods and services it produces and can sell the output, economic growth occurs.
Economic growth: an expansion in the quantity of goods/services produced and sold.
Once economic growth is faster than population growth, material living standards can rise.
Living standards: the level of material well-being of a citizen. It is generally measured as the value of a country’s production per person, e.g. UK national output divided by the population of the UK for a particular period of time.
Some data on international living standards are presented in Figure 1.1 for 20 countries with the highest living standards in 2002 (as reported by the OECD, the Organization for Economic Cooperation and Development). To ensure the data reported in Figure 1.1 can be compared, each country’s output was initially converted to the same exchange rate – here all values are in dollars.
Because of the different international prices of goods, a further adjustment was made to the data to take account of these purchasing power differences. This is called the purchasing power parity adjustment as explained in the text box. Figure A.1 in Chapter 1 Appendix contains living standards data for 2000 over a broader selection of counties.
Purchasing power parity (PPP) is a measure of the relative purchasing power of different currencies. PPP is the exchange rate that equates the price of a basket

4 |
T H E E C O N O M I C S Y S T E M |
Spain
Italy
Iceland
UK
Sweden
France
Finland
Germany
Netherlands
Australia
Austria
Japan
Denmark 
Belgium
Canada 
Ireland 
Switzerland
Norway 
USA 
Luxembourg 
0 10 000 20 000 30 000 40 000 50,000
F I G U R E 1 . 1 L I V I N G S T A N D A R D S , T O P 2 0 C O U N T R I E S 2 0 0 2 , ( U S D O L L A R S A N D P P P s )
Source: Main Economic Indicators, OECD, 2002See the nearby key term box for more on PPPs.
of identical traded goods and services in two countries. PPP is often very different from the current market exchange rate.
Since 1986 The Economist magazine has published a regular Big Mac Index. It indicates how many Big Macs dollars buy internationally when exchanged for local currencies. The Big Mac PPP is the exchange rate that would leave the Big Mac costing the same in the United States as elsewhere.
The logic underlying conversions using PPPs and not just standard exchange rates is that prices tend to be lower in poor economies, so a dollar of spending in a poor country buys more than a dollar in America. Using purchasing power parities takes account of these price differences. Comparing actual exchange rates with PPP often reveals differences. Some studies have found that the Big Mac Index is often a better predictor of currency movements than other more ‘theoretically rigorous’ currency models.
Since January 2004, The Economist also provides a Tall Latte Index where the focus is not on burgers but a cup of Starbucks coffee, another internationally available product.

T H E E C O N O M I C S Y S T E M |
5 |
Economists are interested in understanding the reasons behind economies’ growth experiences and the reasons underlying the cross-country disparity of living standards. Several explanations as to why such disparities arise are offered and in our study of the economic system we will touch on some of these.
To fully appreciate how an economy functions also involves an understanding of the political context within which economies work as this too has an influence on the output produced and the available resources.
Political economy is the term given to the study of how the rules, regulations, laws, institutions and practices of a country (or a state, region, province) have an influence on the economic system and its features.
Rules and laws on how resources and production can be organized and used influence the incentives for individuals and firms to conduct business and hence the output of an economy. One example would be rules on setting up new businesses and the time this takes.
Research indicates time needed for setting up a new business varies considerably internationally, taking only two days in Canada and costing US$280, and 62 days in Italy, costing US$3946 (Djankov, et al., 2001).
Rules and laws on how resources are shared or distributed among citizens also influence their income and wealth – if only a few receive most of the production (because of corruption or a caste system, for example) the income and wealth of the majority suffers.
How the value of output produced is distributed among an economy’s stakeholders depends on the configuration of each economic system and the choices on distribution that are made. Stakeholders in the economic system are the individuals and groups that depend on the system to fulfil their own goals (be it to meet demands, generate income, create employment, provide wages or salaries, provide goods and services . . . ) and on whom the economic system depends for its continued survival.
According to the above description of what an economy is, it is possible to interpret individual countries as economic systems, each with its individual economy, but it may also be useful, depending on some issues of interest to economists, to consider provinces, regions or cities as economies in their own right.
It is also often useful to examine an economy by focusing on sub-sections of organized resources within an economy, which are described as markets, e.g. the

6 |
T H E E C O N O M I C S Y S T E M |
market for cars, apples, or labour. Knowledge of how the economic system functions based on analysis of markets, production and expenditure decisions and how economies grow will help to enhance understanding of why economies perform so differently.
Markets: situations where exchange occurs between buyers and sellers or where a potential for exchange exists. Markets cover the full spectrum from physical locations where buyers and sellers meet to electronic markets (such as auction websites) facilitated by the Internet.
The familiar notion of a market where people come together in a particular location to buy and sell goods or services is the most straightforward definition of a market. The economist’s definition is broader and does not limit a market to a specific time and place.
For example, we can refer to the market for apples, which covers the opportunities that exist for buying and selling apples between individuals and firms. Markets for products or services can usually be examined by considering the price at which producers or sellers are willing to supply and sell – the supply or production side of a market – and the price buyers are willing to pay – the demand or consumption side of a market. Depending on the price of a product (amongst other factors) sellers and buyers make their economic decisions about which products to produce/buy and the quantities to produce/buy. The model of demand and supply presented in Chapters 2, 3 and 4 and again in Chapter 6 develop these two elements of the economic system further.
The basic elements of the economic system therefore, involve, the organization of production and supply, consumption and demand, markets, exchange, prices, and the rules or laws that facilitate and govern decisions by individuals, households and firms relating to all of these elements.
1 . 3 T H E E C O N O M I C S A P P R O A C H : T H E O R Y - B A S E D A N A LY S I S
In recent years the scope of economics has expanded considerably due to the breadth of applications that are possible based on the concepts, theories and models that constitute the foundations of the discipline.
Concepts, theories and models are simplified representations of phenomena, which are intended to serve as tools to aid thinking about complex entities or processes.

T H E E C O N O M I C S Y S T E M |
7 |
T A B L E 1 . 1 E C O N O M I C T H E O R Y A N D T H E P R O C E S S O F E C O N O M I C A N A L Y S I S
1.Identify a question/issue for analysis, e.g. the factors that explain why Luxembourg has relatively high living standards at a point/period in time.
2.Identify theory (and/or concepts and/or models) relevant to this issue, e.g. theory of economic growth that relates output and living standards to the quantity and quality of available factors of production.
3.From theory, formulate hypotheses about possible relationships between high living standards and high levels of education (affecting labour), investment (affecting capital) etc., e.g. one hypothesis would be that high living standards are caused by high levels of education.
4.Test the hypotheses against evidence (information/data) on high living standards in Luxembourg and competing potential explanations. From alternative explanations – e.g. education, investment, luck! – the economist must attempt to choose the most appropriate and convincing, given available evidence. To get to the root of the analysis it may also be necessary to focus on the causes of high levels of education or investment, which is not straightforward. If the cause of high levels of education (or investment) is high levels of income/living standards then the explanation is circular and is not very useful. Evidence used to test an hypothesis might be quantitative (numerical), or qualitative or a mixture of both, and might be published or might be collected by the economist themselves in interviews or surveys, for example.
5.Draw valid conclusions.
What constitutes what economists do is as much governed by the approach to analysis they use as by the issues they examine. Table 1.1 provides a framework illustrating how theory guides economic analysis.
An economic method of analysis involves using concepts, theories and models (that are transferable to a multitude of issues), which serve to structure thinking and clarify the fundamental features of interest in addressing an economic issue or answering an economic question. This method helps economists identify and organize the main features causing an economic phenomenon and perhaps rank the most important causes and effects and essentially to understand the most important features that explain how economies actually work. It is not sufficient to identify correlations between economic phenomena – high standards of living and education – because correlation is not causation! Overly focusing on data relationships without an underlying logical theory of causation is bad economics and does not give rise to valid conclusions. In relation to the example in Table 1.1

8 |
T H E E C O N O M I C S Y S T E M |
the essence of the issue is whether living standards in Luxembourg would be higher or lower at a particular time with different levels of education (or investment).
Models are sometimes criticized because of how they simplify reality but they are constructed in order to take into account the most important features of the economic system relevant to analysing a specific issue. For example, the standard economic model of supply and demand abstracts from all the various factors that feed into the determination of supply and demand to focus on the relationship between the price of a product and
•producers’ decisions of how much to supply at different prices (supply);
•buyers’ decisions of how much to purchase at different prices (demand).
Supply: the quantity of output sellers are willing to sell over a range of possible prices.
Demand: the quantity of output buyers are willing to buy over a range of possible prices.
The demand/supply model is the cornerstone of economic analysis (and is described in detail in Chapter 2) and is used throughout this book. We can acknowledge that a number of different factors feed into the decisions that suppliers (producers) make regarding what to produce, in what quantity and what price to charge. These decisions would take into account producers’ available resources of money, machinery, production technology and know-how.
In their theories and models, economists abstract from all other factors to consider the essence of how economic units or phenomena are related. In focusing on the relationship between price and demand, for example, we consider how demand relates to price and price alone. The approach treats all the other potentially intervening factors as if they were unchanging, allowing one relationship to be considered in isolation. This method followed by economists is described as the ceteris paribus assumption.
The ceteris paribus assumption: from the Latin the direct meaning of this term is all things being equal or unchanged.
This could be rephrased as the ‘economists are not stupid’ assumption! Economists know all things do not remain equal or unchanged. The power of the assumption allows them to construct models that highlight the fundamental nature of a relationship they are trying to describe and understand. Subsequently they use their models to incorporate other factors of most relevance to that relationship.
T H E E C O N O M I C S Y S T E M |
9 |
Economic analysis of demand can be extended to consider, for example, the effect that a general rise in income would have on a people’s decision regarding Demand. In the case where consumers’ incomes rise, ceteris paribus, we would expect rational consumers to buy more apples, or beans or CDs for example – more on this in Chapter 2! The objective of the model of demand is, therefore, not to simplify reality and assume that price is the only factor that feeds into consumers’ decisions but to create a model whereby the analysis of any factor that is relevant can be considered in a clear and concise framework.
Many models are used in economics, which serve similar purposes of allowing the complexity of an economic issue to be understood and sometimes future behaviour (e.g. of suppliers or buyers, or economies) to be predicted. Clearly, despite their models and concepts, economists do not always predict future behaviour or outcomes correctly. Just like weather prediction, the models do not always allow for all relevant factors that affect the outcome to be considered or in some cases probabilities of occurrences are under/overestimated. This is due to the inherent uncertainty in trying to predict economic outcomes that arise due to individual behaviour and decision-making. It is precisely because the future is uncertain that economists try to argue logically which potential outcomes are most likely or not.
1 . 4 D E S C R I B I N G A N D I N T E R P R E T I N G
E C O N O M I C R E L A T I O N S H I P S
In attempting to draw sound conclusions, economists often use facts and figures to test their economic arguments. They compute percentages, they use index numbers, draw and manipulate diagrams and they analyse trends in data over time. If you are comfortable with such activities, you should skip this section.
To compute a percentage we are interested in the proportionate change in a quantity or value. Saying that employment increased by 10 000 jobs does not provide as much information as if you know what the initial level of employment was.
Consider an economy where 125 000 people are employed. Increasing jobs by 10 000 represents a percentage increase of 8% which is found by:
Percentage change = (Change/initial value) 100
In this example the relevant figures are (10 000/125 000) 100 = 8%

10 |
T H E E C O N O M I C S Y S T E M |
With data on changes in employment produced monthly and quarterly in many economies it would be possible to compute percentage changes over these periods and examine whether the general trend were up or down, or whether any patterns emerged such as seasonal increases – temporary summer workers are usually employed for a few months and then are laid off, students return to college, etc. – and this affects employment figures.
Alternatively, quantities or values can be expressed in index number form allowing them to be presented relative to one base point in time. Consider UK employment statistics. Table 1.2 shows employment between 1999 and 2003 based to 1999 = 100. By setting a base year value (1999 = 100) it is easy to read off the relative percentage changes in employment, which declined for both women and men across manufacturing industries. The total figure is the weighted average of men and women.
In 1999 men represented 72% of the workers while women accounted for the other 28%. Taking a weighted average of 72% of the 1999 value for men and 28% of the value for women gives 100 overall (0.72 100 + 0.28 100 = 100). The same weights apply for 2000 and 2001 and changed to 73% and 27% for the final two years.
Index numbers are commonly used in describing trends in prices and in weighted averages of prices, such as the retail price index, consumer price index, wholesale price index. Assessing changes in prices is important for all economic analyses of any variables measured in money terms over time – income, output, wages and so
T A B L E 1 . 2 E M P L O Y M E N T
S T A T I S T I C S M A N U F A C T U R I N G
I N D U S T R I E S : I N D E X N U M B E R S
Year |
Total |
Men |
Women |
|
|
|
|
1999 |
100 |
100 |
100 |
2000 |
98 |
98 |
97 |
2001 |
93 |
94 |
92 |
2002 |
88 |
89 |
86 |
2003 |
85 |
86 |
82 |

T H E E C O N O M I C S Y S T E M |
11 |
on. To see why this is so take the example of a car firm that produced £500m worth of output in 1990 and £800m in 2000. These amounts are in nominal or current terms which means they are the actual value of production not adjusted for price changes. Without further investigation you might consider that the economic activity of the firm increased over time since its output expanded by £300m or 60%. However, if you knew that over the same period average output prices increased too then without further information it is impossible to know what proportion of the extra 60% is due to rising prices or to any additional quantity of output. If prices rose by 60% then the firm’s quantity of output would not have changed at all – only its monetary value.
It is possible to disentangle the two separate effects of price and quantity if we know the extent of the price rise over time. Assume it is 25% relative to prices in 1990. Essentially what is required is to quote output values in real terms so that the effect of price changes is removed and only quantity or real effects remain, as explained in the text box.
Nominal and real amounts: price and quantity effects
Changes in nominal amounts are made up of price and quantity effects. Economists are concerned with quantity effects.
e.g. Nominal change in value of output = change in price change in quantity
In the above example the nominal change in the value of output is £300m. Using 1990 as a base year we can compute the following:
Nominal output index |
1990 = 100 |
2000 = 160 |
[1990 = 500 2000 = 800] |
Price index |
1990 = 100 |
2000 = 125 |
|
A corresponding quantity index is found by dividing the nominal output index by the price index, i.e. (160/125) 100.
Quantity index |
1990 = 100 2000 = 128 [1990 = 500 2000 = 640] |
To double-check this is correct, the product of the volume and price indices should equal the total change in the nominal index (128 125)/100 = 160.
The real value of output in 2000 expressed in 1990 prices was £640m, representing a 28% increase in the quantity or volume of output.

12 |
T H E E C O N O M I C S Y S T E M |
kWh |
28 000 |
|
|
|
|
|
|
26 000 |
|
|
|
|
|
|
|
|
|
|
|
|
|
|
|
consumption |
24 000 |
|
|
|
|
|
|
22 000 |
|
|
|
|
|
|
|
|
|
|
|
|
|
|
|
|
20 000 |
|
|
|
|
|
|
|
18 000 |
|
|
|
|
|
|
Electricty |
16 000 |
|
|
|
|
|
|
14 000 |
|
|
|
|
|
|
|
|
|
|
|
|
|
|
|
|
12 000 |
|
|
|
|
|
|
|
10 000 |
|
|
|
|
|
|
|
0 |
1 |
2 |
3 |
4 |
5 |
6 |
|
|
|
Household size in persons |
|
|
||
F I G U R E 1 . 2 H O U S E H O L D
E L E C T R I C I T Y C O N S U M P T I O N A N D S I Z E
Source: Statistics Norway, 2004
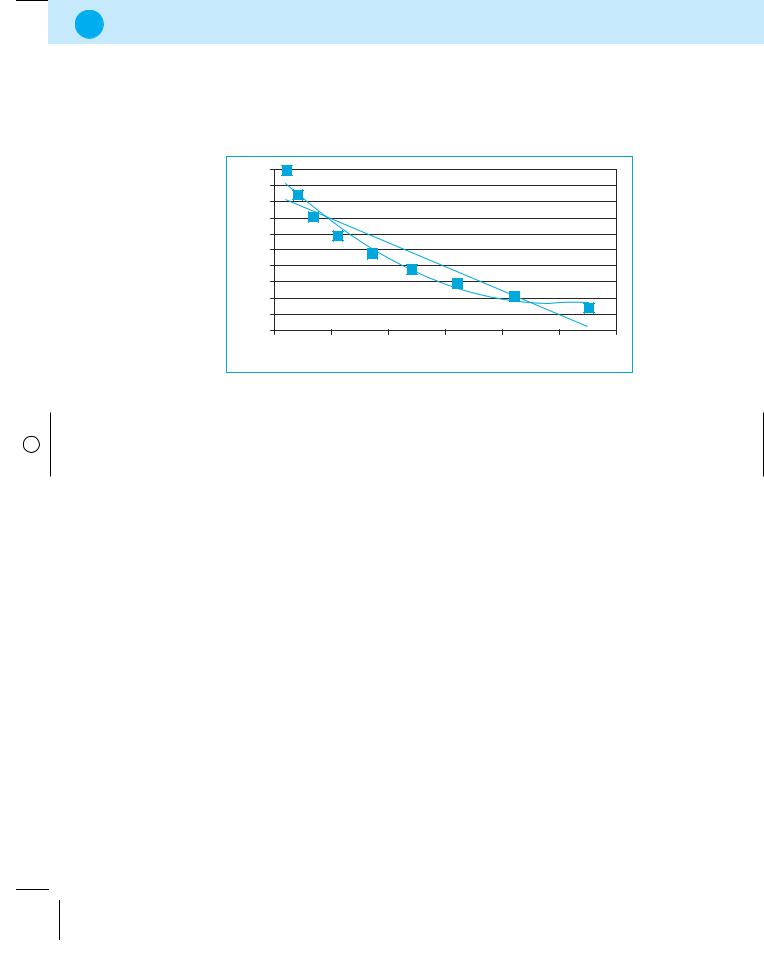
Diagrams provide some indication of whether relationships exist between variables. For example, using data on average household size and electricity consumption indicates if and how both are related. Sample data are shown in Figure 1.2 and were taken from Statistics Norway. Such data are known as cross-section data as they provide information on different variables for one point in time (Figure 1.1 also shows cross-section data).
If data on electricity consumption were available over a number of time periods they would be called time-series data. For different household sizes (number of persons in the household) we see that smaller households had lower electricity consumption (measured in kilowatts per hour).
Linear relationships apply between many economic variables. In practice relationships are approximately linear as shown by the trend line added to the data points in Figure 1.2. The trend line approximately describes the relationship since only one data point actually sits on the line (a standard spreadsheet package was used to construct the line). For any linear relationship if the causal variable (X) changes it always brings about the same or constant effect on the variable it affects. Usually in mathematics, the causal or independent variable is put on the horizontal or X-axis while the dependent variable is on the Y-axis.
To draw a line we need:
1.The value of the dependent variable irrespective of the value of the causal or independent variable. This is called the intercept of the line.

T H E E C O N O M I C S Y S T E M |
13 |
2.A measure of how one variable reacts to changes in the causal variable. This is called the slope of the line.
A standard general expression for a line is presented and explained in the text box.
General expression for a line: Y = c + mX where
•Y denotes one variable, e.g. electricity consumption;
•c denotes the intercept, i.e. the value of Y irrespective of the value of X;
•m denotes the extent to which Y changes as X changes, i.e. how electricity consumption varies with household size;
•X denotes the variable causing changes to Y, e.g. household size.
The specific line described in Figure 1.1 is Y = 10759 + 3220.5X
Electricity consumption is 10 759 kWh irrespective of household size and increases by 3220.5 with each additional one-person increase in household size.
From this relationship it is possible to predict what electricity consumption would be if household size were seven (ceteris paribus!).
Y = 10759 + 3220.5 × 7 = 10759 + 22543.5 = 33302.5
Figure 1.2 is an example of a positive relationship because both variables move in the same direction and it is reflected in an upward sloping line. For negative relationships Y would fall if X rises, and rise if X falls, for example the relationship between the quantity of hours of sunshine per day and the quantity of umbrellas purchased.
Not all economic relationships are linear. For example, the price you pay for apples might be lower if buying in bulk from a grower. The more bought, the lower the unit price the grower quotes – why might a grower behave in this way? The reaction of quantity bought to changes in price may not be in constant proportion so that for each extra 10% decline in the price the quantity purchased increases at an increasing rate as shown in Figure 1.3.
Here, the 10% drop in price from 30p to 27p increases purchases by 10 apples while the 10% drop from 15.94p (to 14.35p) increases purchases by an extra 40 apples. Why might a buyer behave in this way?
Although mathematicians usually place the causal (independent) variable on the horizontal axis, economists by convention place quantity purchased on this axis. This goes back to Alfred Marshall’s treatment of price as the dependent variable
14 |
T H E E C O N O M I C S Y S T E M |
Price |
30.00 |
27.00 |
24.30 |
21.87 |
19.68 |
17.71 |
15.94 |
14.35 |
12.91 |
|
|
|
|
|
|
|
|
|
|
Quantity |
10 |
20 |
35 |
55 |
85 |
120 |
160 |
210 |
275 |
|
|
|
|
|
|
|
|
|
|
|
30 |
|
|
|
|
|
|
|
28 |
|
|
|
|
|
|
|
26 |
|
|
|
|
|
|
|
24 |
|
|
|
|
|
|
Price |
22 |
|
|
|
|
|
|
20 |
|
|
|
|
|
|
|
18 |
|
|
|
|
|
|
|
|
|
|
|
|
|
|
|
|
16 |
|
|
|
|
|
|
|
14 |
|
|
|
|
|
|
|
12 |
|
|
|
|
|
|
|
10 |
|
|
|
|
|
|
|
0 |
50 |
100 |
150 |
200 |
250 |
300 |
Quantity purchased
F I G U R E 1 . 3 Q U A N T I T Y P U R C H A S E D A N D P R I C E
and although most economists agree that price is the independent variable, and quantity purchased depends on price, they follow this convention. Alfred Marshall (1842–1924) was Professor of Political Economy at the University of Cambridge from 1885 to 1908. He founded the Cambridge School of Economics and taught renowned economists including Pigou and Keynes. Marshall’s great work was
Principles of Economics (1890), published in eight editions in his lifetime and considered the ‘Bible’ of British economics, introducing and explaining concepts still conventionally used.
A trend line has been added to Figure 1.3 to indicate how it would approximate the nonlinear relationship. The curved (nonlinear) trend is also included to show how it better describes the general pattern of the data.
Further nonlinear relationships are observed between economic variables and will be met and considered later on in the text.
1 . 5 M I C R O E C O N O M I C S
A N D M A C R O E C O N O M I C S
A distinction is made in most economics textbooks between the areas of microeconomics and macroeconomics.

T H E E C O N O M I C S Y S T E M |
15 |
Microeconomics: study of the causes and effects of the behaviour of individual economic units within the economic system (or groups with broadly similar interests and goals) such as consumers, producers, trades unions, firms and their impact on the markets in which they interact – e.g. the car, apple or labour markets.
Consumer theory assumes consumers wish to maximize their benefit or utility. The theory of the firm assumes producers wish to maximize profits.
Many microeconomic decisions are based on prices, such as consumers’ buying more apples if price falls, more people trying to work in the IT sector if wages (the price of labour) rises and so on. Hence microeconomics is also referred to as price theory. In considering economic units economists attempt to model and understand how the unit or related group of people behaves. Economic units are assumed to behave rationally, in the sense that they try to achieve the greatest amount of benefit, or utility, from their actions. With the assumption of rational behaviour the consideration of constraints on choices can be modelled in an attempt to estimate an optimal or most efficient outcome. For example, in attempting to increase utility by buying something I value, I am constrained by my income. I will try to maximize the utility I get from consumption, given my limited income. Many microeconomic issues are dealt with according to this ‘optimal solution’ method using the supply and demand model.
Once an analysis of individuals and units can be undertaken, it is possible to consider how all economic choices fit together and we can move to an analysis of economic aggregates such as aggregate production – not just of apples but of all goods and services. It is not always possible or feasible to consider the impact of an economic event across each of the individual units or markets that it may affect. Macroeconomic analysis is useful instead.
Macroeconomics is the study of:
•The relationships between aggregate or combined elements in the economic system such as national production and employment, for example.
•Causes of changes in aggregate economic performance including economic structure and economic institutions.
A model of the macroeconomy based on consumer, producer and government action is presented in Chapter 5.
National exchange rates reflect the price of one country’s currency in terms of other currencies, and inflation rates indicate how average national prices

16 |
T H E E C O N O M I C S Y S T E M |
change over time and these are also examined as macroeconomic issues that affect economies. Furthermore, from a government’s perspective macroeconomic policies constitute a key element in their attempts to maximize the performance of their economies to achieve policy goals such as high employment and rising incomes and living standards for their citizens. Hence, macroeconomics also focuses on the impact of government policies on output, employment, inflation or exchange rates.
Although there has been a traditional division of economics into microand macroeconomics, an understanding of economics requires the appreciation that they are not independent of each other. Individuals’ decisions feed into demand and supply in different markets. Aggregate or overall economic activity is clearly dependent on what happens in different markets, which is based on the choices and behaviour of individuals, firms and economic units regarding what buyers wish to buy and what producers wish to sell, for example.
A key focus of this text is on highlighting the relationships between microeconomic and macroeconomic analysis in a way that contributes to a better understanding of their intrinsic relationships and to a better appreciation of how the economic system works.
Hence, elements of both microeconomics and macroeconomics that provide useful frameworks for considering related issues are provided throughout the book.
1.5.1THE ENVIRONMENT FOR ECONOMIC DECISIONS
Rules and laws also impinge on economic choices as rational people react to incentives with which they are faced. For example, interactions between consumers and firms are not independent of such rules because of the regulatory environment that exists, i.e. the rules and regulations, including laws, set down by governments in both national and international contexts which describe how citizens and businesses should operate.
Trade agreements are established by the international organization called the World Trade Organization (WTO) (see www.wto.org). Following prolonged discussions between government officials, the agreements are signed by governments. Firms in signatory countries must abide by the set rules and regulations or face penalties.

T H E E C O N O M I C S Y S T E M |
17 |
Various governments have appointed regulators of competition in attempts to promote greater competition in economies by tackling anti-competitive practices, and so contributing to an improvement in economic welfare. (Alternative market structures and their implications for competition, among other issues, are examined in Chapter 6.) Such practices might include firms:
•agreeing to ‘fix’ prices – not allowing prices to be determined freely in the economic system by demand and supply;
•limiting output to create artificial scarcity and keep prices high;
•dividing business between them or abusing their market position with no benefits to consumers.
Recently the issue of corporate governance has made the headlines because a number of big companies (e.g. Enron, WorldCom, Parmalat) have revealed poor and/or illegal methods of administration or accounting that resulted in a reduction of confidence in their financial reporting procedures, hence their reported earnings and most importantly their future performance. This impacts on people’s willingness to invest in companies and may weaken their confidence in the ability of the economic system to operate efficiently or fairly.
Confidence and expectations can play an extremely important role in economic success – many surveys and ‘barometers’ of consumer confidence are reported and are considered to be key leading indicators of future economic performance. For one example, check out http://www.conference-board.org/economics/consumer- confidence/index.cfm. Why is consumer confidence so important? If consumers are not confident about the future, if they are fearful for their jobs they may prefer not to make purchases of goods and services in the immediate future, opting to save their money rather than spending it on consumer goods.
Consumer confidence: the degree of optimism that consumers express (in surveys, for example) about the state of their economy through their saving and spending patterns.
A worker who thinks their job may be cut will probably put off upgrading their car until such time as they feel more secure about their prospects. If consumers are not in the ‘mood’ to buy, firms cannot sell as much of their output as they expected and so production might fall, leading to lay-offs and in worst-case scenarios slow economic growth (or even negative growth) for a period of time.
Appreciating the role played by each of the different components of the economic system and how interactions between the components all impact on the outcomes

18 |
T H E E C O N O M I C S Y S T E M |
within the system itself is a key goal that guides this book. A good student manages to understand the workings of the components within the economic system. An excellent student manages to appreciate the broader picture of the system with all its complexity of networks, interrelationships and organization. This requires an ability to understand economic models and their role in supporting analysis of economic issues plus an appreciation of their usefulness when we attempt to understand economic phenomena at a particular point in time, within their specific, and often complicated, context.
1 . 6 R E S O U R C E S C A R C I T Y A N D P R I C E S I N T H E E C O N O M I C S Y S T E M
A key issue that motivates the study of economics is how to resolve the discrepancy between scarce resources and the numerous potential uses for them (and how this is actually ordered and organized via the economic system). Resources are clearly scarce in the sense that we, the world’s citizens, cannot fulfil all our economic desires, given our share of available resources. This arises to an extent because of difficult-to-defend policies on the distribution of income in some economies (which is discussed in Chapter 9). It arises also since some resources are finite – such as oil, gas, etc. – although new inventions and innovations allow new products to be developed constantly thus pushing out the boundaries we see for many resources (as Julian Simon explains in his article at http://www.cato.org/dailys/3-04-97.html). We make choices based on preferences regarding how and when we use our available resources to satisfy not simply our needs but our desires, and more generally throughout the economic system, choices are made based on subjective desires of individuals, companies and governments.
Choice inevitably involves precluding alternatives. Using resources in a particular way means those resources are unavailable for simultaneous use in another way since an opportunity cost is incurred. If I use all income on food I cannot buy clothes, or if I establish a manufacturing plant for tables it is not suitable for making chemicals.
Opportunity cost: This is the cost of what is given up in following one course of action such that other choices are no longer possible. It is subjective and can be estimated in terms of the cost of the next-best preferred alternative but only when the choice made cannot be reversed.
It is via the economic system that decisions about how resources are used are made by the many buyers and sellers in markets. While we can view the economy as a system,
T H E E C O N O M I C S Y S T E M |
19 |
the economic decisions made within that system are based on human behaviour and preferences. At the heart of economic decision-making is the necessity to select between alternatives. In making a choice, decision-makers should be aware of the costs of their actions in terms of what they cannot do once they make one particular choice, i.e. the opportunity cost of their decision to ensure the best – most efficient – use of scarce resources.
Consumers decide what to buy with their available income, and how much should be saved rather than spent, based on available information. For example, consumers’ decisions about what to buy depend on the prices and availability of various products, their personal tastes, needs and available income (in no specific order). Employment choices depend on the jobs that are available, on individuals’ qualifications and abilities and the wage rate. Firms also make economic decisions as they attempt to produce and sell their products or services (at prices that consumers are willing to pay) basing their decisions on perceptions of what is happening in their market, which is affected by consumers’ demands, the available production technologies, the firm’s know-how, and how competing firms behave. A firm’s choices are, therefore, bound up in the network of decisions that result in what potential buyers want and what other firms are doing to compete.
Decision-making by individuals and firms is facilitated by the prices they observe in most markets. This means that prices play a central role by signalling information to consumers regarding how best they should use their available resources (including monetary, entrepreneurial, land and labour resources). Prices also act as a signal to producers of the price they can expect to earn for their products which will lead them to make particular decisions about what inputs to use (employees, machines, computers, etc.) how much they can afford to pay for inputs and so on. Hence, the price mechanism provides a means for coordinating the goals and choices of the various decision-makers in a market-based economic system.
Interestingly, from an objective point of view, not all economic outcomes might be considered to enhance the overall well-being of society. Take for instance the fashions that lead to rising expenditure on mobile phones and their accessories that might, arguably, be better spent on improving education or health. Instead of allowing the market system to organize the use of resources and what is produced based on the price mechanism and individuals’ and companies’ responses to prices, it would be possible to consider handing over total control for such choices to an ultimate decision-maker who ‘knows best’. But this would not necessarily lead to a better overall outcome. Economists

20 |
T H E E C O N O M I C S Y S T E M |
consider that it is through the dispersed decision-making by individuals and organizations in the economic system that the best use of dispersed economic knowledge regarding demands, supplies and markets is facilitated which allows prices to act as signals to all participants in the system. This highlights one issue at the heart of economic debate – the costs and benefits of centralized versus dispersed decision-making.
Economists argue that centralized decision-making about how resources should be used and what products should be produced leads to inefficient resource use where surpluses of some goods and shortages of others would be created (as in many former centrally planned economies). Furthermore, such systems take away individuals’ freedom of choice. In fact, the dependence of a substantial proportion of our market-based economic system on the price mechanism actually means that individuals’ choices are affected by the choices and decisions of other members of the system. This happens because the sum total of all individual choices (by producers on the supply side of the economy and buyers on the demand side) feed into the economic system to generate the market prices we observe (analysed in detail in Chapter 2). Hence, subsequent decisions by buyers and sellers are disciplined and organized by the price mechanism. This is what Adam Smith alluded to in his discussion of the invisible hand that guides the economy – a guiding mechanism that is no one individual’s responsibility, desire or goal, but is the outcome of myriad decisions taken by buyers and sellers.
In the decisions made by governments, opportunity costs also apply to choices taken regarding how to use resources, e.g. how to divide up spending between building hospitals or schools or to build roads; choice between competing alternatives must be made. Clearly, however, political decisions relate not only to how best to use available resources but also to preferences made by governments and ministers with the knowledge that decisions may impact on their future election prospects. Thus, political economy concerns introduce additional complexity into the economic system.
1.6.1USING RESOURCES AND CENTRALIZED DECISION-MAKING
In the case of centrally planned (or command) economies, it is possible to examine how resources were centrally controlled and allocated, guided by a ‘visible hand’ of the central planner that focused mostly on the supply side of the economy and the organization of production.

T H E E C O N O M I C S Y S T E M |
21 |
The prevailing economic system in such economies was not based on markets driven by prices to guide decision-making. The price mechanism was not influenced by consumers’ competing demands for various goods as prices were set by central government. Neither were prices used as signals to where profitable opportunities lay for entrepreneurs and where they should best direct their resources. In most cases private property was not prevalent. Hence, free markets did not underpin how the economy was organized.
A further implication of command economies is in terms of innovation incentives. Innovation plays an important role in improving the processes used and the types and quality of goods produced within firms and industries that feed into improving national labour productivity and living standards.
Labour productivity: the average output of a citizen. It is generally measured as the value of a country’s production per worker, e.g. UK national output divided by the employed workforce of the UK for a particular period of time.
Yet in economies where goods are provided based on central planning, and resources are largely centrally owned, individuals do not enjoy rights to own private property and hence lack the incentives of their counterparts in ‘market economies’ to be as innovative or enterprising. The self-interested (not selfish!) desire to improve individual well-being that translates into broader benefits for the larger community (via creating employment or better technology) is more difficult to operationalize in a society where property and resources are owned centrally because individuals see fewer of the direct benefits.
It is true, however, that the world’s economic system does not rely solely on the market system and price mechanism to provide all goods and services. A considerable portion of economic activity involves public provision of some goods and services where government ministers (and civil servants) are responsible for allocating resources to meet targets for street lighting, flood controls or defence, which are known as public goods. A public good is not provided by a private citizen or private company but by the government.
Public goods: goods that would not be provided in a free-market system. They are goods that
•if consumed by one person can still be consumed by others; non-rival in consumption. Private goods once consumed are not available to others.
•if provided, cannot be excluded from the consumption of anyone who desires the good, even if they do not wish to pay for it. Public goods are non-excludable in consumption.

22 |
T H E E C O N O M I C S Y S T E M |
The benefits of a public good are available to all citizens who consume it and those benefits cannot be withheld from any individual in the economy. Governments supply public goods because of the free-rider problem.
The free-rider problem exists due to the non-rival and non-excludable nature of public goods. There is no incentive to supply or pay privately for goods with public-good characteristics. Such goods, if desired, are provided by governments and paid for collectively through taxes.
The free-rider problem is one example of market failure, a reason why the market requires government intervention to change what would otherwise be produced.
Some economies, such as the French and Swedish, display greater public provision based on national preferences than other economies such as the US or Japanese.
Some goods have some public characteristics such as rail and road networks. Both networks are not fully non-rival since a completely full train does not permit further consumption. Toll costs and ticket prices are methods of excluding some potential consumers so the condition of non-excludability is not necessarily met either. However, it would be difficult to envisage either network being fully privately supplied, and collective preference and choice means they are publicly provided, for the most part.
The price mechanism has traditionally played a less important role in governments’ decisions about how government-controlled resources should be allocated between competing uses.
Governments internationally are increasingly examining both the provision of public (and other) goods and services and the processes by which they are provided in order to adopt more efficient provision. Indeed, the issue of the extent to which governments should provide goods is debated in many countries – consider the complexity of the UK government’s U-turn on owning and running the rail system, where they initially organized and ran the rail transportation system then privatized it only to take over its running once again.
1 . 7 R E S O U R C E U S E , O P P O R T U N I T Y C O S T S A N D E F F I C I E N C Y
The concept of opportunity cost is a powerful and useful concept for considering how scarce resources are used in an economy and it can be considered

T H E E C O N O M I C S Y S T E M |
23 |
Films |
a |
|
b |
c |
|
|
|
|
8 |
|
|
|
d |
|
|
|
|
|
|
|
|
|
|
|
|
|
6 |
|
|
|
|
|
e |
|
|
4 |
|
|
|
|
|
|
f |
|
|
|
|
|
|
|
|
|
|
2 |
|
|
|
|
|
|
|
g |
|
|
|
|
|
|
|
|
|
|
0 |
1 |
2 |
3 |
4 |
5 |
6 |
Food |
|
Food |
Films |
a |
0 |
8.00 |
b |
1 |
7.80 |
c |
2 |
7.50 |
d |
3 |
7.00 |
e |
4 |
6.00 |
f |
5 |
4.75 |
g |
6 |
0 |
F I G U R E 1 . 4 P R O D U C T I O N P O S S I B I L I T Y F R O N T I E R : E F F I C I E N C Y , S C A R C I T Y A N D O P P O R T U N I T Y C O S T
using a production possibility frontier (PPF) shown in Figure 1.4. The main productive resources or factors of production in an economy are land, labour, entrepreneurship and capital. Land and labour resources contribute to production and their quantities and qualities vary across economies. Entrepreneurship refers to the organization, management and assumption of risks of a business or enterprise and often implies an element of change or challenge and a new opportunity to exploit in a market. Sometimes entrepreneurship is successful, sometimes not. While it is possible to measure and compare the land and labour resources to some extent across economies, entrepreneurship is more difficult to measure. It may be reflected in estimates of the number of new companies established, new products launched, or the development or adoption of new technologies in an economy but is a complex concept which serves to explain some of the reasons why some economies perform better than others.
Capital goods are not used for consumption. Capital includes the factories that produce saleable output, apple trees grown to produce apples sold in the apple market, the machinery in factories or the computers in offices used to produce further products and services (but not those home computers used for leisure rather than productive purposes!). Inventories held by shops and factories are also classified as capital goods and only become consumption goods when households buy the goods for consumption purposes – the function served by the goods implies whether they can be classified as capital or consumption. Furthermore, when people engage in education, training or any activity that increases their personal productivity (how much they can produce with the factors of production at their disposal), they increase their human capital that can also contribute to producing further goods and services.

24 |
T H E E C O N O M I C S Y S T E M |
Human capital includes all the skills, knowledge and expertise that people accumulate over time that allow them to increase their productive capacity as individuals, members of firms and within society more broadly.
The production possibility frontier is a model useful for considering the maximum feasible combinations of goods an economy can produce. The differences between efficient and inefficient production can be considered via the PPF. The PPF is not an attempt to describe the complexity of decisions that feed into national production, instead just two products are considered, but the points illustrated by the model reveal its appropriateness for its purpose.
Figure 1.4 presents a PPF showing all possible outputs of food and films that could be produced by an economy. Production at points lying on the PPF indicate efficient production.
Efficient production: all available resources are used to produce a maximum combination of goods/services with no resources unemployed. Resources are used in their most productive way, in Figure 1.4 in either food or film production.
An example of inefficient production would be if 4 films and 4 food were produced since this point lies inside the PPF and would leave some resources unemployed in the economy. Any points outside (north-east) of the PPF cannot be produced given the economy’s scarce resources.
Of all the possible output combinations that could be produced, the actual output choice will depend not only on production possibilities of the economy (what the economy can supply) but also on the demand that exists for films and food. If the economy’s citizens prefer more films than food output might occur at a point such as b. Where production takes place matters from the citizens’ perspective because they will be better off if resources are not left unemployed but are fully used to meet their needs and demands.
The concept of opportunity cost can also be illustrated using the PPF. Specifically, the opportunity costs associated with changing the output combination in the economy can be analysed. At Figure 1.4 point a output of 8 films and 0 food is a feasible output combination: a unit of food can be thought of as a basket of various food items. At point b 7.8 films are produced as well as 1 unit of food and at c 7.5 films and 2 food are produced. The opportunity cost of food in terms of films can be calculated based on the example. In changing output of the economy from a to b, less films but more food can be produced as some resources are switched from films to food

T H E E C O N O M I C S Y S T E M |
25 |
production. Film production drops by 0.2 film (from 8 to 7.8) while food production increases by 1 (from 0 at point a). Therefore, the opportunity cost of switching from point a to b is the amount of films that can no longer be made, hence the opportunity cost of films in terms of food is 0.2 films ‘lost’ for 1 unit of food ‘gained’.
If production changed from b to c, film production would decline further from 7.8 to 7.5 films while food production would increase from 1 to 2 units. Here, the opportunity cost is the decline of 0.3 of a film for a 1 unit increase in food.
The reduction in film production releases sufficient resources to allow food production to increase by 1 unit. A further decline in film production by 1 unit would move output from point c to d, allowing an additional unit of food to be produced. Hence, the opportunity cost changes over the range of the PPF: when no food is initially produced (Figure 1.4 point a) switching some resources best suited to food production out of film production allows more food to be produced than if the economy was already using a lot of its resources to produce food and wanted to produce more (points b or c or d). As more food is produced, the amount of films that must be ‘sacrificed’ to produce each additional unit of food increases. Therefore, the opportunity cost of films in terms of food increases as more food is produced (moving from a towards d). The same analysis can be conducted for the opportunity cost of food in terms of films beginning at point e where only food is produced and moving back to points d, c, b and a. Again, the opportunity cost of food in terms of films increases as more films are produced in the economy.
Increasing opportunity costs of production that underlie the curved shape of the PPF occur since not all of an economy’s resources are equally suited to the production of different goods. Rational producers use the resources most suitable to their output, where possible.
Another way of thinking about this change in opportunity cost is to consider the marginal cost of producing goods.
Marginal cost is the opportunity cost of producing one additional unit of a good.
The marginal cost is different depending on how much of a good is already produced. Initially, resources least suited to producing films would be transferred to produce food, but as more and more food is produced, the resources transferred from films to food will be less and less productive in producing food. Hence, as

26 |
T H E E C O N O M I C S Y S T E M |
A Opportunity cost of food |
B Marginal cost of food |
Films |
a |
|
b |
c |
|
|
|
|
MC (films per food) |
|
|
|
|
|||
8 |
|
|
|
d |
|
|
|
5 |
|
|
|
|
|
4.75 |
|
|
|
|
|
|
e |
|
|
|
|
|
|
|
|
||||
6 |
|
|
|
|
|
|
|
4 |
|
|
|
|
|
|
|
|
|
|
|
|
|
|
f |
|
|
|
|
|
|
|
|
||
|
|
|
|
|
|
|
3 |
|
|
|
|
|
|
|
||
|
|
|
|
|
|
|
|
|
|
|
|
|
|
|
||
|
|
|
|
|
|
|
|
|
|
|
|
|
|
|
|
|
4 |
|
|
|
|
|
|
|
|
2 |
|
|
0.5 |
1 |
1.25 |
|
|
|
|
|
|
|
|
|
|
|
1 |
|
0.3 |
|
|
|
||
2 |
|
|
|
|
|
|
|
g |
0.2 |
|
|
|
|
|||
|
|
|
|
|
|
|
|
0 |
|
|
|
|
|
|
|
|
|
|
|
|
|
|
|
|
|
|
|
|
|
|
|
Food |
|
|
0 |
1 |
2 |
3 |
4 |
5 |
6 |
|
Food |
1 |
2 |
3 |
4 |
5 |
6 |
|
F I G U R E 1 . 5 M A R G I N A L C O S T
A N D O P P O R T U N I T Y C O S T
additional units of food are produced, the marginal cost of producing each extra unit (measured in terms of films) increases, because more films must be ‘sacrificed’ to release sufficient resources to make additional food. Rising marginal cost is shown in Figure 1.5.
If all resources are devoted to film production (a panel A), no food and 8 films are produced. If 1 unit of food is produced – moving from point a to point b – the output of films falls by 0.2. This provides a measure of the opportunity cost of this first unit of food (shown in panel B). Moving production from b to c involves a further increase in food production of 1 unit and a decline in film production of 0.3; producing the second unit of food requires a greater reduction in film production than the first unit. The marginal cost of each additional unit of food production is computed as 0.5, 1, 1.25 and 4.75 units of films.
Two further economic concepts are illustrated using the PPF. Points on the PPF represent static efficiency where each point reflects one state of efficiency for the economy – moving from any point on the frontier to any other point means that the economy uses its resources at their maximum efficiency albeit to produce a different combination of goods. Over a short time period it is possible that an economy faces limits to its productive capacity because resources do not usually increase significantly over short periods (unless there’s an oil strike or gas is found, for example). However, over longer time periods it is possible that an economy’s productive capacity increases.
Dynamic efficiency (economic growth): the outward expansion of the PPF.
Economic growth or dynamic efficiency would be possible with:
•Increased quantity of labour : if more people were available for work and could find employment so more output could be produced.

T H E E C O N O M I C S Y S T E M |
27 |
•Improved quality of labour : if people’s skills and education improved sufficiently for them to be more productive – i.e. get more out of the resources they use.
•Improved technology: due to domestic or imported innovations technical progress occurs where more output could be produced from available resources.
•Ease of start-ups: if new businesses can easily be set up by entrepreneurs new products can be introduced to markets (or old products provided in new ways).
•Increased capital resources: if firms’ investment in new capital grows, workers have more capital to work with and could produce more output.
Importantly, however, growth would only occur if demand for the additional output also existed so firms could sell their extra production (the issue of economic growth is addressed explicitly in Chapter 9).
Substantial challenges exist for economies regarding how to move closer to static efficiency and encourage dynamic efficiency. Economies do not necessarily produce to the maximum of their productive capacity – some labour may be unemployed, machines and factories may be idle, entrepreneurs may not wish to engage in risky ventures – so actual output might lie inside an economy’s potential production possibilities. The trick is to strike the right balance to maximize potential possibilities and actual output, while also taking account of environmental and any other social costs.
It is worth noting that the PPF is not an attempt to describe reality but a model to help think about issues of interest to economists. Economists consider that most economic activity should be left to a market-based economic system for an economy to achieve an efficient state rather than via central planning. However, economists differ regarding the role they consider governments should play in the economic system and the quantity of public goods that should be provided.
1 . 8 A L L I A N C E O F E C O N O M I C P E R S P E C T I V E S
There is a tradition in economics that emphasizes the need for government or government agencies to oversee the activities of the business community in order to protect consumers from being deceived or exploited by firms – to protect what is referred to as the ‘public interest’. Using economic theories and concepts to make such arguments could be called a public policy perspective and holders of this view often consider that governments should enact policies that ‘police’ the business sector and regulate the economy to ensure consumers are shielded from

28 |
T H E E C O N O M I C S Y S T E M |
any negative or undesirable effects of business activities. Government regulation might take the form of competition policy and it may try to ensure that the rights of consumers are protected.
This perspective acknowledges the role that governments can play in economic life. The actions of government can influence an economy in many ways, not only through the regulation function, and have an impact on the general performance of the economy and its competitiveness over time.
Competitiveness: a range of factors from measures of income and prosperity to economic creativity and innovative ability that describe the performance of one economy relative to others.
The purpose of examining economic competitiveness is to get closer to understanding the process by which countries and economies (local or regional) can enjoy rising living standards. Policies relating to taxation, government spending, labour, education, business creation, technology, environmental protection and many other areas have direct and indirect effects on the ability of an economy to generate income to support its citizens over time and allow them to enjoy rising living standards.
Viewing the business sector with mistrust or suspicion, however, ignores the critical role played by companies in generating wealth and employment and in leading and facilitating economic development. Businesses clearly play an active and contributory role in competition and the market process in economies; hence, the need to understand the economic system from a ‘business’ perspective also. Applying economic theories and concepts to the business environment increases understanding of the role played by business firms in improving competitiveness and generating rising living standards in economies on a sustainable basis.
In fact, an appreciation of both perspectives by economists is essential in order to understand the complex interplay that goes on between businesses and government sectors and how they both affect the outcomes in any economy. For example, economic efficiency as presented in the production possibility frontier model clearly depends on what decisions are made by firms (e.g. what to produce) and the environment in which firms operate which, in turn, is affected by the policies followed by government.
Participants in an economy need to be aware that both business and government sectors have a contributory role to play in developing the factors that allow economies to achieve their potential and raise the living standards for their
T H E E C O N O M I C S Y S T E M |
29 |
citizens. This means that all participants need to work towards developing processes within the economic system so that citizens/clients receive high standards of goods and services from private businesses, public organizations and bodies and public representatives. This could mean that ethics and standards should be set and followed by both policy-makers and business people and that the actions of individuals, organizations and public representatives are transparent and open to scrutiny and that accountability for actions is enshrined. This would mean that citizens could have trust in their economic and political systems. These are admirable goals but they are certainly not always met in practice.
1 . 9 P O S I T I V E / N O R M A T I V E E C O N O M I C S
Economic analysis based on objective facts is called positive economics.
Various reasons behind strong growth in the Irish economy have been proposed including a young well-educated English-speaking workforce, sound management of the government finances, moderate wage increases, and attracting investment by multinational companies. Although it is difficult to distinguish which factor is most important, economists generally agree that each of these reasons provides part of the explanation, offering analysis based on positive economics that attempts to get at how the economic system works.
When economists make judgements about what should occur – making statements such as education spending should increase, government spending should be reduced – they move from objective analysis of facts to a more subjective analysis based on personal beliefs, values, norms or political persuasion. Such analysis is known as normative economics.
The distinction between positive and normative economics matters because economists often differ regarding opinions on what should be done because of their personal opinions, which are based on factors including their education, background, culture, etc. Decision-makers in companies, government organizations and elsewhere, who rely on economists for advice, need to know the basis and reasoning underlying the advocation of a particular opinion or policy and sound objective analysis is a more reliable basis for selecting a policy than one based solely on personal beliefs.

30 |
T H E E C O N O M I C S Y S T E M |
This does not mean that normative issues are ignored by the economics discipline. Such topics are studied in welfare economics. The focus of this stream of study is on assessing:
•how efficiently resources are used;
•the fairness of how the economic system functions from the perspective of various stakeholders.
Efficiency can be examined adopting a positive economics approach based on objective analysis. The fairness issue, however, is rather more problematic and one on which people hold alternative normative positions.
1 . 1 0 S U M M A R Y
•The economic system is a web of interactions between individuals, economic units and institutions that determine how resources are best used to satisfy competing demands.
•Choices about how resources are used, which goods are produced and in what quantities, are made via the economic system.
•Choices are made dependent on what is demanded and the factors of production and technology available, supported by the operation of markets where prices provide information on how best resources may be used. Political considerations also feed into the economic decisions as laws and regulations govern the activities and behaviour of the stakeholders within economies.
•Studying economics is useful for understanding and improving how the best economic choices possible are made based on individual and/or organizational preferences and the available usually limited resources.
•An economics approach follows a logical method of analysis based on assessing, and sometimes estimating, causal relationships.
•The participants and features of the economic system are further discussed in the chapters that follow. Both macroeconomic and microeconomic concepts, principles and models are used to explain how the features interrelate within the economic system.

|
|
|
|
|
|
T H E E C O N O M I C S Y S T E M |
31 |
C H A P T E R 1 A P P E N D I X |
|
|
|
||||
50 000 |
|
|
|
|
|
|
|
45 000 |
|
|
|
|
|
|
|
40 000 |
|
|
|
|
|
|
|
35 000 |
|
|
|
|
|
|
|
30 000 |
|
|
|
|
|
|
|
25 000 |
|
|
|
|
|
|
|
20 000 |
|
|
|
|
|
|
|
15 000 |
|
|
|
|
|
|
|
10 000 |
|
|
|
|
|
|
|
5000 |
|
|
|
|
|
|
|
0 |
AUS |
NLD |
BELAUTSWEGERFRAGBR |
NZL |
PRTSVNGRCCZESVKHUNESTPOLHRVZAFLTUTURBGRCHN |
|
|
LUXUSANORCANHKGDNKCHE |
|
||||||
|
IRL |
JPN |
FIN |
ITA ESP ISR |
IND |
|
|
F I G U R E A . 1 L I V I N G S T A N D A R D S , $ , 2 0 0 2 |
|
||||||
Source: Excerpted from the Penn World Table 6.1 (Heston et al., 2002).
Note: The Penn World Table is a great source of comparable data on 168 countries going back to 1950 in many cases. To see the range of information presented in the tables visit http://pwt.econ.upenn.edu/
R E V I E W P R O B L E M S A N D Q U E S T I O N S
1.How would you define the economic system? Describe the role played by each of the following in the economic system: individuals, firms, countries.
2.What role is played by theory in economics? Does this mean we already as good as know the answer to a question before we begin analysis?
3.What differentiates microeconomics from macroeconomics?
4.What are the main differences between market-based and centrally planned economies? Refer to the principle of exchange, the existence of markets and the role of prices in your answer.
5.What is the relationship between resource scarcity and prices in economics? Refer to the signalling function of prices in your answer.
6.Draw a production possibility frontier for two goods, housing and entertainment. The maximum amount of entertainment and shelter that could be produced is 100 and 80 units respectively.
a. Based on your drawing, what is the opportunity cost of producing 20 units
of entertainment? 40 units? 80 units?

32 |
T H E E C O N O M I C S Y S T E M |
b.Why does the opportunity cost change for different outputs of entertainment and shelter?
7.Which individuals in the economic system are most likely to have a public policy approach to economics? Which individuals in the economic system are most likely to have a business economics approach to economics? Why? Is it of any importance which perspective people hold?
8.Leaf through some good newspapers. Provide three examples of normative economic statements and three examples of positive statements they contain.
F U R T H E R R E A D I N G A N D R E S E A R C H
•To put some context behind the data provided in Figures 1.1 and A.1 the OECD’s Economic Survey publications provide comprehensive economic assessments of nations and recommendations for their future development. These contain information on some topics that will be new to you as you start out in economics, but by the end of the course should become substantially more comprehensible. The OECD also provides a range of specific articles from its research departments as well as free access to much of its data.
•For daily economics-related features and articles, the Financial Times provides timely national and international information and can be used to answer some of the review questions in this chapter.
•The weekly Economist magazine also presents accessible descriptions and analyses of current and topical national and international issues. Search through past editions and see how long it takes you to find 10 articles that touch on issues discussed in this chapter!
•For those with an interest in finding out more about the European Union and its economy, see El-Agraa, 2001.
R E F E R E N C E S
Djankov, S., R. La Porta, F. Lopez de Silanes and Shleifer, A. (2001) The Regulation of Entry, CEPR Discussion Paper No. 2593.
El-Agraa, A. (ed.) (2001) The European Union, Economics and Policies. 6th edn, Pearson. Heston, A., R. Summers and B. Aten (2002) Penn World Table Version 6.1. Centre for International Comparisons at the University of Pennsylvania (CICUP), October.
OECD, Economic Outlook (2002) Annex Table 24, December (www.oecd.org).

T H E E C O N O M I C S Y S T E M |
33 |
Smith, A. (1970) An Inquiry into the Nature and Causes of the Wealth of Nations. Penguin, Harmondsworth [original publication 1776].
Statistics Norway (2004) ‘Energy statistics: energy consumption per household’, Table 1: Average energy consumption by house type, household size and net income, kWh supply of energy per household, 2001.

C H A P T E R 2
M A R K E T A N A L Y S I S :
D E M A N D A N D S U P P L Y
L E A R N I N G O U T C O M E S
By the end of this chapter you should be able to:
Outline the sources of benefits from exchange that create incentives for economic transactions.
Explain the most important factors influencing demand and supply in the demand and supply model. Use the model to:
•Illustrate how price and quantity bought/sold are determined in any market by the interaction of demand and supply.
•Consider the impact of changes in the influences on demand and supply on price and quantity bought/sold.
Review the role of equilibrium in economic models and theories and comment on alternative perspectives on equilibrium.
Clarify the importance of information for the efficient use of resources.
Apply the supply and demand model to the labour market:
•Explain the underlying features of the demand for labour and the supply of labour.
•Use the model to show how wages and the number of workers are
|
determined in the labour market. |
|
|
2 . 1 I N T R O D U C T I O N
Knowing how markets function is fundamental to understanding the interactions between the various elements in the economic system. Through our desires not to be self-sufficient, we reveal how we need a system that can facilitate organized transactions. The market mechanism of buyers and sellers coming together allows the coordination of economic activities, although no one person or group have control over the free-market outcome; it is the result of all of the decisions made by individual buyers and sellers. Through this mechanism prices emerge and goods are

36 |
T H E E C O N O M I C S Y S T E M |
bought and sold. Understanding how this process proceeds is crucial for economic analysis. In this chapter the market model of demand and supply is presented in sections 2.3 and 2.4 after the logical reasons as to why buyers and sellers exchange have been discussed in section 2.2. Attempts to ‘organize’ prices in markets rather than allowing them to emerge from markets have interesting implications that are examined in section 2.5.
The roles of information and knowledge in the economic system are also considered in this chapter in section 2.6. When we are involved in economic transactions to buy or sell goods we are engaged, to some extent, in the buying or selling of knowledge that we value but do not possess. We buy a computer because most of us do not have the required knowledge to make it ourselves. The logic applied in Chapter 1 to argue that resources should be used most efficiently also applies to how information resources are used. Factors that increase the probability of using knowledge most efficiently are considered.
In section 2.7 the purpose and role of equilibrium in the demand and supply model is examined as alternative views exist, both of which provide arguments as to why the model helps in understanding the operation of economies. Finally, in section 2.8, the main features of the labour market are presented as one example of how the demand and supply framework can be used to consider the behaviour of sellers and buyers in this complex market. This example indicates the appropriateness of the demand and supply framework for understanding the complexity of how markets work.
2 . 2 E X C H A N G E – A C E N T R A L F E A T U R E O F M A R K E T S
Markets are an intrinsic feature of economies, especially developed industrialized economies, and represent an important mechanism for coordinating economic activity. Facilitated by markets, buyers communicate explicitly or implicitly with sellers, and decisions about what transactions to make and when to make them are made. A key principle underlying the existence of markets is that people wish to engage in exchange, each party placing a lower value on what they give up in the exchange compared to what they receive from it. When I buy a can of beans I place greater value on the product than on holding onto the money it costs; the expected benefit derived from the product is balanced against its cost.
The concept of value is widely debated. Although value is entirely subjective the amount consumers are willing to pay for products provides some information

M A R K E T A N A L Y S I S : D E M A N D A N D S U P P L Y |
37 |
regarding the value placed on purchases. The expected benefit derived from a purchase is the incentive to buy in the first place and it can be estimated using the principle of opportunity cost, i.e. what is the value of the next best alternative the consumer gives up in order to make their purchase? Consumers cannot be asked this question by economists for each and every purchase they make but the amount of goods or services they are willing to forego in order to make a purchase is reflected in the money they are willing to give up in the transaction. (This is still problematic though because if I pay 55p for a tin of beans, this reflects the market value of the product and I might have been willing to pay more than this based on my perception of my expected benefit.) The benefits or gains from exchange are related to differences in preferences and in the values sellers and buyers place on goods and services.
Each consumer’s individual preferences feed into their purchasing decisions, their willingness to pay and ultimately their demand for goods and services. The economic concept of demand refers not just to a desire to make purchases, but to those desires that are supported by an ability to pay – I would love to buy a Ferrari Enzo but I do not feature in the economic ‘demand’ for it because I could not effectively purchase the product at its retail price (around £430 000 and 349 models only were manufactured!).
Gains from exchange may also arise due to differences in productivity. An example can be used to illustrate this point. Consider the production possibilities of two regions – North and South – which produce both food and clothing and which have different quantities of available resources. If all North’s resources were devoted to food production then each worker could produce 2 baskets per day and if resources were devoted solely to clothing, 10 outfits could be produced on average. The corresponding productivity figures for South are 10 baskets of food and 2 outfits, shown Table 2.1. These figures for output indicate the opportunity cost (see Chapter 1) of producing one good in terms of another for each region. (For simplicity this example deals with two regions only but additional regions or countries could be added to the analysis and would not change the main conclusions made.)
Table 2.1 indicates that for clothing Northerners are five times as productive as Southerners (10 compared to 2) while Southerners are five times as productive as Northerners in food. If each region specialized and exchanged any surplus production to buy the good in which they are less productive, both regions could be better off than if they tried to be self-sufficient in both goods.
When a product is produced more efficiently (using less resources) in one country, that country has an absolute advantage in that product. It is measured

38 |
T H E E C O N O M I C S Y S T E M |
T A B L E 2 . 1
D A I L Y P R O D U C T I V I T Y O F
F O O D A N D C L O T H I N G I N
N O R T H A N D S O U T H
|
Food (baskets) |
Clothing (outfits) |
|
|
|
North |
2 |
10 |
South |
10 |
2 |
by comparing relative output across countries, e.g. in Table 2.1 South is more productive in food than North.
Economies that are self-sufficient and which produce efficiently can be considered to produce and consume an output combination on their production possibility frontier, but by engaging in trade with another economy, it may be possible to consume more than what is produced in the economy itself. Imagine that North spends half a day producing clothing and the other half producing food so its total output is 1 basket of food and 5 outfits. South could produce 5 baskets of food in half a day and 1 outfit in the other half-day. Their combined output would be 6 baskets of food and 6 outfits.
This combined output is less than what could be produced across the 2 regions with specialization by each region in the good of its absolute advantage. With specialization, combined output increases as North can produce 10 outfits and South 10 baskets of food. Assuming demand for both goods exists in both regions, trade would be required to allow both goods to be consumed in each region.
International trade makes sense when countries have different opportunity costs of production and specialize in the good in which they have a productivity advantage – a lower opportunity cost of production.
Trade and specialization make sense even when one region (South) has no absolute advantage as illustrated in Table 2.2. Here North remains more productive in clothing but the regions are equally productive in food. When each region spends half a day producing both goods, total output is 10 baskets of food and 6 outfits: 5 baskets of food and 5 outfits in the North and 5 baskets of food and 1 outfit in the South. With specialization, North could produce 10 outfits and South 10 baskets of food so specialization still allows greater combined production than self-sufficiency.

M A R K E T A N A L Y S I S : D E M A N D A N D S U P P L Y |
39 |
T A B L E 2 . 2
A L T E R N A T I V E D A I L Y
P R O D U C T I V I T Y I N N O R T H A N D
S O U T H
|
Food (baskets) |
Clothing (outfits) |
|
|
|
North |
10 |
10 |
South |
10 |
2 |
The opportunity costs of production indicate where each region should specialize. The opportunity foregone in the North if only food is produced is 10 outfits per day, i.e. the opportunity cost of each basket is 1 outfit. In the South, the opportunity cost of each basket is one fifth of an outfit (and the opportunity cost of each outfit is 5 baskets of food). The opportunity cost of producing each basket of food is lower in South than North – one fifth of an outfit compared to 1 outfit. Hence, it makes economic sense for South to specialize in producing food, the good in which its opportunity cost of production is lower. Since South’s opportunity cost of clothing is 5 baskets of food, compared to only 1 basket in the North, North should specialize in producing the good in which it has a lower opportunity cost of production – a comparative advantage.
When output is produced at a lower opportunity cost in one country, that country has a comparative advantage in production. It is measured by comparing relative opportunity costs between countries, e.g. in Table 2.2, the opportunity cost of food in South is 0.2 outfits which is lower than the opportunity cost of food in North (1 outfit).
If South’s productivity dropped to 6 food baskets instead of 10, an incentive to trade would still exist. The opportunity cost of production would be unchanged in the North but the opportunity cost of producing each basket of food would still be lower in South – one third of an outfit compared to 1 outfit in the North.
The incentive to trade is present even when one economy is less productive in all goods once opportunity costs of production differ.
Each region benefits if it specializes based on its comparative advantage and trade occurs in surplus production. Once the regions can agree on a price for trading the