

TsOS / DSP_guide_Smith / Ch29
.pdfCHAPTER
Getting Started with DSPs
29
Once you decide that a Digital Signal Processor is right for your application, you need a way to get started. Many manufacturers will sell you a low cost evaluation kit, allowing you to experience their products first-hand. These are a great educational tool; it doesn't matter if you are a novice or a pro, they are the best way to become familiar with a particular DSP. For instance, Analog Devices provides the EZ-KIT® Lite to teach potential customers about its SHARC® family of Digital Signal Processors. For only $179, you receive all the hardware and software you need to see the DSP in action. This includes "canned" programs provided with the kit, as well as applications you can write yourself in assembly or C. Suppose you buy one of these kits from Analog Devices and play with it for a few days. This chapter is an overview of what you can expect to find and learn.
The ADSP-2106x family
In the last chapter we looked at the general operation of the ADSP-2106x "SHARC" family of Digital Signal Processors. Table 29-1 shows the various members of this family. All these devices use the same architecture, but have different amounts of on-chip memory, a key factor in deciding which one to use. Memory access is a common bottleneck in DSP systems. The SHARC DSPs address this by providing an ample supply of on-chip dual-ported SRAM. However, the last thing you want to do is pay for more memory than you need. DSPs often go into cost sensitive products, such as cellular telephones and CD players. In other words, the organization of this family is determined by marketing as well as technology.
The oldest member of this family is the ADSP-21020. This chip contains the core architecture, but does not include on-chip memory or I/O handling. This means it cannot function as a stand-alone computer; it requires external components to be a functional system. The other devices are complete
SHARC, EZ-KIT, EZ-LAB, VisualDSP, EZ-ICE, the SHARC logo, the Analog Devices logo, and the VisualDSP logo are registered trademarks of Analog Devices, Inc.
535
536 |
The Scientist and Engineer's Guide to Digital Signal Processing |
||||
|
PRODUCT |
|
Memory |
|
Notes |
|
|
|
|||
|
|
|
|
|
|
|
AD1460 |
|
|
|
Quad-SHARC, Four ADSP-21060's in the |
|
|
4 Mbit ×4 |
|
same module; provides an incredible 480 |
|
|
|
|
|
MFLOPS in only 2.05"×2.05"×0.16". |
|
|
|
|
|
|
|
|
|
|
|
|
New! Features Single Instruction Multiple |
|
ADSP-21160M |
|
4 Mbit |
|
Data (SIMD) core architecture; optimized |
|
|
|
|
|
for multiprocessing with link ports, 64 bit |
|
|
|
|
|
external bus, and 14 channels of DMA |
|
ADSP-21060 |
|
4 Mbit |
|
Power house of the family; most memory; |
|
|
|
link ports for high speed data transfer and |
||
|
|
|
|
|
multi-processing |
|
ADSP-21062 |
|
2 Mbit |
|
Same features as the ADSP-21060, but with |
|
|
|
less internal memory (SRAM), for lower |
||
|
|
|
|
|
cost |
|
ADSP-21061 |
|
1 Mbit |
|
Low cost version used in the EZ-KIT Lite; |
|
|
|
less memory & no link ports; additional |
||
|
|
|
|
|
features in DMA for the serial port |
|
ADSP-21065L |
|
544 kbit |
|
A recent addition to the family; fast and very |
|
|
|
low cost ($10). Will attract many fixed point |
||
|
|
|
|
|
applications to the SHARC family |
|
ADSP-21020 |
|
-0- |
|
Oldest member of the family. Contains the |
|
|
|
core processor, but no on-chip memory or |
||
|
|
|
|
|
I/O interface. Not quite a SHARC DSP. |
|
|
|
|
|
|
TABLE 29-1
Members of the SHARC family.
computers within a single chip. All they require to operate is a source of power, and some way to load a program into memory, such as an external PROM or data link.
Notice in Table 29-1 that even the low-end products have a very significant amount of memory. For instance, the ADSP-21065L has 544 kbits of internal SRAM. This is enough to hold 6-8 seconds of digitized speech (8k samples per second, 8 bits per sample). On the high-end of the family, the ADSP-21060 has a 4 Mbit memory. This is more than enough to store an entire digitized image (512×512 pixels, 8 bits per pixel). If you require even more memory, you easily add external SRAM (or slower memory) to any of these devices.
In addition to memory, there are also differences between these family members in their I/O sections. The ADSP-21060 and ADSP-21062 (the highend) each have six link ports. These are 4 bit wide parallel connections for combining DSPs in multiprocessing systems, and other applications that require flexible high-speed I/O. The ADSP-21061 and ADSP-21065L (the low-end) do not have link ports, but feature more DMA channels to assist in their serial port operation. You will also see these part numbers with an "L" or "M" after them, such as "ADSP-21060L." This indicates that the device operates from a voltage lower than the traditional 5.0 volts. For
|
Chapter 29Getting Started with DSPs |
537 |
||
audio in |
|
|
|
emulator |
CODEC |
|
|
connector |
|
audio out |
|
|
|
|
|
|
|
|
|
|
flag LEDs |
serial |
JTAG |
Expansion |
|
port |
|||
|
|
SHARC |
serial |
|
|
|
port |
||
|
|
|
|
|
|
reset |
ADSP-21061 |
link |
|
|
flag |
|
|
ports |
|
IRQ |
|
|
|
|
|
|
|
|
|
|
processor bus |
|
|
serial cable |
UART/ |
|
|
|
(to PC) |
|
PROM |
|
|
RS-232 |
|
|
||
|
|
|
||
|
Driver |
|
|
POWER |
9-12 vdc, 1 amp
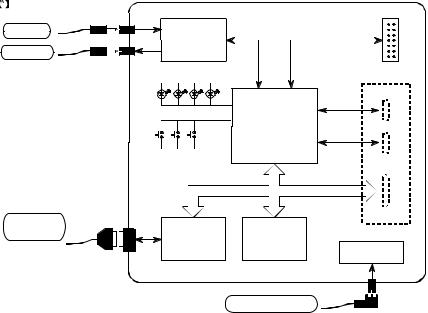
FIGURE 29-1
Block diagram of the EZ-KIT Lite board. Only four external connections are needed: audio in, audio out, a serial (RS-232) cable to your personal computer, and power. The serial cable and power supply are provided with the EZ-KIT Lite.
instance, the ADSP-21060L operates from 3.3 volts, while the ADSP-21160M uses only 2.5 volts.
In June 1998, Analog Devices unveiled the second generation of its SHARC architecture, with the announcement of the ADSP-21160. This features a Single Instruction Multiple Data (SIMD, or "sim-dee") core architecture operating at 100 MHz, an accelerated memory bus bandwidth of 1600 megabytes per second, two 64 bit data busses, and four 80-bit accumulators for fixed point calculations. All totaled, the new ADSP-21160M executes a 1024 point FFT in only 46 microseconds. The SIMD DSP contains a second set of computational units (arithmetic and logic unit, barrel shifter, data register file, and multiplier), allowing ADI to maintain backward code compatibility with the ADSP-2106x family, while providing a road-map to up to ten times higher performance.
The SHARC EZ-KIT Lite
The EZ-kit Lite gives you everything you need to learn about the SHARC DSP, including: hardware, software, and reference manuals. Figure 29-1 shows a block diagram of the hardware provided in the EZ-KIT Lite, based around the ADSP-21061 Digital Signal Processor. This comes as a 4½ × 6½ inch printed circuit board, mounted on plastic standoffs to allow it to sit on
538 |
The Scientist and Engineer's Guide to Digital Signal Processing |
your desk. (There is also a version called the EZ-LAB, using the ADSP21062, that plugs into a slot in your computer). There are only four connections you need to worry about: DC power, a serial connection to your personal computer, and the input and output signals. A DC power supply and serial cable are even provided in the kit. The input and output signals are at audio level, about 1 volt amplitude. Alternatively, a jumper on the board allows a microphone to be directly attached into the input. The idea is to plug a microphone into the input, and attach a set of amplified speakers (such as used with personal computers) to the output. This allows you to hear the effect of various DSP algorithms.
Analog-to-digital and digital-to-analog conversion is accomplished with an Analog Devices AD1847 codec (coder-decoder). This is a 16 bit sigma-delta converter, capable of digitizing two channels (stereo) at a rate of up to 48k samples/second, and simultaneously outputing two channels at the same rate. Since the primary use of this board is to process audio signals, the inputs and outputs are AC coupled with a cutoff of about 20 Hz.
Three push buttons on the board allow the user to generate an interrupt, reset the processor, and toggle a flag bit that can be read by the system. Four LEDs mounted on the board can be turned on and off by toggling bits. If you are ambitious, there are sections of the board that allow you to access the serial port, link ports (only on the EZ-LAB with its ADSP-21062), and processor bus. However, these are unpopulated, and you will need to attach the connectors and other components yourself.
Here's how it works. When the power is applied, the processor boots from an on-board EPROM (512 kbytes), loading a program that establishes serial communication with your personal computer. Next, you launch the EZ-Lite Host program on you PC, allowing you to download programs and upload data from the DSP. Several prewritten programs come with the EZ-KIT Lite; these can be run by simply clicking on icons. For instance, a band-pass program allows you to speak into the microphone, and hear the result after passing through a band-pass filter. These programs are useful for two reasons: (1) they allow you to quickly get the system doing something interesting, giving you confidence that it does work, and (2) they provide a template for creating programs of your own. Which brings us to our next topic, a design example using the EZ-KIT Lite.
Design Example: An FIR Audio Filter
After you experiment with the prewritten programs for awhile, you will want to modify them to gain experience with the programming. Programs can be written in either assembly or C; the EZ-KIT Lite provides software tools to support both languages. Later in this chapter we will look at advanced methods of programming, such as simulation, debugging, and working in an integrated development environment. For now, we will focus on the easiest way to get a program to run. Little steps for little feet.
Chapter 29Getting Started with DSPs |
539 |
3 |
|
|
|
|
|
|
a. Frequency response |
|
|
|
|
2 |
|
|
|
|
|
Amplitude |
|
|
|
|
|
1 |
|
|
|
|
|
0 |
|
|
|
|
|
0 |
0.1 |
0.2 |
0.3 |
0.4 |
0.5 |
|
|
Frequency |
|
|
|
Amplitude
1.5
b.Impulse response (filter kernel)
1.0


0.5 |
|
|
|
0.0 |
|
|
|
-0.5 |
|
|
|
0 |
100 |
200 |
300 |
Sample number
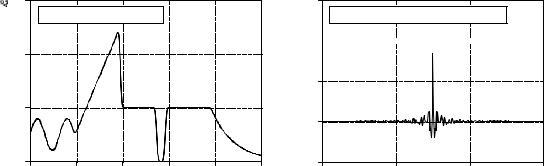
FIGURE 29-2
Example FIR filter. In (a) the frequency response of a highly custom filter is shown. The corresponding impulse response (filter kernel) is shown in (b). This filter was designed in Chapter 17 to show that virtually any frequency response can be achieved with FIR digital filters.
Since the source code is in ASCII, a standard text editor is all that is needed to make changes to existing files, or create entirely new programs. Table 29-2 shows an example of an FIR filter program written in assembly. While this is the only code you need to worry about for now, keep in mind that there are other files needed to make this a complete program. This includes an "architecture description file" (which defines the hardware configuration and memory allocation), setup of the interrupt vector table, and a codec initialization routine. Eventually you will need to understand what goes on in these sections, but for now you simply copy them from the prewritten programs.
As shown at the top of Table 29-2, there are three variables that need to be defined before jumping into the main section of code. These are the number of points in the filter kernel, NR_COEF; a circular buffer that holds the past samples from the input signal, dline[ ]; and a circular buffer that holds the filter kernel, coef[ ]. We also need to give the program two other pieces of information: the sampling rate of the codec, and the name of the file containing the filter kernel, so that it can be read into coef[ ]. All these steps are easy; nothing more than a single line of code each. We don't show them in this example because they are contained in the sections of code that we are ignoring for simplicity.
Figure 29-2 shows the filter kernel we will test the program with, the same custom filter we designed in Chapter 17. As you recall, this filter was chosen to have a very irregular frequency response, reinforcing the notion that FIR digital filters can provide virtually any frequency response you desire. Figure
(a) shows the frequency response of our test filter, while (b) shows the corresponding impulse response (i.e., the filter kernel). This 301 point filter kernel is stored in an ASCII file, and is combined with the other sections of code during linking to form a single executable program.
540 |
The Scientist and Engineer's Guide to Digital Signal Processing |
The main section of the program performs two functions. In lines 6 to 13, the data-address-generators (DAGs) are configured to manage the circular buffers: dline[ ], and coef[ ]. As described in the last chapter, three parameters are needed for each buffer: the starting location of the buffer in memory (b0 and b8), the length of the buffer (l0 and l8), and the step size of the data being stored in the buffer (m0 and m8). These parameters that control the circular buffers are stored in hardware registers in the DAGs, allowing them to access and manage the data very efficiently.
The second action of the main program is a "thumb-twiddling" loop, implemented in lines 15 to 19. This does nothing but wait for an interrupt indicating that an input sample has been acquired. All of the processing in this program occurs on a sample-by-sample basis. Each time a sample is read from the input, a sample in the output signal is calculated and routed to the codec. Most time-domain algorithms, such as FIR and IIR filters, fall into this category. The alternative is frame-by-frame processing, which is required for frequency-domain techniques. In the frame-by-frame method, a group of samples is read from the input, calculations are conducted, and a group of samples is written to the output.
The subroutine that services the sample-ready interrupt is broken into three sections. The first section (lines 27 to 33) fetches the sample from the codec as a fixed point number, and converts it to floating point. In SHARC assembly language, a data register holding a fixed point number is referred to by "r" (such as r0, r8, r15, etc.), and by "f" if it is holding a floating point number (i.e., f0, f8, or f15.). For instance, in line 32, the fixed point number in data register 0 (i.e., r0) is converted into a floating point number and overwrites data register 0 (i.e., f0). This conversion is done according to a scaling specified by the fixed point number in data register 1 (i.e. r1). In the third section (lines 47 to 53), the opposite steps take place; the floating point number for the output sample is converted to fixed point and sent to the codec.
The FIR filter that converts the input samples into the output samples is contained in lines 35 to 45. All the calculations are carried out in floating point, avoiding the need to worry about scaling and overflow. As described in the last chapter, this section of code is optimized to take advantage of the SHARC DSP's ability to execute multiple instructions each clock cycle.
After we have the assembly program written and the filter kernel designed, we are ready to create a program that can be executed on the SHARC DSP. This is done by running the compiler, the assembler, and then the linker; three programs provided with the EZ-KIT Lite. The compiler converts a C program into the SHARC's assembly language. If you directly write the program in assembly, such as in this example, you bypass this step. The assembler and linker convert the program and external files (such as the architecture file, codec initialization routines, filter kernel, etc.) into the final executable file. All this takes about 30 seconds, with the final result being a SHARC program residing on the harddisk of your PC. The EZ-KIT Lite host is then used to run the program on the EZ-KIT Lite. Simply click
|
|
Chapter 29Getting Started with DSPs |
541 |
||
Before entering the main program, the following constant and variables must be defined: |
|||||
NR_COEF |
The number of coefficients in the filter kernel (301 in this example) |
||||
dline[NR_COEF] |
A circular buffer holding the past input samples, in data memory |
||||
coef[NR_COEF] |
A circular buffer holding the filter coefficients, in program memory |
||||
001 |
|
||||
/************************************************************************ |
|||||
002 |
****************** |
MAIN PROGRAM |
********************** |
||
003 |
************************************************************************/ |
||||
004 |
main: |
|
|
|
|
005 |
|
|
|
|
|
006 |
/* INITIALIZE THE DAGS TO CONTROL THE CIRCULAR BUFFERS */ |
||||
007 |
|
|
|
|
|
008 |
b0 = dline; |
/* set up dline[ ], the buffer holding the past input samples */ |
|||
009 |
l0 = @dline; |
|
|
|
|
010 |
m0 = 1; |
|
|
|
|
011 |
b8 = coef; |
/* set up coef[ ], the buffer holding the filter coefficients */ |
|||
012 |
l8 = @coef; |
|
|
|
|
013 |
m8 = 1; |
|
|
|
|
014 |
|
|
|
|
|
015 |
/* ENTER A LOOP, WAITING FOR THE SAMPLE-READY INTERRUPT */ |
||||
016 |
|
|
|
|
|
017 |
wait: |
|
|
|
|
018 |
idle; |
|
|
|
|
019 |
jump wait; |
|
|
|
|
020 |
|
|
|
|
|
021 |
|
|
|
|
|
022 |
/*********************************************************************** |
||||
023 |
********* |
SUBROUTINE TO PROCESS ONE SAMPLE |
*********** |
||
024 |
***********************************************************************/ |
||||
025 |
sample_ready: |
|
|
|
|
026 |
|
|
|
|
|
027 |
/* ACQUIRE THE INPUT SAMPLE, CONVERT TO FLOATING POINT */ |
||||
028 |
|
|
|
|
|
029 |
r0 = dm(rx_buf + 1); |
/* move the input sample into r0 */ |
|
||
030 |
r0 = lshift r0 by 16; |
/* shift to the highest 16 bits to preserve the sign */ |
|||
031 |
r1 = -31; |
|
/* set the scaling for the conversion */ |
|
|
032 |
f0 = float r0 by r1; |
/* convert from fixed to floating point */ |
|||
033 |
dm(i0,m0) = f0; |
/* store the new sample in dline[ ], and zero f12 */ |
|||
034 |
|
|
|
|
|
035 |
/* CALCULATE THE OUTPUT SAMPLE FROM THE FIR FILTER */ |
||||
036 |
|
|
|
|
|
037 |
f12 = 0; |
|
/* prime the registers */ |
||
038 |
f2 = dm(i0,m0), f4 = pm(i8,m8); |
|
|
||
039 |
f8 = f2*f4, f2 = dm(i0,m0), f4 = pm(i8,m8); |
|
|
||
040 |
|
|
/* efficient main loop */ |
||
041 |
lcntr = NR_COEF-2, do (pc,1) until lce; |
|
|
||
042 |
f8 = f2*f4, f12 = f8+f12, f2 = dm(i0,m0), f4 = pm(i8,m8); |
|
|||
043 |
|
|
|
|
|
044 |
f8 = f2*f4, f12 = f8+f12; |
/* complete the last loop */ |
|||
045 |
f12 = f8+f12; |
|
|
|
|
046 |
|
|
|
|
|
047 |
/* CONVERT THE OUTPUT SAMPLE TO FIXED POINT & OUTPUT */ |
||||
048 |
|
|
|
|
|
049 |
r1 = 31; |
|
/* set the scaling for the conversion */ |
|
|
050 |
r8 = fix f12 by r1; |
/* convert from floating to fixed point */ |
|||
051 |
rti(db); |
|
/* return from interrupt, but execute next 2 lines */ |
||
052 |
r8 = lshift r8 by -16; |
/* shift to the lowest 16 bits */ |
|
||
053 |
dm(tx_buf + 1) = r8; |
/* move the sample to the output */ |
|
||
|
|
|
|
|
|
TABLE 29-2
FIR filter program in assembly.
542 |
The Scientist and Engineer's Guide to Digital Signal Processing |
on the file you want the DSP to run, and the EZ-KIT Lite host takes care of the rest, downloading the program and starting it running.
This brings us to two questions. First, how do we test our audio filter to make sure it is operating as we designed it; and second, what in the world is a company called Analog Devices doing making Digital Signal Processors?
Analog measurements on a DSP system
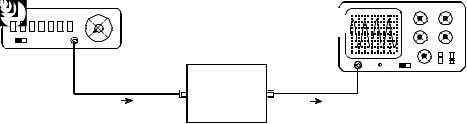
For just a few moments, forget that you are studying digital techniques. Let's take a look at this from the standpoint of an engineer that specializes in analog electronics. He doesn't care what is inside of the EZ-KIT Lite, only that it has an analog input and an analog output. As shown in Fig. 29-3, he would invoke the traditional analog method of analyzing a "black box," attach a signal generator to the input, and look at the output on an oscilloscope.
What does our analog guru find? First, the system is linear (as least as far as this simple test can tell). If a sine wave is placed into the input, a sine wave is observed on the output. If the amplitude or frequency of the input is changed, a corresponding change is seen in the output. When the input frequency is slowly increased, there comes a point where the amplitude of the output sine wave decreases rapidly to zero. That occurs just below one-half the sampling rate, due to the action of the anti-alias filter on the ADC.
Now our engineer notices something unknown in the analog world: the system has a perfect linear phase. In other words, there is a constant delay between an event occurring in the input signal, and the result of that event in the output signal. For instance, consider our example filter kernel in Fig. 29-3. Since the center of symmetry is at sample 150, the output signal will be delayed by 150 samples relative to the input signal. If the system is sampling at 8 kHz, for example, this delay will be 18.75 milliseconds. In addition, the sigma-delta converter will also provide a small additional fixed delay.
Signal Generator |
|
|
|
|
Oscilloscope |
|
|
|||||||||||||||||||||||||||||
|
|
|
|
|
|
|
|
|
|
|
|
|
|
|
|
|
|
|
||||||||||||||||||
|
|
|
|
|
|
|
|
|
|
|
|
|
|
|
|
|
|
|
|
|
|
|
|
|
|
|
|
|
|
|
|
|
|
|
|
|
|
|
|
|
|
|
|
|
|
|
|
|
|
|
|
|
|
|
|
|
|
|
|
|
|
|
|
|
|
|
|
|
|
|
|
|
|
|
|
|
|
|
|
|
|
|
|
|
|
|
|
|
|
|
|
|
|
|
|
|
|
|
|
|
|
|
|
|
|
|
|
|
|
|
|
|
|
|
|
|
|
|
|
|
|
|
|
|
|
|
|
|
|
|
|
|
|
|
|
|
|
|
|
|
|
|
|
|
|
|
|
|
|
|
|
|
|
|
|
|
|
|
|
|
|
|
|
|
|
|
|
|
|
|
|
|
|
|
|
|
|
|
|
|
|
|
|
|
input |
output |
EZ-KIT
FIGURE 29-3
Testing the EZ-KIT Lite. Analog engineers test the performance of a system by connecting a signal generator to its input, and an oscilloscope to its output. When a DSP system (such as the EZ-KIT Lite) is tested in this way, it appears to be a virtually perfect analog system
Chapter 29Getting Started with DSPs |
543 |
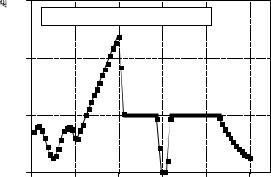
FIGURE 29-4
Measured frequency response. This graph shows measured points on the frequency response of the example FIR filter. These measured points have far less accuracy than the designed frequency response of Fig. 293a.
3 |
|
|
|
|
|
|
Measured frequency response |
|
|||
2 |
|
|
|
|
|
Amplitude |
|
|
|
|
|
1 |
|
|
|
|
|
0 |
|
|
|
|
|
0 |
2000 |
4000 |
6000 |
8000 |
10000 |
|
|
Frequency |
|
|
|
Our analog engineer will become very agitated when he sees this linear phase. The signals won't appear the way he thinks they should, and he will start twisting knobs at lightning speed. He will complain that the triggering isn't working right, and mumble such things as: "this doesn't make sense," what's going on here?", and "who's been playing with my oscilloscope?" The performance of DSP systems is so good, it will take him a few minutes before he understands what he is seeing.
To make him even more impressed, we ask our engineer to manually measure the frequency response of the system. To do this, he will step the signal generator through all the frequencies between 125 Hz and 10 kHz in increments of 125 Hz. At each frequency he measures the amplitude of the output signal and divides it by the amplitude of the input signal. (Of course, the easiest way to do this is to keep the input signal at a constant amplitude). We set the sampling rate of the EZ-KIT Lite at 22 kHz for this test. In other words, the 0 to 0.5 digital frequency of Fig. 29-2a is mapped to DC to 11 kHz in our real world measurement.
Figure 29-4 shows actual measurements taken on the EZ-KIT Lite; it couldn't be better! The measured data points agree with the theoretical curve within the limit of measurement error. This is something our analog engineer has never seen with filters made from resistors, capacitors, and inductors.
However, even this doesn't give the DSP the credit it deserves. Analog measurements using oscilloscopes and digital-volt-meters have a typical accuracy and precision of about 0.1% to 1%. In comparison, this DSP system is limited only by the -0.001% round-off error of the 16 bit codec, since the internal calculations use floating point. In other words, the device being evaluated is one-hundred times more precise than the measurement tool being used. A proper evaluation of the frequency response would require a specialized instrument, such as a computerized data acquisition system with a 20 bit ADC. Given these facts, it is not surprising that DSPs are often used in measurement instruments to achieve high precision.
544 |
The Scientist and Engineer's Guide to Digital Signal Processing |
Now we can answer the question: Why does Analog Devices sell Digital Signal Processors? Only a decade ago, state-of-the-art signal processing was carried out with precision op amps and similar transistor circuits. Today, the highest quality analog processing is accomplished with digital techniques. Analog Devices is a great role-model for individuals and other companies; hold on to your vision and goals, but don't be afraid to adapt with the changing technology!
Another Look at Fixed versus Floating Point
In this last example, we took advantage of one of the SHARC DSP's key features, its ability to handle floating point calculations. Even though the samples are in a fixed point format when passed to and from the codec, we go to the trouble of converting them to floating point for the intermediate FIR filtering algorithm. As discussed in the last chapter, there are two reasons for wanting to process the data with floating point math: ease of programming, and performance. Does it really make a difference?
For the programmer, yes, it makes a large difference. Floating point code is far easier to write. Look back at the assembly program in Table 29-2. There are only two lines (41 and 42) in the main FIR filter. In contrast, the fixed point programmer must add code to manage the data at each math calculation. To avoid overflow and underflow, the values must be checked for size and, if needed, scaled accordingly. The intermediate results will also need to be stored in an extended precision accumulator to avoid the devastating effects of repeated round-off error.
The issue of performance is much more subtle. For example, Fig. 29-5a shows an FIR low-pass filter with a moderately sharp cutoff, as described in Chapter 16. This "large scale" curve would look the same whether fixed or floating point were used in the calculation. To see the difference between these two methods, we must zoom in on the amplitude by a factor of several hundred as shown in (b), (c), and (d). Here we can see a clear difference. The floating point execution, (b), has such low round-off noise that its performance is limited by the way we designed the filter kernel. The 0.02% overshoot near the transition is a characteristic of the Blackman window used in this filter. The point is, if we want to improve the performance, we need to work on the algorithm, not the implementation. The curves in (c) and (d) show the roundoff noise introduced when each point in the filter kernel is represented by 16 and 14 bits, respectively. A better algorithm would do nothing to make these better curves; the shape of the actual frequency response is swamped by noise.
Figure 29-6 shows the difference between fixed and floating point in the time domain. Figure (a) shows a wiggly signal that exponentially decreases in amplitude. This might represent, for example, the sound wave from a plucked string, or the shaking of the ground from a distant explosion. As before, this "large scale" waveform would look the same whether fixed or floating point were used to represent the samples. To see the difference,