

TsOS / DSP_guide_Smith / Ch25
.pdfCHAPTER
Special Imaging Techniques
25
This chapter presents four specific aspects of image processing. First, ways to characterize the spatial resolution are discussed. This describes the minimum size an object must be to be seen in an image. Second, the signal-to-noise ratio is examined, explaining how faint an object can be and still be detected. Third, morphological techniques are introduced. These are nonlinear operations used to manipulate binary images (where each pixel is either black or white). Fourth, the remarkable technique of computed tomography is described. This has revolutionized medical diagnosis by providing detailed images of the interior of the human body.
Spatial Resolution
Suppose we want to compare two imaging systems, with the goal of determining which has the best spatial resolution. In other words, we want to know which system can detect the smallest object. To simplify things, we would like the answer to be a single number for each system. This allows a direct comparison upon which to base design decisions. Unfortunately, a single parameter is not always sufficient to characterize all the subtle aspects of imaging. This is complicated by the fact that spatial resolution is limited by two distinct but interrelated effects: sample spacing and sampling aperture size. This section contains two main topics: (1) how a single parameter can best be used to characterize spatial resolution, and (2) the relationship between sample spacing and sampling aperture size.
Figure 25-1a shows profiles from three circularly symmetric PSFs: the pillbox, the Gaussian, and the exponential. These are representative of the PSFs commonly found in imaging systems. As described in the last chapter, the pillbox can result from an improperly focused lens system. Likewise, the Gaussian is formed when random errors are combined, such as viewing stars through a turbulent atmosphere. An exponential PSF is generated when electrons or x-rays strike a phosphor layer and are converted into
423

424 |
The Scientist and Engineer's Guide to Digital Signal Processing |

 Amplitude
1.25 |
|
1.25 |
|
a. PSF |
b. MTF |
|
|
1.00 |
1.00 |
|
|
|
P |
|
|
0.50 |
Amplitude 0.50 |
|
|
0.75 |
0.75 |
|
|
|
|
G |
P |
|
E |
|
|
|
|
|
0.25 |
|
|
|
|
|
|
|
E |
0.25 |
|
|
|
|
|
|
|
|
|
|
|
G |
|
|
|
|
|
|
0.00 |
|
|
|
|
|
|
|
0.00 |
|
|
|
|
|
|
|
|
|
|
|
|
|
|
|
|
|
||
-2 |
-1.5 |
-1 |
-0.5 |
0 |
0.5 |
1 |
1.5 |
2 |
0 |
0.5 |
1 |
1.5 |
2 |
Distance |
Spatial frequency (lp per unit distance) |
FIGURE 25-1
FWHM versus MTF. Figure (a) shows profiles of three PSFs commonly found in imaging systems: (P) pillbox,
(G) Gaussian, and (E) exponential. Each of these has a FWHM of one unit. The corresponding MTFs are shown in (b). Unfortunately, similar values of FWHM do not correspond to similar MTF curves.
light. This is used in radiation detectors, night vision light amplifiers, and CRT displays. The exact shape of these three PSFs is not important for this discussion, only that they broadly represent the PSFs seen in real world applications.
The PSF contains complete information about the spatial resolution. To express the spatial resolution by a single number, we can ignore the shape of the PSF and simply measure its width. The most common way to specify this is by the Full-Width-at-Half-Maximum (FWHM) value. For example, all the PSFs in
(a) have an FWHM of 1 unit.
Unfortunately, this method has two significant drawbacks. First, it does not match other measures of spatial resolution, including the subjective judgement of observers viewing the images. Second, it is usually very difficult to directly measure the PSF. Imagine feeding an impulse into an imaging system; that is, taking an image of a very small white dot on a black background. By definition, the acquired image will be the PSF of the system. The problem is, the measured PSF will only contain a few pixels, and its contrast will be low. Unless you are very careful, random noise will swamp the measurement. For instance, imagine that the impulse image is a 512×512 array of all zeros except for a single pixel having a value of 255. Now compare this to a normal image where all of the 512×512 pixels have an average value of about 128. In loose terms, the signal in the impulse image is about 100,000 times weaker than a normal image. No wonder the signal-to-noise ratio will be bad; there's hardly any signal!
A basic theme throughout this book is that signals should be understood in the domain where the information is encoded. For instance, audio signals should be dealt with in the frequency domain, while image signals should be handled in the spatial domain. In spite of this, one way to measure image resolution is by looking at the frequency response. This goes against the fundamental
Chapter 25Special Imaging Techniques |
425 |
philosophy of this book; however, it is a common method and you need to become familiar with it.
Taking the two-dimensional Fourier transform of the PSF provides the twodimensional frequency response. If the PSF is circularly symmetric, its frequency response will also be circularly symmetric. In this case, complete information about the frequency response is contained in its profile. That is, after calculating the frequency domain via the FFT method, columns 0 to N/2 in row 0 are all that is needed. In imaging jargon, this display of the frequency response is called the Modulation Transfer Function (MTF). Figure 25-1b shows the MTFs for the three PSFs in (a). In cases where the PSF is not circularly symmetric, the entire two-dimensional frequency response contains information. However, it is usually sufficient to know the MTF curves in the vertical and horizontal directions (i.e., columns 0 to N/2 in row 0, and rows 0 to N/2 in column 0). Take note: this procedure of extracting a row or column from the two-dimensional frequency spectrum is not equivalent to taking the one-dimensional FFT of the profiles shown in (a). We will come back to this issue shortly. As shown in Fig. 25-1, similar values of FWHM do not correspond to similar MTF curves.
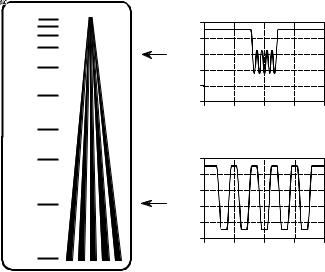
Figure 25-2 shows a line pair gauge, a device used to measure image resolution via the MTF. Line pair gauges come in different forms depending on the particular application. For example, the black and white pattern shown in this figure could be directly used to test video cameras. For an x-ray imaging system, the ribs might be made from lead, with an x-ray transparent material between. The key feature is that the black and white lines have a closer spacing toward one end. When an image is taken of a line pair gauge, the lines at the closely spaced end will be blurred together, while at the other end they will be distinct. Somewhere in the middle the lines will be just barely separable. An observer looks at the image, identifies this location, and reads the corresponding resolution on the calibrated scale.
FIGURE 25-2
Line pair gauge. The line pair gauge is a tool used to measure the resolution of imaging systems. A series of black and white ribs move together, creating a continuum of spatial frequencies. The resolution of a system is taken as the frequency where the eye can no longer distinguish the individual ribs. This example line pair gauge is shown several times larger than the calibrated scale indicates.
line pairs / mm
40
30
20
15
10
7
5
4
3
a. Example profile at 12 lp/mm
250 |
|
|
|
|
200 |
|
|
|
|
value |
|
|
|
|
150 |
|
|
|
|
Pixel |
|
|
|
|
100 |
|
|
|
|
50 |
|
|
|
|
0 |
|
|
|
|
0 |
60 |
120 |
180 |
240 |
|
Pixel number |
|
|
|
b. Example profile at 3 lp/mm |
||||
250 |
|
|
|
|
200 |
|
|
|
|
value |
|
|
|
|
150 |
|
|
|
|
Pixel |
|
|
|
|
100 |
|
|
|
|
50 |
|
|
|
|
0 |
|
|
|
|
0 |
60 |
120 |
180 |
240 |
2 |
Pixel number |
426 |
The Scientist and Engineer's Guide to Digital Signal Processing |
The way that the ribs blur together is important in understanding the limitations of this measurement. Imagine acquiring an image of the line pair gauge in Fig. 25-2. Figures (a) and (b) show examples of the profiles at low and high spatial frequencies. At the low frequency, shown in (b), the curve is flat on the top and bottom, but the edges are blurred, At the higher spatial frequency, (a), the amplitude of the modulation has been reduced. This is exactly what the MTF curve in Fig. 25-1b describes: higher spatial frequencies are reduced in amplitude. The individual ribs will be distinguishable in the image as long as the amplitude is greater than about 3% to 10% of the original height. This is related to the eye's ability to distinguish the low contrast difference between the peaks and valleys in the presence of image noise.
A strong advantage of the line pair gauge measurement is that it is simple and fast. The strongest disadvantage is that it relies on the human eye, and therefore has a certain subjective component. Even if the entire MTF curve is measured, the most common way to express the system resolution is to quote the frequency where the MTF is reduced to either 3%, 5% or 10%. Unfortunately, you will not always be told which of these values is being used; product data sheets frequently use vague terms such as "limiting resolution." Since manufacturers like their specifications to be as good as possible (regardless of what the device actually does), be safe and interpret these ambiguous terms to mean 3% on the MTF curve.
A subtle point to notice is that the MTF is defined in terms of sine waves, while the line pair gauge uses square waves. That is, the ribs are uniformly dark regions separated by uniformly light regions. This is done for manufacturing convenience; it is very difficult to make lines that have a sinusoidally varying darkness. What are the consequences of using a square wave to measure the MTF? At high spatial frequencies, all frequency components but the fundamental of the square wave have been removed. This causes the modulation to appear sinusoidal, such as is shown in Fig. 25-2a. At low frequencies, such as shown in Fig. 25-2b, the wave appears square. The fundamental sine wave contained in a square wave has an amplitude of 4/B ' 1.27 times the amplitude of the square wave (see Table 13-10). The result: the line pair gauge provides a slight overestimate of the true resolution of the system, by starting with an effective amplitude of more than pure black to pure white. Interesting, but almost always ignored.
Since square waves and sine waves are used interchangeably to measure the MTF, a special terminology has arisen. Instead of the word "cycle," those in imaging use the term line pair (a dark line next to a light line). For example, a spatial frequency would be referred to as 25 line pairs per millimeter, instead of 25 cycles per millimeter.
The width of the PSF doesn't track well with human perception and is difficult to measure. The MTF methods are in the wrong domain for understanding how resolution affects the encoded information. Is there a more favorable alternative? The answer is yes, the line spread function (LSF) and the edge response. As shown in Fig. 25-3, the line spread

Chapter 25Special Imaging Techniques |
427 |
|
a. Line Spread Function (LSF) |
b. Edge Response |
|
90% |
50% |
10% |
Full Width at |
|
|
|
10% to 90% |
||
Half Maximum |
|
|
|
|
|
Edge response |
|
|
|
|
|||
(FWHM) |
|
|
|
|
||
FIGURE 25-3
Line spread function and edge response. The line spread function (LSF) is the derivative of the edge response. The width of the LSF is usually expressed as the Full-Width-at-Half-Maximum (FWHM). The width of the edge response is usually quoted by the 10% to 90% distance.
function is the response of the system to a thin line across the image. Similarly, the edge response is how the system responds to a sharp straight discontinuity (an edge). Since a line is the derivative (or first difference) of an edge, the LSF is the derivative (or first difference) of the edge response. The single parameter measurement used here is the distance required for the edge response to rise from 10% to 90%.
There are many advantages to using the edge response for measuring resolution. First, the measurement is in the same form as the image information is encoded. In fact, the main reason for wanting to know the resolution of a system is to understand how the edges in an image are blurred. The second advantage is that the edge response is simple to measure because edges are easy to generate in images. If needed, the LSF can easily be found by taking the first difference of the edge response.
The third advantage is that all common edges responses have a similar shape, even though they may originate from drastically different PSFs. This is shown in Fig. 25-4a, where the edge responses of the pillbox, Gaussian, and exponential PSFs are displayed. Since the shapes are similar, the 10%-90% distance is an excellent single parameter measure of resolution. The fourth advantage is that the MTF can be directly found by taking the one-dimensional FFT of the LSF (unlike the PSF to MTF calculation that must use a twodimensional Fourier transform). Figure 25-4b shows the MTFs corresponding to the edge responses of (a). In other words, the curves in (a) are converted into the curves in (b) by taking the first difference (to find the LSF), and then taking the FFT.

428 |
The Scientist and Engineer's Guide to Digital Signal Processing |
Amplitude

|
|
|
|
|
10% to 90% |
|
|
|
|
|
|
|
Limiting resolution |
|||
|
|
|
|
|
|
|
|
|
|
|
|
|||||
1.25 |
|
|
|
|
distance |
|
|
|
-10% |
-5% |
-3% |
|
||||
|
|
|
|
|
|
|
||||||||||
|
|
|
|
|
|
|
|
|
1.25 |
|
|
|
|
|
|
|
|
|
|
|
|
|
|
|
|
|
|
|
|
|
|
||
|
|
|
|
|
|
|
|
|
|
|
|
|
|
|
|
|
|
|
a. Edge response |
|
|
|
|
|
|
b. MTF |
|
|
|
|
|||
|
|
|
|
|
|
|
|
|
|
|
|
|
|
|
|
|
1.00 |
1.00 |
E |
|
G |
0.50 |
|
Amplitude 0.50 |
0.75 |
P |
0.75 |
|
|
|
0.25 |
|
E |
|
0.25 |
P |
G |
|
0.00 |
|
|
|
|
|
|
|
|
0.00 |
|
|
|
|
-2 |
-1.5 |
-1 |
-0.5 |
0 |
0.5 |
1 |
1.5 |
2 |
0 |
0.5 |
1 |
1.5 |
2 |
Distance |
Spatial frequency (lp per unit distance) |
FIGURE 25-4
Edge response and MTF. Figure (a) shows the edge responses of three PSFs: (P) pillbox, (G) Gaussian, and
(E) exponential. Each edge response has a 10% to 90% rise distance of 1 unit. Figure (b) shows the corresponding MTF curves, which are similar above the 10% level. Limiting resolution is a vague term indicating the frequency where the MTF has an amplitude of 3% to 10%.
The fifth advantage is that similar edge responses have similar MTF curves, as shown in Figs. 25-4 (a) and (b). This allows us to easily convert between the two measurements. In particular, a system that has a 10%-90% edge response of x distance, has a limiting resolution (10% contrast) of about 1 line pair per x distance. The units of the "distance" will depend on the type of system being dealt with. For example, consider three different imaging systems that have 10%-90% edge responses of 0.05 mm, 0.2 milliradian and 3.3 pixels. The 10% contrast level on the corresponding MTF curves will occur at about: 20 lp/mm, 5 lp/milliradian and 0.33 lp/pixel, respectively.
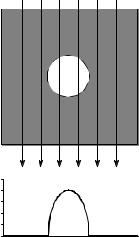
Figure 25-5 illustrates the mathematical relationship between the PSF and the LSF. Figure (a) shows a pillbox PSF, a circular area of value 1, displayed as white, surrounded by a region of all zeros, displayed as gray. A profile of the PSF (i.e., the pixel values along a line drawn across the center of the image) will be a rectangular pulse. Figure (b) shows the corresponding LSF. As shown, the LSF is mathematically equal to the integrated profile of the PSF. This is found by sweeping across the image in some direction, as illustrated by the rays (arrows). Each value in the integrated profile is the sum of the pixel values along the corresponding ray.
In this example where the rays are vertical, each point in the integrated profile is found by adding all the pixel values in each column. This corresponds to the LSF of a line that is vertical in the image. The LSF of a line that is horizontal in the image is found by summing all of the pixel values in each row. For continuous images these concepts are the same, but the summations are replaced by integrals.
As shown in this example, the LSF can be directly calculated from the PSF. However, the PSF cannot always be calculated from the LSF. This is because the PSF contains information about the spatial resolution in all directions, while the LSF is limited to only one specific direction. A system
Chapter 25Special Imaging Techniques |
429 |
FIGURE 25-5
Relationship between the PSF and LSF. A pillbox PSF is shown in (a). Any row or column through the white center will be a rectangular pulse. Figure (b) shows the corresponding LSF, equivalent to an integrated profile of the PSF. That is, the LSF is found by sweeping across the image in some direction and adding (integrating) the pixel values along each ray. In the direction shown, this is done by adding all the pixels in each column.
a. Point Spread Function
b."Integrated" profile of the PSF (the LSF)
has only one PSF, but an infinite number of LSFs, one for each angle. For example, imagine a system that has an oblong PSF. This makes the spatial resolution different in the vertical and horizontal directions, resulting in the LSF being different in these directions. Measuring the LSF at a single angle does not provide enough information to calculate the complete PSF except in the special instance where the PSF is circularly symmetric. Multiple LSF measurements at various angles make it possible to calculate a non-circular PSF; however, the mathematics is quite involved and usually not worth the effort. In fact, the problem of calculating the PSF from a number of LSF measurements is exactly the same problem faced in computed tomography, discussed later in this chapter.
As a practical matter, the LSF and the PSF are not dramatically different for most imaging systems, and it is very common to see one used as an approximation for the other. This is even more justifiable considering that there are two common cases where they are identical: the rectangular PSF has a rectangular LSF (with the same widths), and the Gaussian PSF has a Gaussian LSF (with the same standard deviations).
These concepts can be summarized into two skills: how to evaluate a resolution specification presented to you, and how to measure a resolution specification of your own. Suppose you come across an advertisement stating: "This system will resolve 40 line pairs per millimeter." You should interpret this to mean: "A sinusoid of 40 lp/mm will have its amplitude reduced to 3%-10% of its true value, and will be just barely visible in the image." You should also do the mental calculation that 40 lp/mm @ 10% contrast is equal to a 10%-90% edge response of 1/(40 lp/mm) = 0.025 mm. If the MTF specification is for a 3% contrast level, the edge response will be about 1.5 to 2 times wider.
When you measure the spatial resolution of an imaging system, the steps are carried out in reverse. Place a sharp edge in the image, and measure the
430 |
The Scientist and Engineer's Guide to Digital Signal Processing |
resulting edge response. The 10%-90% distance of this curve is the best single parameter measurement of the system's resolution. To keep your boss and the marketing people happy, take the first difference of the edge response to find the LSF, and then use the FFT to find the MTF.
Sample Spacing and Sampling Aperture
Figure 25-6 shows two extreme examples of sampling, which we will call a perfect detector and a blurry detector. Imagine (a) being the surface of an imaging detector, such as a CCD. Light striking anywhere inside one of the square pixels will contribute only to that pixel value, and no others. This is shown in the figure by the black sampling aperture exactly filling one of the square pixels. This is an optimal situation for an image detector, because all of the light is detected, and there is no overlap or crosstalk between adjacent pixels. In other words, the sampling aperture is exactly equal to the sample spacing.
The alternative example is portrayed in (e). The sampling aperture is considerably larger than the sample spacing, and it follows a Gaussian distribution. In other words, each pixel in the detector receives a contribution from light striking the detector in a region around the pixel. This should sound familiar, because it is the output side viewpoint of convolution. From the corresponding input side viewpoint, a narrow beam of light striking the detector would contribute to the value of several neighboring pixels, also according to the Gaussian distribution.
Now turn your attention to the edge responses of the two examples. The markers in each graph indicate the actual pixel values you would find in an image, while the connecting lines show the underlying curve that is being sampled. An important concept is that the shape of this underlying curve is determined only by the sampling aperture. This means that the resolution in the final image can be limited in two ways. First, the underlying curve may have poor resolution, resulting from the sampling aperture being too large. Second, the sample spacing may be too large, resulting in small details being lost between the samples. Two edge response curves are presented for each example, illustrating that the actual samples can fall anywhere along the underlying curve. In other words, the edge being imaged may be sitting exactly upon a pixel, or be straddling two pixels. Notice that the perfect detector has zero or one sample on the rising part of the edge. Likewise, the blurry detector has three to four samples on the rising part of the edge.
What is limiting the resolution in these two systems? The answer is provided by the sampling theorem. As discussed in Chapter 3, sampling captures all frequency components below one-half of the sampling rate, while higher frequencies are lost due to aliasing. Now look at the MTF curve in (h). The sampling aperture of the blurry detector has removed all frequencies greater than one-half the sampling rate; therefore, nothing is lost during sampling. This means that the resolution of this system is

Chapter 25Special Imaging Techniques |
431 |
Example 1: Perfect detector
Column
0 |
1 |
2 |
3 |
4 |
5 |
|
6 |
7 |
8 |
9 |
|||
0 |
|
|
|
|
|
|
|
|
|
|
|
|
|
|
a. Sampling grid with |
|
|
||||||||||
1 |
|
|
|
||||||||||
|
|
|
square aperture |
|
|
|
|
||||||
|
|
|
|
|
|
|
|
|
|
|
|
|
|
|
|
|
2 |
|
|
|
|
|
|
|
|
|
|
|
|
|
|
3 |
|
|
|
|
|
|
|
|
|
|
|
|
|
Row |
4 |
|
|
|
|
|
|
|
|
|
|
|
|
|
5 |
|
|
|
|
|
|
|
|
|
|
|
|
|
|
|
|
|
|
|
|
|
|
|
|
|
|
|
|
|
|
6 |
|
|
|
|
|
|
|
|
|
|
|
|
|
|
7 |
|
|
|
|
|
|
|
|
|
|
|
|
|
|
8 |
|
|
|
|
|
|
|
|
|
|
|
|
|
|
9 |
|
|
|
|
|
|
|
|
|
|
|
100 |
|
|
|
|
|
|
|
|
|
|
|
|
|
|
|
|
|
b. Edge response |
|
|
|
|
|
|
|
||||
|
75 |
|
|
|
|
|
|
|
|
|
|
|
|
|
value |
50 |
|
|
|
|
|
|
|
|
|
|
|
|
|
Pixel |
|
|
|
|
|
|
|
|
|
|
|
|
|
|
|
|
|
|
|
|
|
|
|
|
|
|
|
|
|
|
25 |
|
|
|
|
|
|
|
|
|
|
|
|
|
|
0 |
|
|
|
|
|
|
|
|
|
|
|
|
|
|
0 |
|
1 |
2 |
3 |
4 |
5 |
6 |
7 |
8 |
9 |
10 |
11 |
12 |
Pixel number
100 |
|
|
|
|
|
|
|
|
|
|
|
|
|
|
|
c. Edge response |
|
|
|
|
|
|
|
||||
|
75 |
|
|
|
|
|
|
|
|
|
|
|
|
value |
50 |
|
|
|
|
|
|
|
|
|
|
|
|
Pixel |
|
|
|
|
|
|
|
|
|
|
|
|
|
|
|
|
|
|
|
|
|
|
|
|
|
|
|
|
25 |
|
|
|
|
|
|
|
|
|
|
|
|
|
0 |
|
|
|
|
|
|
|
|
|
|
|
|
|
0 |
1 |
2 |
3 |
4 |
5 |
6 |
7 |
8 |
9 |
10 |
11 |
12 |
Pixel number
1.0 |
d. MTF |
|
|
|
|
|
|
|
|
|
|
Amplitude |
|
|
|
|
|
0.0 |
|
|
|
|
|
0 |
0.1 |
0.2 |
0.3 |
0.4 |
0.5 |
Spatial Frequency
Example 2: Blurry detector
Column
0 |
1 |
2 |
3 |
4 |
5 |
6 |
7 |
8 |
9 |
||
0 |
|
|
|
|
|
|
|
|
|
|
|
|
e. Sampling grid with |
|
|
||||||||
1 |
|
|
|
||||||||
|
|
Gaussian aperture |
|
|
|
||||||
|
|
|
|
|
|
|
|
|
|
|
|
|
|
2 |
|
|
|
|
|
|
|
|
|
|
|
|
|
3 |
|
|
|
|
|
|
|
|
|
|
|
|
|
4 |
|
|
|
|
|
|
|
|
|
|
|
|
|
Row |
|
|
|
|
|
|
|
|
|
|
|
|
|
5 |
|
|
|
|
|
|
|
|
|
|
|
|
|
6 |
|
|
|
|
|
|
|
|
|
|
|
|
|
7 |
|
|
|
|
|
|
|
|
|
|
|
|
|
8 |
|
|
|
|
|
|
|
|
|
|
|
|
|
9 |
|
|
|
|
|
|
|
|
|
|
|
|
100 |
|
|
|
|
|
|
|
|
|
|
|
|
|
|
f. Edge response |
|
|
|
|
|
|
|
||||
|
75 |
|
|
|
|
|
|
|
|
|
|
|
|
value |
50 |
|
|
|
|
|
|
|
|
|
|
|
|
Pixel |
|
|
|
|
|
|
|
|
|
|
|
|
|
|
|
|
|
|
|
|
|
|
|
|
|
|
|
|
25 |
|
|
|
|
|
|
|
|
|
|
|
|
|
0 |
|
|
|
|
|
|
|
|
|
|
|
|
|
0 |
1 |
2 |
3 |
4 |
5 |
6 |
7 |
8 |
9 |
10 |
11 |
12 |
Pixel number
|
100 |
|
|
|
|
|
|
|
|
|
|
|
|
|
|
g. Edge response |
|
|
|
|
|
|
|
||||
|
75 |
|
|
|
|
|
|
|
|
|
|
|
|
value |
50 |
|
|
|
|
|
|
|
|
|
|
|
|
Pixel |
|
|
|
|
|
|
|
|
|
|
|
|
|
|
|
|
|
|
|
|
|
|
|
|
|
|
|
|
25 |
|
|
|
|
|
|
|
|
|
|
|
|
|
0 |
|
|
|
|
|
|
|
|
|
|
|
|
|
0 |
1 |
2 |
3 |
4 |
5 |
6 |
7 |
8 |
9 |
10 |
11 |
12 |
|
|
|
|
|
|
Pixel number |
|
|
|
|
|
||
|
1.0 |
h. MTF |
|
|
|
|
|
|
|
|
|
||
|
|
|
|
|
|
|
|
|
|
|
|
|
|
Amplitude |
|
|
|
|
|
|
|
|
|
|
|
|
|
|
0.0 |
|
|
|
|
|
|
|
|
|
|
|
|
|
0 |
|
0.1 |
|
|
0.2 |
|
0.3 |
|
|
0.4 |
|
0.5 |
Spatial Frequency
FIGURE 25-6
432 |
The Scientist and Engineer's Guide to Digital Signal Processing |
completely limited by the sampling aperture, and not the sample spacing. Put another way, the sampling aperture has acted as an antialias filter, allowing lossless sampling to take place.
In comparison, the MTF curve in (d) shows that both processes are limiting the resolution of this system. The high-frequency fall-off of the MTF curve represents information lost due to the sampling aperture. Since the MTF curve has not dropped to zero before a frequency of 0.5, there is also information lost during sampling, a result of the finite sample spacing. Which is limiting the resolution more? It is difficult to answer this question with a number, since they degrade the image in different ways. Suffice it to say that the resolution in the perfect detector (example 1) is mostly limited by the sample spacing.
While these concepts may seem difficult, they reduce to a very simple rule for practical usage. Consider a system with some 10%-90% edge response distance, for example 1 mm. If the sample spacing is greater than 1 mm (there is less than one sample along the edge), the system will be limited by the sample spacing. If the sample spacing is less than 0.33 mm (there are more than 3 samples along the edge), the resolution will be limited by the sampling aperture. When a system has 1-3 samples per edge, it will be limited by both factors.
Signal-to-Noise Ratio
An object is visible in an image because it has a different brightness than its surroundings. That is, the contrast of the object (i.e., the signal) must overcome the image noise. This can be broken into two classes: limitations of the eye, and limitations of the data.
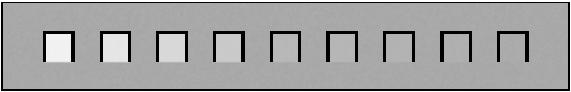
Figure 25-7 illustrates an experiment to measure the eye's ability to detect weak signals. Depending on the observation conditions, the human eye can detect a minimum contrast of 0.5% to 5%. In other words, humans can distinguish about 20 to 200 shades of gray between the blackest black and the whitest white. The exact number depends on a variety of factors, such
Contrast
50% |
40% |
30% |
20% |
10% |
8% |
5% |
3% |
1% |
FIGURE 25-7
Contrast detection. The human eye can detect a minimum contrast of about 0.5 to 5%, depending on the observation conditions. 100% contrast is the difference between pure black and pure white.