

Chapter 10
1. Explain the influence of each of the following events on the quantity of real gdp supplied and aggregate supply in India and use a graph to illustrate.
-
U.S. firms move their call handling, IT, and data functions to India.
M oving
call-handling, IT, and data functions to India increases short-run
and long-run aggregate supply because it increases the amount of
employment at full employment and (probably) also increases the
capital stock. As Figure 10.1 shows, both the short run aggregate
supply curve and long-run aggregate supply curve shift rightward,
from SAS0
to SAS1
and from LAS0
to LAS1.
oving
call-handling, IT, and data functions to India increases short-run
and long-run aggregate supply because it increases the amount of
employment at full employment and (probably) also increases the
capital stock. As Figure 10.1 shows, both the short run aggregate
supply curve and long-run aggregate supply curve shift rightward,
from SAS0
to SAS1
and from LAS0
to LAS1.
-
F
 uel
prices rise.
uel
prices rise.
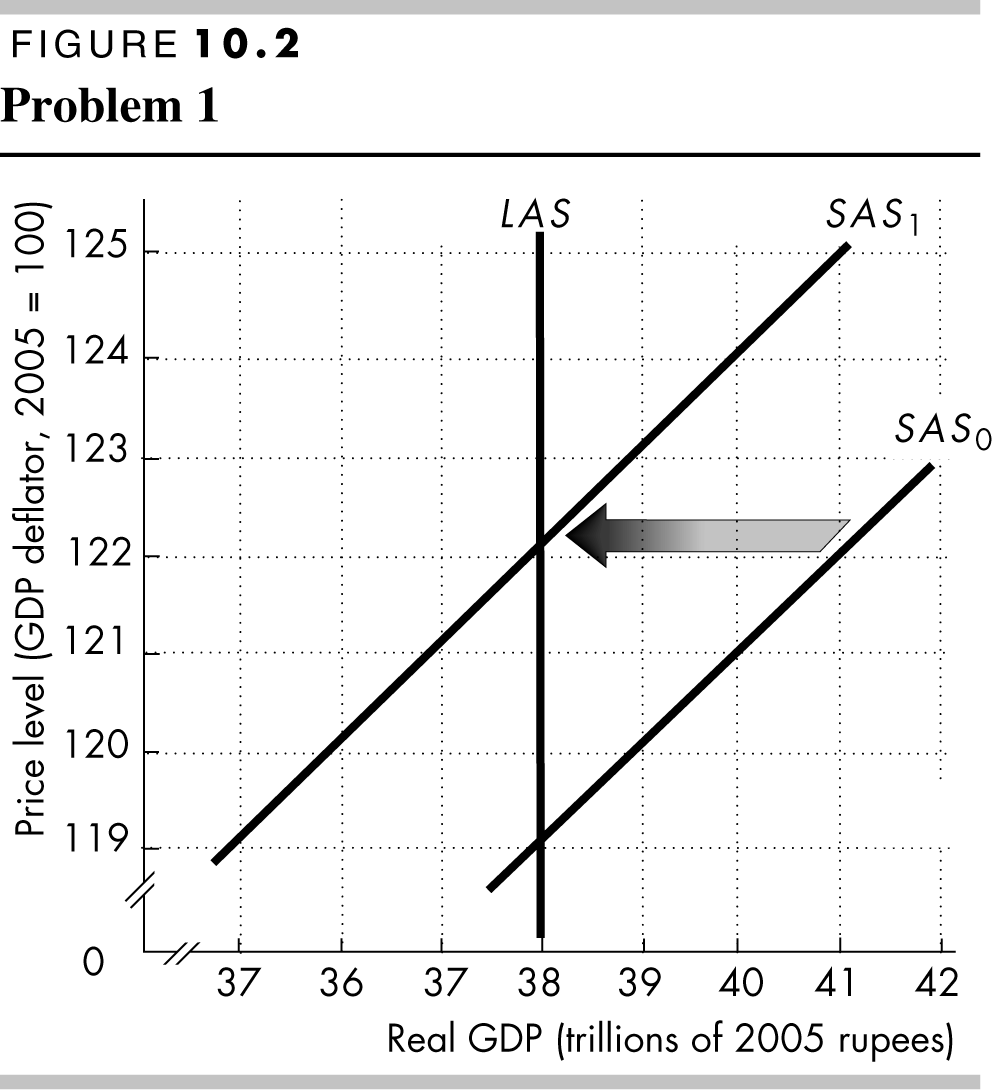
The rise in fuel prices raises firms’ costs. Short-run aggregate supply decreases and the short-run aggregate supply curve shifts leftward. Long-run aggregate supply does not change. Figure 10.2 shows the leftward shift of the short-run aggregate supply curve from SAS0 to SAS1.
-
Wal-Mart and Starbucks open in India.
When Starbucks and Wal-mart open in India, short-run and long-run aggregate supply increase. When these stores open, employment at full employment increases and India’s capital stock increases. Both the short-run and long-run aggregate supply curves shift rightward, as illustrated in Figure 10.1.
-
Universities in India increased the number of engineering graduates.
Increasing the number of engineering graduates increases India’s human capital. Both the short-run and long-run aggregate supply increases, as shown in Figure 10.1 by the rightward shifts in the short-run and long-run aggregate supply curves.
-
The money wage rate rises.
An increase in the money wage rate increases firms’ costs. Short-run aggregate supply decreases but long-run aggregate supply does not change. Long-run aggregate supply does not change because in the long run the price level rises by the same percentage the money age rate increased, so in the long run employment does not change. This situation is illustrated in Figure 10.2, in which the short-run aggregate supply curve shifts leftward and the long-run aggregate supply curve does not change.
-
T
 he
price level in India increases.
he
price level in India increases.
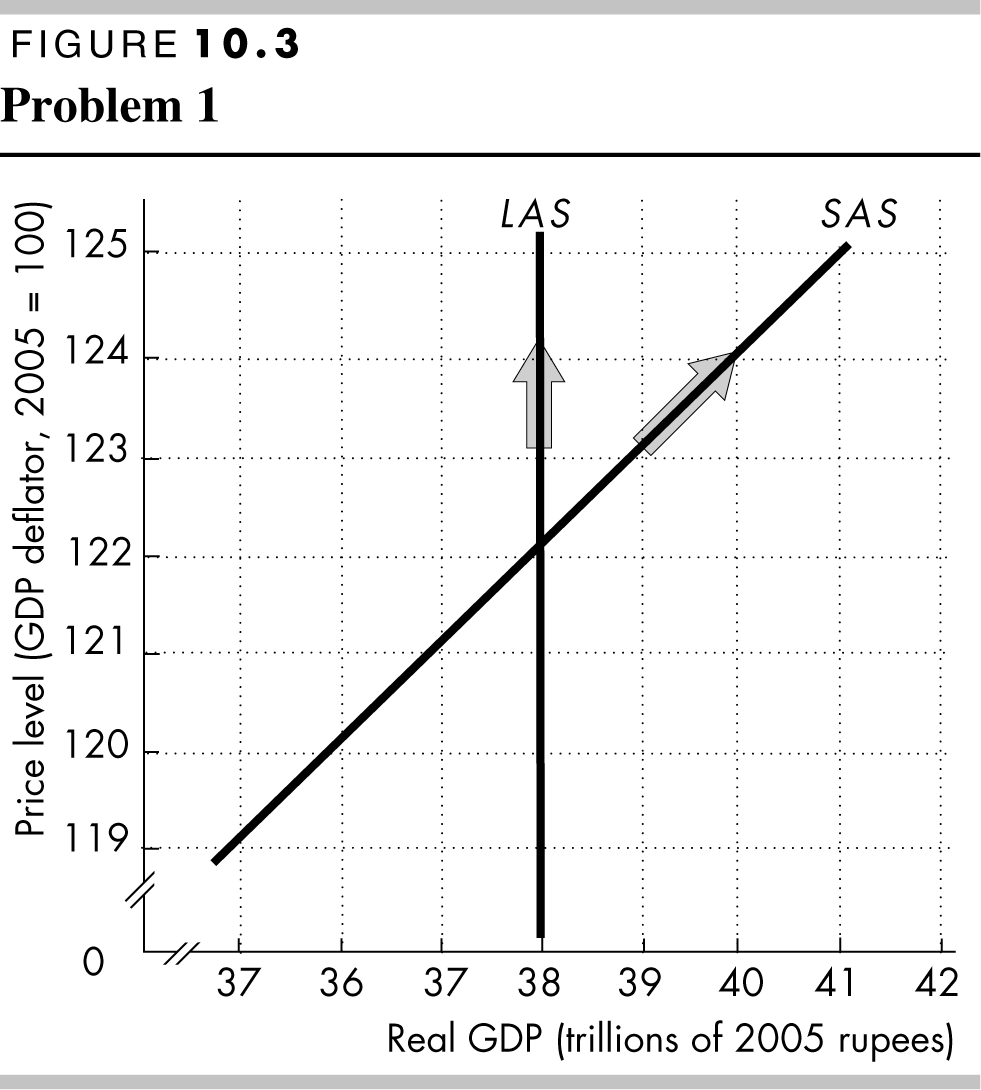
In the short run, an increase in the price level increases the quantity of real GDP demanded. In the long run, the money wage rate rises by the same percentage so in the long run there is no change in the quantity of real GDP supplied. These results are illustrated in Figure 10.3 by the grey arrows showing the movement along the short-run aggregate supply curve, SAS, and the movement along the long-run aggregate supply curve, LAS.
2. Wages Could Hit Steepest Plunge in 18 Years
A bad economy is starting to drag down wages for millions of workers. The average weekly wage has fallen 1.4% this year through September. Colorado will become the first state to lower its minimum wage since the federal minimum wage law was passed in 1938, when the state cuts its rate by 4 cents an hour.
Source: USA Today, October 16, 2009
Explain how the fall in the average weekly wage and the minimum wage will influence aggregate supply.
A fall in the average weekly wage rate increases short-run aggregate supply. However it has no effect on long-run aggregate supply because in the long run the price level will fall by the same percentage and therefore firms have no incentive to change their production. The fall in the minimum wage increases both short-run and long-run aggregate supply. The fall in the minimum wage increases employment at full employment, thereby boosting potential GDP which increases both the short-run and long-run aggregate supply. The effect from the 4¢ per hour fall in Colorado’s minimum wage, however, is likely to be miniscule.
3. Chinese Premier Wen Jiabao has warned Japan that its companies operating in China should raise pay for their workers. Explain how a rise in wages in China will influence the quantity of real GDP supplied and aggregate supply in China.
A rise in the wage paid in China decreases short-run aggregate supply because it boosts firms’ costs. In the long run, however, it will have no effect because the price level will rise by the same percentage, thereby offsetting firms’ short-run incentive to cut production.
4. Canada trades with the United States. Explain the effect of each of the following events on Canada’s aggregate demand.
-
The government of Canada cuts income taxes.
Cutting income taxes increases aggregate demand because it increases people’s disposable incomes.
-
The United States experiences strong economic growth.
Strong growth in the United States increases U.S. demand for Canadian exports. Canadian exports are a component of Canada’s aggregate demand so the increase in demand for Canada’s exports means that Canada’s aggregate demand increases.
-
Canada sets new environmental standards that require power utilities to upgrade their production facilities.
To upgrade their facilities, power utilities must increase their investment. Investment is a component of aggregate demand so an increase in investment means that Canada’s aggregate demand increases.
5. The Fed cuts the quantity of money and all other things remain the same. Explain the effect of the cut in the quantity of money on aggregate demand in the short run.
A decrease in the quantity of money decreases aggregate demand and shifts the AD curve leftward. By cutting the quantity of money, the interest rate rises, so firms decrease their investment and households cut back their expenditure on new homes, new cars, and other big-ticket items. The decrease in consumption expenditure and investment both decrease aggregate demand.
6. Mexico trades with the United States. Explain the effect of each of the following events on the quantity of real GDP demanded and aggregate demand in Mexico.
-
The United States goes into a recession.
If the United States goes into a recession, the demand for Mexican exports decreases. Exports are a component of aggregate demand, so the decrease in exports decreases Mexico’s aggregate demand.
-
The price level in Mexico rises.
The rise in the Mexican price level decreases the quantity of real GDP demanded in Mexico. There is no change in Mexico’s aggregate demand.
-
Mexico increases the quantity of money.
An increase in the quantity of money lowers the interest rate and increases consumption expenditure and investment. Mexico’s aggregate demand increases.
7. Durable Goods Orders Surge in May, New-Homes Sales Dip
The Commerce Department announced that demand for durable goods rose 1.8 percent, while new-home sales dropped 0.6 percent in May. U.S. companies suffered a sharp drop in exports as other countries struggle with recession.
Source: USA Today, June 24, 2009
Explain how the items in the news clip influence U.S. aggregate demand.
The increase in durable goods increased U.S. aggregate demand. However the fall in new home sales and in exports decreased U.S. aggregate demand.
U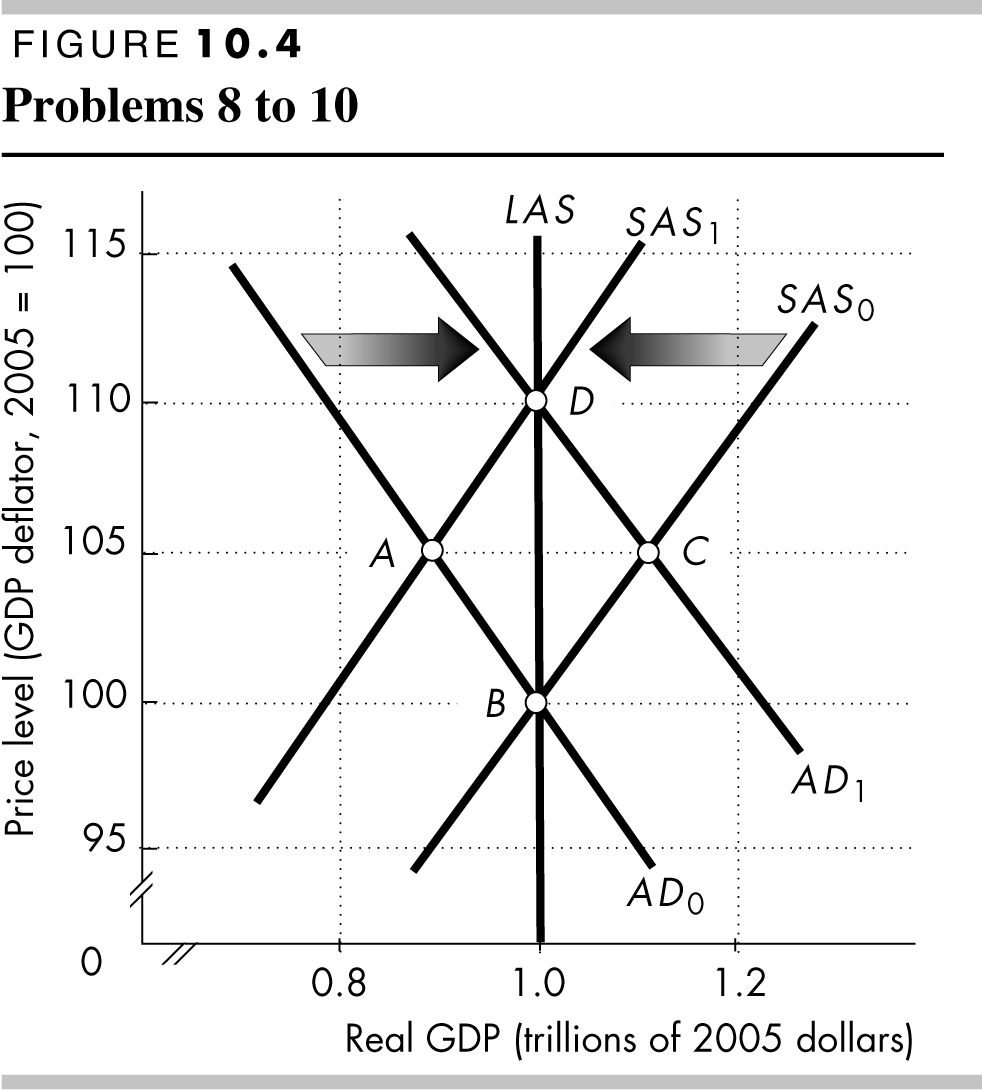 se
Figure 10.4 to work Problems 8 to 10.
se
Figure 10.4 to work Problems 8 to 10.
Initially, the short-run aggregate supply curve is SAS0 and the aggregate demand curve is AD0.
8. Some events change aggregate demand from AD0 to AD1. Describe two events that could have created this change in aggregate demand. What is the equilibrium after aggregate demand changed? If potential GDP is $1 trillion, the economy is at what the type of macroeconomic equilibrium?
Aggregate demand increases when the aggregate demand curve shifts from AD0 to AD1. Aggregate demand increases if expected future income, expected future inflation, or expected future profit increases; if the government cuts taxes, increases its expenditure on goods and services, or increases its transfer payments; if the Fed lowers the interest rate; or if the U.S. exchange rate falls or foreign income increases. After the change in aggregate demand, equilibrium is at point C: real GDP is $1.1 trillion and the price level is 105. The economy is at an above full-employment equilibrium with an inflationary gap.
9. Some events change aggregate supply from SAS0 to SAS1. Describe two events that could have created this change in aggregate supply. What is the equilibrium after aggregate supply changed? If potential GDP is $1 trillion, does the economy have an inflationary gap, a recessionary gap, or no output gap?
Aggregate supply decreases when the aggregate supply curve shifts from AS0 to AS1. Aggregate supply decreases if potential GDP decreases; if the money wage rate rises; or if the money prices of other resources rise. After the change, equilibrium is at point A: real GDP is $0.9 trillion and the price level is 105. The economy is at a below full-employment equilibrium with a recessionary gap.
10. Some events change aggregate demand from AD0 to AD1 and aggregate supply from SAS0 to SAS1. What is the new macroeconomic equilibrium?
After the changes, equilibrium is at point D: real GDP is $1.0 trillion and the price level is 110. The economy is at a full-employment equilibrium.
Use the following data to work Problems 11 to 13.
The following events have occurred in the history of the United States:
-
A deep recession hits the world economy.
-
The world oil price rises sharply.
-
U.S. businesses expect future profits to fall.
11. Explain for each event whether it changes short-run aggregate supply, long-run aggregate supply, aggregate demand, or some combination of them.
A deep recession in the world economy decreases aggregate demand. A sharp rise in oil prices decreases short-run aggregate supply. The expectation of lower future profits decreases investment and decreases aggregate demand.
12. Explain the separate effects of each event on U.S. real GDP and the price level, starting from a
position of long-run equilibrium.
A deep recession in the world economy decreases aggregate demand, which decreases real GDP and lowers the price level. A sharp rise in oil prices decreases short-run aggregate supply, which decreases real GDP and raises the price level. The expectation of lower future profits decreases investment and decreases aggregate demand, which decreases real GDP and lowers the price level.
13. Explain the combined effects of these events on U.S. real GDP and the price level, starting from a position of long-run equilibrium.
The combined effect of a deep recession in the world economy, a sharp rise in oil prices, and the expectation of lower future profits decreases both aggregate demand and short-run aggregate supply, which decreases real GDP and the price level rises, falls, or remains the same.
Use the following data to work Problems 14 and 15.
|
Price level |
Real GDP demanded |
Real GDP supplied in the short run |
|
(billions of 2005 dollars) |
||
|
100 |
1,150 |
1,050 |
|
110 |
1,100 |
1,100 |
|
120 |
1,050 |
1,150 |
|
130 |
1,000 |
1,200 |
|
140 |
950 |
1,250 |
|
150 |
900 |
1,300 |
|
160 |
850 |
1,350 |
14. What is the short-run equilibrium real GDP and price level?
The short-run equilibrium real GDP and price level are determined by the price level that sets the quantity of real GDP demanded equal to the quantity of real GDP supplied in the short run. From the table, the short-run equilibrium real GDP is $1,100 billion and the price level is 110.
15. Does the country have an inflationary gap or a recessionary gap and what is its magnitude?
Equilibrium real GDP exceeds potential GDP, so the country has an inflationary gap. The inflationary gap equals the difference between real GDP and potential GDP, which is $50 billion.
16. Geithner Urges Action on Economy
 Treasury
Secretary Timothy Geithner is reported as having said that the United
States can no longer rely on consumer spending to be the growth
engine of recovery from recession. Washington needs to plant the
seeds for business investment and exports. “We can’t go back to a
situation where we’re depending on a near short-term boost in
consumption to carry us forward,” he said.
Treasury
Secretary Timothy Geithner is reported as having said that the United
States can no longer rely on consumer spending to be the growth
engine of recovery from recession. Washington needs to plant the
seeds for business investment and exports. “We can’t go back to a
situation where we’re depending on a near short-term boost in
consumption to carry us forward,” he said.
Source: The Wall Street Journal, September 12, 2010
a. Explain the effects of an increase in consumer spending on the short-run macroeconomic equilibrium.
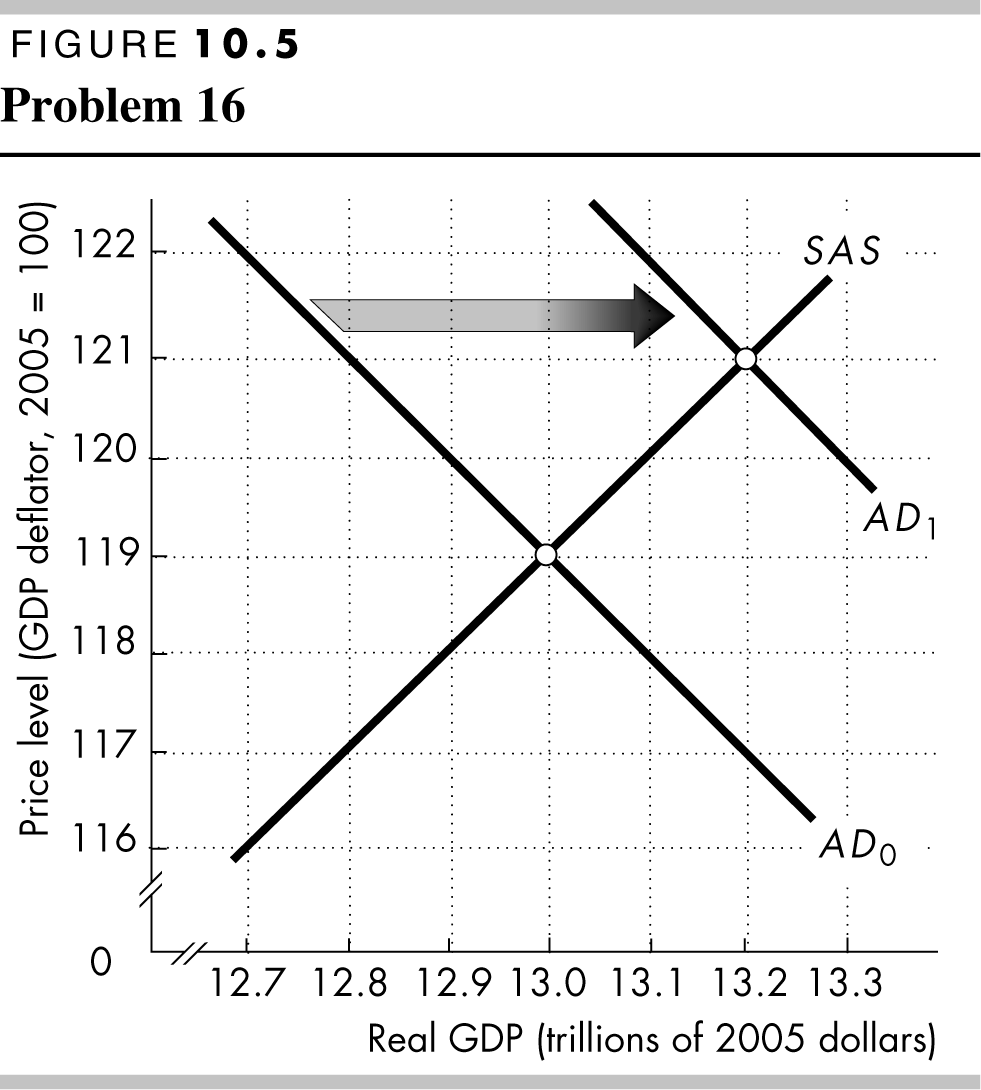
Consumption expenditure is part of aggregate demand, so an increase in consumer expenditure increases aggregate demand and shifts the aggregate demand curve rightward. As illustrated in Figure 10.5, the rightward shift of the aggregate demand curve from AD0 to AD1 increases real GDP and raises the price level.
b. Explain the effects of an increase in business investment on the short-run macroeconomic equilibrium.
Investment is part of aggregate demand, so an increase in investment increases aggregate demand and shifts the aggregate demand curve rightward. As illustrated in Figure 10.5, the rightward shift of the aggregate demand curve from AD0 to AD1 increases real GDP and raises the price level.
c. Explain the effects of an increase in exports on the short-run macroeconomic equilibrium.
Exports are part of aggregate demand, so an increase in exports increases aggregate demand and shifts the aggregate demand curve rightward. As illustrated in Figure 10.5, the rightward shift of the aggregate demand curve from AD0 to AD1 increases real GDP and raises the price level.
17. Describe what a classical macroeconomist, a Keynesian, and a monetarist would want to do in response to each of the events listed in Problem 11.
Classical and monetarist economists probably would recommend no policy action for all three of the events. If they suggested any policy at all, the policy would involve cutting taxes. A Keynesian economist likely would suggest several policies for all three events, such as the U.S. government should increase aggregate demand by increasing its expenditure on goods and services or by cutting taxes. The Keynesian economist also would suggest that the Fed should increase the quantity of money and lower interest rates.
18. Adding Up the Cost of Obama’s Agenda
When campaigning, Barack Obama has made a long list of promises for new federal programs costing tens of billions of dollars. Obama has said he would strengthen the nation’s bridges and dams ($6 billion a year), extend health insurance to more people (part of a $65-billion-a-year health plan), develop cleaner energy sources ($15 billion a year), curb home foreclosures ($10 billion in one-time spending) and add $18 billion a year to education spending. In total a $50-billion plan to stimulate the economy through increased government spending. A different blueprint offered by McCain proposes relatively little new spending and tax cuts as a more effective means of solving problems.
Source: Los Angeles Times, July 8, 2008
a. Based upon this news clip, explain what macroeconomic school of thought Barack Obama most likely follows.
Mr. Obama most likely follows the Keynesian (or new Keynesian) approach because he is making proposals that increase aggregate demand to offset the recessionary economy.
b. Based upon this news clip, explain what macroeconomic school of thought John McCain most likely follows.
Mr. McCain most likely follows the classical (or new classical) approach because he believes that the private sector, aided by tax cuts, should handle the recessionary economy.