

14.3. Gas turbine engine starting diagram. Characteristic of start stages
The starting diagram is the dependence of three torque on starting engine rotor rotational speed. They are :
- the torque, which is transmitted to the rotor by starter MSD = f1(n);
- the rotor antitorque moment MR = f2(n);
- the turbine rotor torque after main fuel ignition MT = f3(n);
The diagram is given in Fig. 14.3.
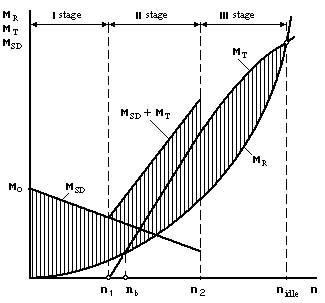
Fig. 14.3. Gas turbine engine starting diagram
There are three typical stages in the starting diagram.
The first is the stage of dry motoring by starter.
The second is accompanied stage. At the beginning of this period when n = n1 the main fuel is ignited in combustion chamber. After this the gas temperature in the turbine inlet T*g increases, and positive torque appears on turbine rotor MT. Engine rotor is driven up from two energy sources – turbine and starter, which works at turbine accompanied mode during the second stage.
In the middle of the second stage there is a typical rotational speed nb, at which MT = MR, in other words, there is a dynamic balance of the engine rotor. But the starter can not be turned off at this rotational speed, because the balance is unstable and any accidental deviation of rotational speed from nb will cause engine stop or rotor driving up with possible “hot holdup”. Starter is turned off at rotational speed n2, when there is a big enough redundant moment M = MT – MR on turbine rotor, under action of which the turbine can itself turn the engine out to the idle at a small time in conditions of units stable work.
The third stage provides self-dependent engine turning out to the idle under the action of the turbine redundant moment. At the end of this stage at n = nidle there is a stable dynamic rotor balance (MT = MR). At any deviation from balance the automatic return to the rotational speed nidle will be provided under the action of torque difference M = MT – MR of the corresponding direction.
Typical rotational speeds at starting diagram are defined with the help of statistic data (Tab. 14.1) on the basis of the GTE starting processes analysis.
Table 14.1 Typical rotational speeds of gte rotor
|
Relative rotational speeds of engine rotor |
Engine types | |||||
|
TJE |
TFE (m<1,5) |
TFE (m>1,5) |
One-shaft TPE |
Free turbine TShE |
APU | |
|
n1/nmax |
0,08…0,12 |
0,15…0,20 |
0,15…0,20 |
0,14…0,18 |
0,13…0,17 |
0,15…0,20 |
|
nb/nmax |
0,12…0,18 |
0,20…0,25 |
0,23…0,27 |
0,17…0,22 |
0,20…0,25 |
0,15…0,22 |
|
n2/nmax |
0,22…0,26 |
0,40…0,45 |
0,40…0,45 |
0,35…0,50 |
0,45…0,65 |
0,30…0,35 |
|
nidle/nmax |
0,3…0,4 |
0,50…0,60 |
0,55…0,65 |
0,70…0,94 |
0,60…0,75 |
– |
When the engine is started, fuel is dosed in such a way that the gas temperature in the turbine inlet T*g did not exceed the limits which depend on compressor gas-dynamic stability and turbine rotor details strength (Fig. 14.4). During the GTE starting the T*g temperature excess may be 180…200 K.