

Chapter 1
Organization and description of data
1.1. Introduction
Statistics is a group of methods that are used to collect, analyse, present, interpret data and make decisions.
Statistics is sometimes divided into two main areas:
1. Descriptive statistics
2. Inferential statistics.
Descriptive statistics consists of the collection, organization, summation, and presentation of data.
A population is a complete set of units (usually people, objects, events) that we are interested in studying.
A subset of the population selected for study is called a sample.
Inferential statistics is an estimate or prediction about a population based on information contained in a sample.
1.2. The mean
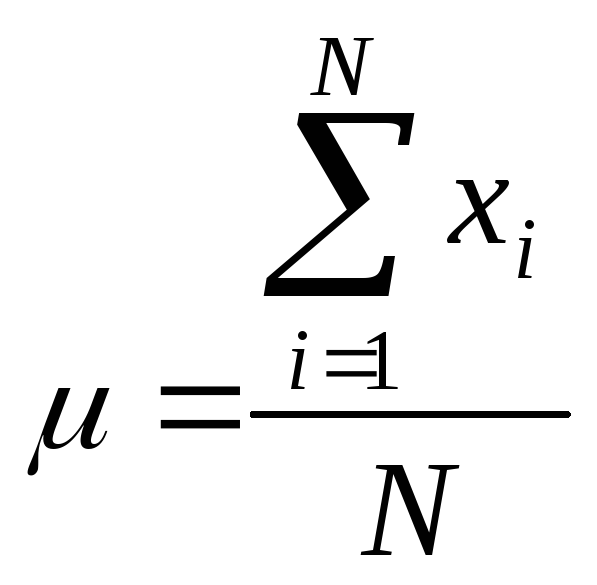
The mean for ungrouped data, also known as the arithmetic average, is found by adding the values of the data and dividing by the total number of values. Thus,
Mean
for population data: 
Mean
for sample data: 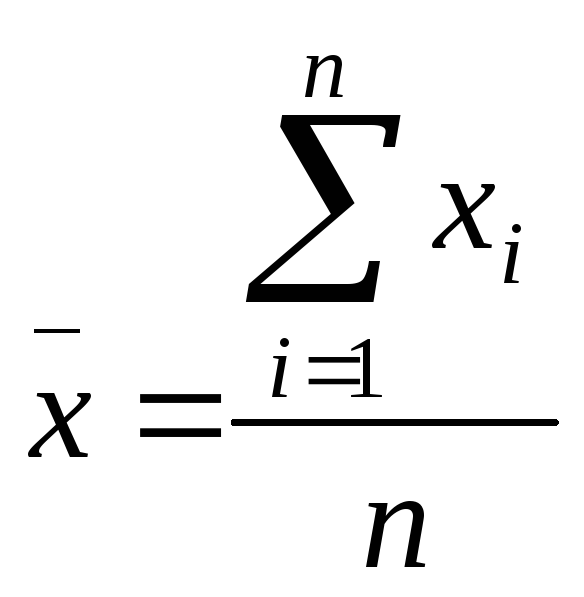
where
![]() is
the population size,
is
the population size, ![]() is
sample size,
is
sample size, ![]() (Greek
letter mu) is the population mean, and
(Greek
letter mu) is the population mean, and ![]() (read
as “
(read
as “![]() -bar
”) is the sample mean.
-bar
”) is the sample mean.
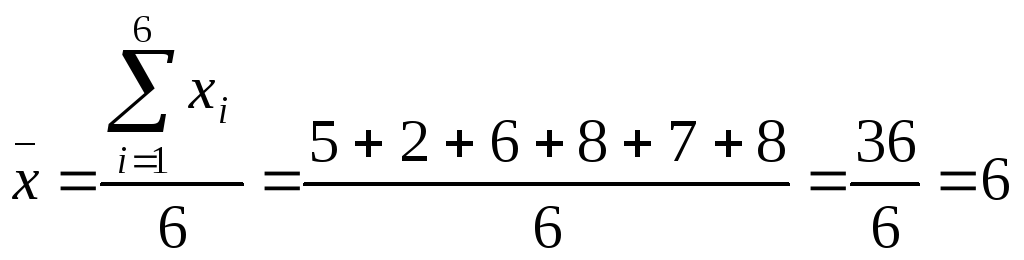
Example:
Calculate the mean of the following six sample observations:
5, 2, 6, 8, 7, 8
Solution:
Using the definition of sample mean, we find
 .
.
Thus, the mean of this sample is 6.
Example:
The salaries of all 7 employees of a small company are:
$ 320, 410, 310, 480, 530, 370, 240
Find the mean salary.
Solution:
Since the
given data set includes all 7 employees of the company, it represents
the population. Hence, ![]() .
The population mean is
.
The population mean is
![]() .
.
Thus, the mean salary of the employees of this company is $380.
1.3. The median
The median is the middle term in a data set. Before one can find this point the data must be arranged in increasing (or decreasing) order. The calculation of the median for ungrouped data consists of the following two steps:
1. Rank the given data set in increasing (or decreasing) order.
2.
Find ![]() term
in a ranked data set.
term
in a ranked data set.
The
value of ![]() term
is the median.
term
is the median.
There are two possibilities
1)
If ![]() is
odd, then the median is given by the value of the middle term in a
ranked data.
is
odd, then the median is given by the value of the middle term in a
ranked data.
2)
If ![]() is
even, then the median is given by the average of the values of the
two middle term.
is
even, then the median is given by the average of the values of the
two middle term.
Remark:
If the given data set represents a population, replace ![]() by
by
![]() .
.
Example:
Consider again the seven salaries of employees of a small company
$ 320, 410, 310, 480, 530, 370, 240
Calculate the median of this population.
Solution:
First of all, let us rank salaries in ascending order:
$ 240, 310, 320, 370, 410, 480, 530
N=7
and ![]()
Therefore, the median is the value of the fourth term in the ranked data
$ 240, 310, 320, 370 , 410, 480, 530

Thus, the median value for this population is $370.
Example:
The ages of a sample of 10 university students are
18, 22, 19, 20, 21, 18, 22, 19, 23, 17
Calculate the median of this sample.
Solution:
First we order the data in increasing order. The ordered vales are
17, 18, 18, 19, 19, 20, 21, 22, 22, 23
There are 10 values in the data set. Hence,
![]() and
and ![]()
Therefore, the median is given by the mean of fifth and sixth values in the ranked data.
![]() ,
,
![]()
![]() .
.
Hence, the median age is 19.5.