

Книги фарма 2 / Bertram G. Katzung-Basic & Clinical Pharmacology(9th Edition)
.pdfReceptor Classes & Drug Development
The existence of a specific drug receptor is usually inferred from studying the structure-activity relationship of a group of structurally similar congeners of the drug that mimic or antagonize its effects. Thus, if a series of related agonists exhibits identical relative potencies in producing two distinct effects, it is likely that the two effects are mediated by similar or identical receptor molecules. In addition, if identical receptors mediate both effects, a competitive antagonist will inhibit both responses with the same KI; a second competitive antagonist will inhibit both responses with its own characteristic KI. Thus, studies of the relation between structure and activity of a series of agonists and antagonists can identify a species of receptor that mediates a set of pharmacologic responses.
Exactly the same experimental procedure can show that observed effects of a drug are mediated by different receptors. In this case, effects mediated by different receptors may exhibit different orders of potency among agonists and different KI values for each competitive antagonist.
Wherever we look, evolution has created many different receptors that function to mediate responses to any individual chemical signal. In some cases, the same chemical acts on completely different structural receptor classes. For example, acetylcholine uses ligand-gated ion channels (nicotinic AChRs) to initiate a fast excitatory postsynaptic potential (EPSP) in postganglionic neurons. Acetylcholine also activates a separate class of G protein–coupled receptors (muscarinic AChRs), which modulate responsiveness of the same neurons to the fast EPSP. In addition, each structural class usually includes multiple subtypes of receptor, often with significantly different signaling or regulatory properties. For example, norepinephrine activates many structurally related receptors, including  -adrenergic (stimulation of Gs, increased heart rate),
 1-adrenergic (stimulation of Gq, vasoconstriction), and
 2-adrenergic (stimulation of Gi, opening of K+ channels) (see Table 2–2). The existence of multiple receptor classes and subtypes for the same endogenous ligand has created important opportunities for drug development. For example, propranolol, a selective antagonist of
  -adrenergic receptors, can reduce an accelerated heart rate without preventing the sympathetic nervous system from causing vasoconstriction, an effect mediated by
 1 receptors.
The principle of drug selectivity may even apply to structurally identical receptors expressed in different cells, eg, receptors for steroids such as estrogen (Figure 2–6). Different cell types express different accessory proteins, which interact with steroid receptors and change the functional effects of drug-receptor interaction. For example, tamoxifen acts as an antagonist on estrogen receptors expressed in mammary tissue but as an agonist on estrogen receptors in bone. Consequently, tamoxifen may be useful not only in the treatment and prophylaxis of breast cancer but also in the prevention of osteoporosis by increasing bone density (see Chapter 40: The Gonadal Hormones & Inhibitors and Chapter 42: Agents That Affect Bone Mineral Homeostasis). Tamoxifen may also create complications in postmenopausal women, however, by exerting an agonist action in the uterus, stimulating endometrial cell proliferation.
New drug development is not confined to agents that act on receptors for extracellular chemical signals. Pharmaceutical chemists are now determining whether elements of signaling pathways distal to the receptors may also serve as targets of selective and useful drugs. For example, clinically useful agents might be developed that act selectively on specific G proteins, kinases, phosphatases, or the enzymes that degrade second messengers.
Relation between Drug Dose & Clinical Response
We have dealt with receptors as molecules and shown how receptors can quantitatively account for the relation between dose or concentration of a drug and pharmacologic responses, at least in an idealized system. When faced with a patient who needs treatment, the prescriber must make a choice among a variety of possible drugs and devise a dosage regimen that is likely to produce maximal benefit and minimal toxicity. In order to make rational therapeutic decisions, the prescriber must understand how drug-receptor interactions underlie the relations between dose and response in patients, the nature and causes of variation in pharmacologic responsiveness, and the clinical implications of selectivity of drug action.
Dose & Response in Patients
Graded Dose-Response Relations
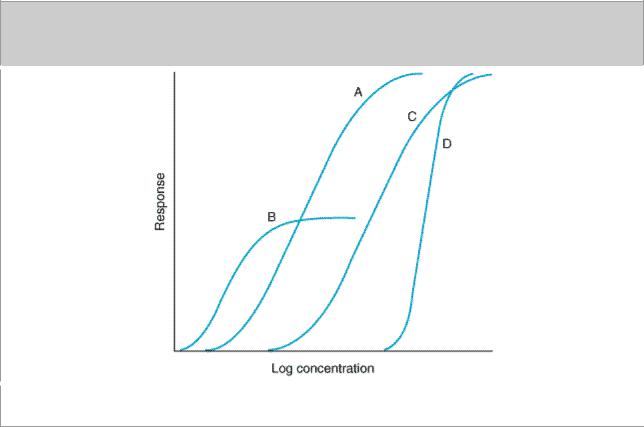
To choose among drugs and to determine appropriate doses of a drug, the prescriber must know the relative pharmacologic potency and maximal efficacy of the drugs in relation to the desired therapeutic effect. These two important terms, often confusing to students and clinicians, can be explained by refering to Figure 2–15, which depicts graded dose-response curves that relate dose of four different drugs to the magnitude of a particular therapeutic effect.
Figure 2–15.
Graded dose-response curves for four drugs, illustrating different pharmacologic potencies and different maximal efficacies. (See text.)
Potency
Drugs A and B are said to be more potent than drugs C and D because of the relative positions of their dose-response curves along the dose axis of Figure 2–15. Potency refers to the concentration (EC50) or dose (ED50) of a drug required to produce 50% of that drug's maximal effect. Thus, the pharmacologic potency of drug A in Figure 2–15 is less than that of drug B, a partial agonist,

because the EC50 of A is greater than the EC50 of B. Potency of a drug depends in part on the affinity (KD) of receptors for binding the drug and in part on the efficiency with which drugreceptor interaction is coupled to response. Note that some doses of drug A can produce larger effects than any dose of drug B, despite the fact that we describe drug B as pharmacologically more potent. The reason for this is that drug A has a larger maximal efficacy, as described below.
For clinical use, it is important to distinguish between a drug's potency and its efficacy. The clinical effectiveness of a drug depends not on its potency (EC50), but on its maximal efficacy (see below) and its ability to reach the relevant receptors. This ability can depend on its route of administration, absorption, distribution through the body, and clearance from the blood or site of action. In deciding which of two drugs to administer to a patient, the prescriber must usually consider their relative effectiveness rather than their relative potency. Pharmacologic potency can largely determine the administered dose of the chosen drug.
For therapeutic purposes, the potency of a drug should be stated in dosage units, usually in terms of a particular therapeutic end point (eg, 50 mg for mild sedation, 1  g/kg/min for an increase in heart rate of 25 beats/min). Relative potency, the ratio of equi-effective doses (0.2, 10, etc), may be used in comparing one drug with another.
Maximal Efficacy
This parameter reflects the limit of the dose-response relation on the response axis. Drugs A, C, and D in Figure 2–15 have equal maximal efficacy, while all have greater maximal efficacy than drug B. The maximal efficacy (sometimes referred to simply as efficacy) of a drug is obviously crucial for making clinical decisions when a large response is needed. It may be determined by the drug's mode of interactions with receptors (as with partial agonists, described above)* or by characteristics of the receptor-effector system involved.
* Note that "maximal efficacy," used in a therapeutic context, does not have exactly the same meaning the term denotes in the more specialized context of drug-receptor interactions described earlier in this chapter. In an idealized in vitro system, efficacy denotes the relative maximal efficacy of agonists and partial agonists that act via the same receptor. In therapeutics, efficacy denotes the extent or degree of an effect that can be achieved in the intact patient. Thus, therapeutic efficacy may be affected by the characteristics of a particular drug-receptor interaction, but it also depends on a host of other factors as noted in the text.
Thus, diuretics that act on one portion of the nephron may produce much greater excretion of fluid and electrolytes than diuretics that act elsewhere. In addition, the practical efficacy of a drug for achieving a therapeutic end point (eg, increased cardiac contractility) may be limited by the drug's propensity to cause a toxic effect (eg, fatal cardiac arrhythmia) even if the drug could otherwise produce a greater therapeutic effect.
Shape of Dose-Response Curves
While the responses depicted in curves A, B, and C of Figure 2–15 approximate the shape of a simple Michaelis-Menten relation (transformed to a logarithmic plot), some clinical responses do not. Extremely steep dose-response curves (eg, curve D) may have important clinical consequences if the upper portion of the curve represents an undesirable extent of response (eg, coma caused by a sedative-hypnotic). Steep dose-response curves in patients could result from cooperative interactions of several different actions of a drug (eg, effects on brain, heart, and peripheral vessels, all contributing to lowering of blood pressure).
Quantal Dose-Effect Curves
Graded dose-response curves of the sort described above have certain limitations in their application to clinical decision making. For example, such curves may be impossible to construct if the pharmacologic response is an either-or (quantal) event, such as prevention of convulsions, arrhythmia, or death. Furthermore, the clinical relevance of a quantitative dose-response relationship in a single patient, no matter how precisely defined, may be limited in application to other patients, owing to the great potential variability among patients in severity of disease and responsiveness to drugs.
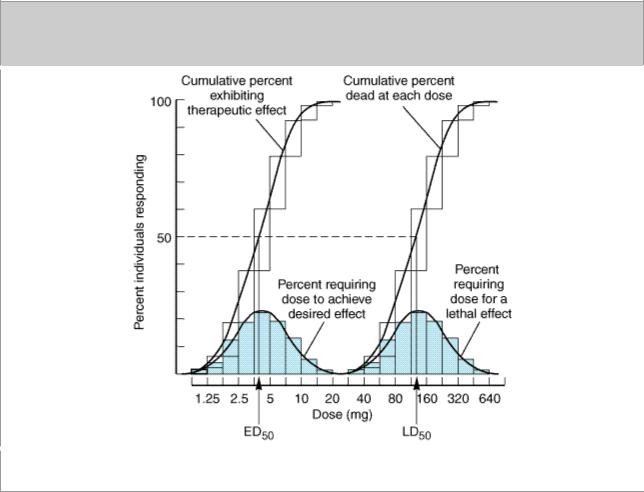
Some of these difficulties may be avoided by determining the dose of drug required to produce a specified magnitude of effect in a large number of individual patients or experimental animals and plotting the cumulative frequency distribution of responders versus the log dose (Figure 2–16). The specified quantal effect may be chosen on the basis of clinical relevance (eg, relief of headache) or for preservation of safety of experimental subjects (eg, using low doses of a cardiac stimulant and specifying an increase in heart rate of 20 beats/min as the quantal effect), or it may be an inherently quantal event (eg, death of an experimental animal). For most drugs, the doses required to produce a specified quantal effect in individuals are lognormally distributed; ie, a frequency distribution of such responses plotted against the log of the dose produces a gaussian normal curve of variation (colored area, Figure 2–16). When these responses are summated, the resulting cumulative frequency distribution constitutes a quantal dose-effect curve (or dose-percent curve) of the proportion or percentage of individuals who exhibit the effect plotted as a function of log dose (Figure 2–16).
Figure 2–16.
Quantal dose-effect plots. Shaded boxes (and the accompanying curves) indicate the frequency distribution of doses of drug required to produce a specified effect; ie, the percentage of animals

that required a particular dose to exhibit the effect. The open boxes (and the corresponding curves) indicate the cumulative frequency distribution of responses, which are lognormally distributed.
The quantal dose-effect curve is often characterized by stating the median effective dose (ED50), the dose at which 50% of individuals exhibit the specified quantal effect. (Note that the abbreviation ED50 has a different meaning in this context from its meaning in relation to graded dose-effect curves, described above.) Similarly, the dose required to produce a particular toxic effect in 50% of animals is called the median toxic dose (TD50) If the toxic effect is death of the animal, a median lethal dose (LD50) may be experimentally defined. Such values provide a convenient way of comparing the potencies of drugs in experimental and clinical settings: Thus, if the ED50s of two drugs for producing a specified quantal effect are 5 and 500 mg, respectively, then the first drug can be said to be 100 times more potent than the second for that particular effect. Similarly, one can obtain a valuable index of the selectivity of a drug's action by comparing its ED50s for two different quantal effects in a population (eg, cough suppression versus sedation for opioid drugs).
Quantal dose-effect curves may also be used to generate information regarding the margin of safety to be expected from a particular drug used to produce a specified effect. One measure, which relates the dose of a drug required to produce a desired effect to that which produces an undesired effect, is the therapeutic index. In animal studies, the therapeutic index is usually defined as the ratio of the TD50 to the ED50 for some therapeutically relevant effect. The precision possible in animal experiments may make it useful to use such a therapeutic index to estimate the potential benefit of a drug in humans. Of course, the therapeutic index of a drug in humans is almost never known with real precision; instead, drug trials and accumulated clinical experience often reveal a range of usually effective doses and a different (but sometimes overlapping) range of possibly toxic doses. The clinically acceptable risk of toxicity depends critically on the severity of the disease being treated. For example, the dose range that provides relief from an ordinary headache in the great majority of patients should be very much lower than the dose range that produces serious toxicity, even if the toxicity occurs in a small minority of patients. However, for treatment of a lethal disease such as Hodgkin's lymphoma, the acceptable difference between therapeutic and toxic doses may be smaller.
Finally, note that the quantal dose-effect curve and the graded dose-response curve summarize somewhat different sets of information, although both appear sigmoid in shape on a semilogarithmic plot (compare Figures 2–15 and 2–16). Critical information required for making rational therapeutic decisions can be obtained from each type of curve. Both curves provide information regarding the potency and selectivity of drugs; the graded dose-response curve indicates the maximal efficacy of a drug, and the quantal dose-effect curve indicates the potential variability of responsiveness among individuals.
Variation in Drug Responsiveness
Individuals may vary considerably in their responsiveness to a drug; indeed, a single individual may respond differently to the same drug at different times during the course of treatment. Occasionally, individuals exhibit an unusual or idiosyncratic drug response, one that is infrequently observed in most patients. The idiosyncratic responses are usually caused by genetic differences in metabolism of the drug or by immunologic mechanisms, including allergic reactions.
Quantitative variations in drug response are in general more common and more clinically important. An individual patient is hyporeactive or hyperreactive to a drug in that the intensity of effect of a given dose of drug is diminished or increased in comparison to the effect seen in most individuals.
(Note: The term hypersensitivity usually refers to allergic or other immunologic responses to

drugs.) With some drugs, the intensity of response to a given dose may change during the course of therapy; in these cases, responsiveness usually decreases as a consequence of continued drug administration, producing a state of relative tolerance to the drug's effects. When responsiveness diminishes rapidly after administration of a drug, the response is said to be subject to tachyphylaxis.
Even before administering the first dose of a drug, the prescriber should consider factors that may help in predicting the direction and extent of possible variations in responsiveness. These include the propensity of a particular drug to produce tolerance or tachyphylaxis as well as the effects of age, sex, body size, disease state, genetic factors, and simultaneous administration of other drugs.
Four general mechanisms may contribute to variation in drug responsiveness among patients or within an individual patient at different times.
Alteration in Concentration of Drug That Reaches the Receptor
Patients may differ in the rate of absorption of a drug, in distributing it through body compartments, or in clearing the drug from the blood (see Chapter 3: Pharmacokinetics & Pharmacodynamics: Rational Dosing & the Time Course of Drug Action). By altering the concentration of drug that reaches relevant receptors, such pharmacokinetic differences may alter the clinical response. Some differences can be predicted on the basis of age, weight, sex, disease state, liver and kidney function, and by testing specifically for genetic differences that may result from inheritance of a functionally distinctive complement of drug-metabolizing enzymes (see Chapter 3: Pharmacokinetics & Pharmacodynamics: Rational Dosing & the Time Course of Drug Action and Chapter 4: Drug Biotransformation).
Variation in Concentration of an Endogenous Receptor Ligand
This mechanism contributes greatly to variability in responses to pharmacologic antagonists. Thus, propranolol, a  -adrenoceptor antagonist, will markedly slow the heart rate of a patient whose endogenous catecholamines are elevated (as in pheochromocytoma) but will not affect the resting heart rate of a well-trained marathon runner. A partial agonist may exhibit even more dramatically different responses: Saralasin, a weak partial agonist at angiotensin II receptors, lowers blood pressure in patients with hypertension caused by increased angiotensin II production and raises blood pressure in patients who produce small amounts of angiotensin.
Alterations in Number or Function of Receptors
Experimental studies have documented changes in drug responsiveness caused by increases or decreases in the number of receptor sites or by alterations in the efficiency of coupling of receptors to distal effector mechanisms. In some cases, the change in receptor number is caused by other hormones; for example, thyroid hormones increase both the number of  receptors in rat heart muscle and cardiac sensitivity to catecholamines. Similar changes probably contribute to the tachycardia of thyrotoxicosis in patients and may account for the usefulness of propranolol, a
 - adrenoceptor antagonist, in ameliorating symptoms of this disease.
In other cases, the agonist ligand itself induces a decrease in the number (eg, down-regulation) or coupling efficiency (eg, desensitization) of its receptors. These mechanisms (discussed above, under Signaling Mechanisms & Drug Actions) may contribute to two clinically important phenomena: first, tachyphylaxis or tolerance to the effects of some drugs (eg, biogenic amines and their congeners), and second, the "overshoot" phenomena that follow withdrawal of certain drugs. These

phenomena can occur with either agonists or antagonists. An antagonist may increase the number of receptors in a critical cell or tissue by preventing down-regulation caused by an endogenous agonist. When the antagonist is withdrawn, the elevated number of receptors can produce an exaggerated response to physiologic concentrations of agonist. Potentially disastrous withdrawal symptoms can result for the opposite reason when administration of an agonist drug is discontinued. In this situation, the number of receptors, which has been decreased by drug-induced downregulation, is too low for endogenous agonist to produce effective stimulation. For example, the withdrawal of clonidine (a drug whose 
 2-adrenoceptor agonist activity reduces blood pressure) can produce hypertensive crisis, probably because the drug down-regulates
 2-adrenoceptors (see Chapter 11: Antihypertensive Agents).
Genetic factors also can play an important role in altering the number or function of specific receptors. For example, a specific genetic variant of the 
 2C-adrenoceptor—when inherited together with a specific variant of the
  1-adrenoceptor—confers a greatly increased risk for developing congestive heart failure which may be reduced by early intervention using antagonist drugs. The identification of such genetic factors, part of the rapidly developing field of pharmacogenetics, holds exciting promise for clinical diagnosis and may help physicians design the most appropriate pharmacologic therapy for individual patients.
Changes in Components of Response Distal to the Receptor
Although a drug initiates its actions by binding to receptors, the response observed in a patient depends on the functional integrity of biochemical processes in the responding cell and physiologic regulation by interacting organ systems. Clinically, changes in these postreceptor processes represent the largest and most important class of mechanisms that cause variation in responsiveness to drug therapy.
Before initiating therapy with a drug, the prescriber should be aware of patient characteristics that may limit the clinical response. These characteristics include the age and general health of the patient and—most importantly—the severity and pathophysiologic mechanism of the disease. The most important potential cause of failure to achieve a satisfactory response is that the diagnosis is wrong or physiologically incomplete. Drug therapy will always be most successful when it is accurately directed at the pathophysiologic mechanism responsible for the disease.
When the diagnosis is correct and the drug is appropriate, an unsatisfactory therapeutic response can often be traced to compensatory mechanisms in the patient that respond to and oppose the beneficial effects of the drug. Compensatory increases in sympathetic nervous tone and fluid retention by the kidney, for example, can contribute to tolerance to antihypertensive effects of a vasodilator drug. In such cases, additional drugs may be required to achieve a useful therapeutic response.
Clinical Selectivity: Beneficial Versus Toxic Effects of Drugs
Although we classify drugs according to their principal actions, it is clear that no drug causes only a single, specific effect. Why is this so? It is exceedingly unlikely that any kind of drug molecule will bind to only a single type of receptor molecule, if only because the number of potential receptors in every patient is astronomically large. Even if the chemical structure of a drug allowed it to bind to only one kind of receptor, the biochemical processes controlled by such receptors would take place in multiple cell types and would be coupled to many other biochemical functions; as a result, the patient and the prescriber would probably perceive more than one drug effect. Accordingly, drugs are only selective—rather than specific—in their actions, because they bind to one or a few types of

receptor more tightly than to others and because these receptors control discrete processes that result in distinct effects.
It is only because of their selectivity that drugs are useful in clinical medicine. Selectivity can be measured by comparing binding affinities of a drug to different receptors or by comparing ED50s for different effects of a drug in vivo. In drug development and in clinical medicine, selectivity is usually considered by separating effects into two categories: beneficial or therapeutic effects versus toxic effects. Pharmaceutical advertisements and prescribers occasionally use the term side effect, implying that the effect in question is insignificant or occurs via a pathway that is to one side of the principal action of the drug; such implications are frequently erroneous.
Beneficial and Toxic Effects Mediated by the Same Receptor-Effector Mechanism
Much of the serious drug toxicity in clinical practice represents a direct pharmacologic extension of the therapeutic actions of the drug. In some of these cases (bleeding caused by anticoagulant therapy; hypoglycemic coma due to insulin), toxicity may be avoided by judicious management of the dose of drug administered, guided by careful monitoring of effect (measurements of blood coagulation or serum glucose) and aided by ancillary measures (avoiding tissue trauma that may lead to hemorrhage; regulation of carbohydrate intake). In still other cases, the toxicity may be avoided by not administering the drug at all, if the therapeutic indication is weak or if other therapy is available.
In certain situations, a drug is clearly necessary and beneficial but produces unacceptable toxicity when given in doses that produce optimal benefit. In such situations, it may be necessary to add another drug to the treatment regimen. In treating hypertension, for example, administration of a second drug often allows the prescriber to reduce the dose and toxicity of the first drug (see Chapter 11: Antihypertensive Agents).
Beneficial and Toxic Effects Mediated by Identical Receptors But in Different Tissues or by Different Effector Pathways
Many drugs produce both their desired effects and adverse effects by acting on a single receptor type in different tissues. Examples discussed in this book include: digitalis glycosides, which act by inhibiting Na+/K+ ATPase in cell membranes; methotrexate, which inhibits the enzyme dihydrofolate reductase; and glucocorticoid hormones.
Three therapeutic strategies are used to avoid or mitigate this sort of toxicity. First, the drug should always be administered at the lowest dose that produces acceptable benefit. Second, adjunctive drugs that act through different receptor mechanisms and produce different toxicities may allow lowering the dose of the first drug, thus limiting its toxicity (eg, use of other immunosuppressive agents added to glucocorticoids in treating inflammatory disorders). Third, selectivity of the drug's actions may be increased by manipulating the concentrations of drug available to receptors in different parts of the body, for example, by aerosol administration of a glucocorticoid to the bronchi in asthma.
Beneficial and Toxic Effects Mediated by Different Types of Receptors
Therapeutic advantages resulting from new chemical entities with improved receptor selectivity were mentioned earlier in this chapter and are described in detail in later chapters. Such drugs include the 
 - and
- and 
 -selective adrenoceptor agonists and antagonists, the H1 and H2 antihistamines, nicotinic and muscarinic blocking agents, and receptor-selective steroid hormones. All of these

receptors are grouped in functional families, each responsive to a small class of endogenous agonists. The receptors and their associated therapeutic uses were discovered by analyzing effects of the physiologic chemical signals—catecholamines, histamine, acetylcholine, and corticosteroids.
A number of other drugs were discovered by exploiting therapeutic or toxic effects of chemically similar agents observed in a clinical context. Examples include quinidine, the sulfonylureas, thiazide diuretics, tricyclic antidepressants, opioid drugs, and phenothiazine antipsychotics. Often the new agents turn out to interact with receptors for endogenous substances (eg, opioids and phenothiazines for endogenous opioid and dopamine receptors, respectively). It is likely that other new drugs will be found to do so in the future, perhaps leading to the discovery of new classes of receptors and endogenous ligands for future drug development.
Thus, the propensity of drugs to bind to different classes of receptor sites is not only a potentially vexing problem in treating patients, it also presents a continuing challenge to pharmacology and an opportunity for developing new and more useful drugs.
Chapter 3. Pharmacokinetics & Pharmacodynamics: Rational Dosing & the Time Course of Drug Action
Pharmacokinetics & Pharmacodynamics: Rational Dosing & the Time Course of Drug Action: Introduction
The goal of therapeutics is to achieve a desired beneficial effect with minimal adverse effects. When a medicine has been selected for a patient, the clinician must determine the dose that most closely achieves this goal. A rational approach to this objective combines the principles of pharmacokinetics with pharmacodynamics to clarify the dose-effect relationship (Figure 3–1). Pharmacodynamics governs the concentration-effect part of the interaction, whereas pharmacokinetics deals with the dose-concentration part (Holford & Sheiner, 1981). The pharmacokinetic processes of absorption, distribution, and elimination determine how rapidly and for how long the drug will appear at the target organ. The pharmacodynamic concepts of maximum response and sensitivity determine the magnitude of the effect at a particular concentration (see Emax and EC50, Chapter 2: Drug Receptors & Pharmacodynamics).
Figure 3–1.
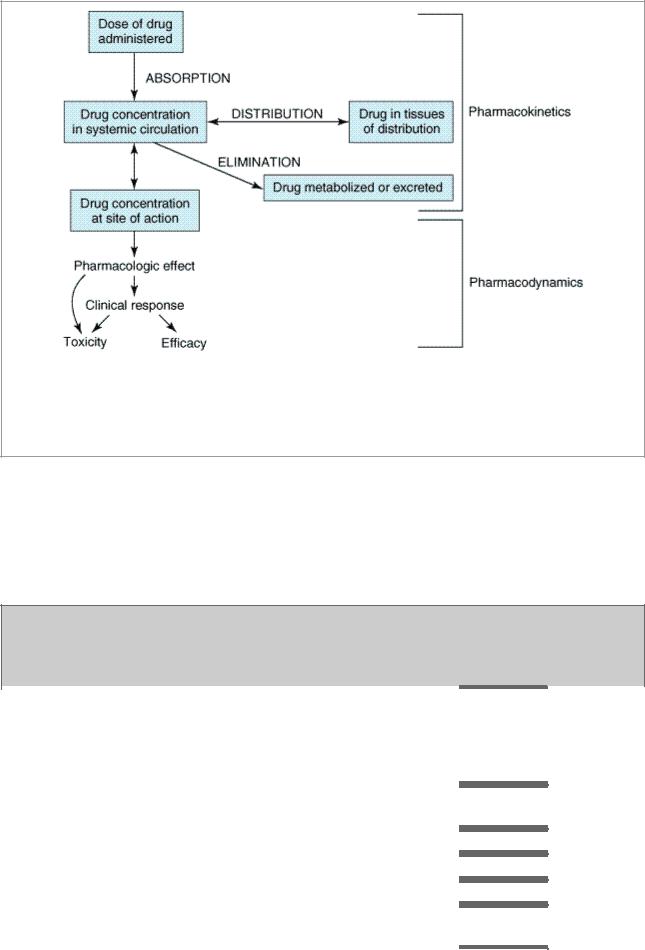
The relationship between dose and effect can be separated into pharmacokinetic (doseconcentration) and pharmacodynamic (concentration-effect) components. Concentration provides the link between pharmacokinetics and pharmacodynamics and is the focus of the target concentration approach to rational dosing. The three primary processes of pharmacokinetics are absorption, distribution, and elimination.
Figure 3–1 illustrates a fundamental hypothesis of pharmacology, namely, that a relationship exists between a beneficial or toxic effect of a drug and the concentration of the drug. This hypothesis has been documented for many drugs, as indicated by the Target Concentrations and Toxic Concentrations columns in Table 3–1. The apparent lack of such a relationship for some drugs does not weaken the basic hypothesis but points to the need to consider the time course of concentration at the actual site of pharmacologic effect (see below).
Table 3–1. Pharmacokinetic and Pharmacodynamic Parameters for Selected Drugs. (See Speight & Holford, 1997, for a More Comprehensive Listing.)
Drug |
Oral |
Urinar |
Boun |
Cleara |
Volume |
Half- |
|
Target |
|
|
Toxic |
|
|
|
Availabi |
y |
d in |
nce |
of |
Life (h) |
|
Concentrat |
|
|
Concentrat |
|
|
|
lity (F) |
Excreti |
Plas |
(L/h/70 |
Distribut |
|
|
ions |
|
|
ions |
|
|
|
(%) |
on (%) |
ma |
kg)1 |
ion (L/70 |
|
|
|
|
|
|
|
|
|
|
|
(%) |
|
kg) |
|
|
|
|
|
|
|
|
Acetaminoph |
88 |
3 |
0 |
21 |
67 |
2 |
|
15 mg/L |
|
|
>300 mg/L |
|
|
en |
|
|
|
|
|
|
|
|
|
|
|
|
|
Acyclovir |
23 |
75 |
15 |
19.8 |
48 |
2.4 |
|
. . . |
|
|
. . . |
|
|
|
|
|
|
|
|
|
|
|
|
|
|
|
|
Amikacin |
. . . |
98 |
4 |
5.46 |
19 |
2.3 |
|
. . . |
|
|
. . . |
|
|
|
|
|
|
|
|
|
|
|
|
|
|
|
|
Amoxicillin |
93 |
86 |
18 |
10.8 |
15 |
1.7 |
|
. . . |
|
|
. . . |
|
|
Amphoterici |
. . . |
4 |
90 |
1.92 |
53 |
18 |
|
. . . |
|
|
. . . |
|
|
n |
|
|
|
|
|
|
|
|
|
|
|
|
|