

ENGLISH for Study and Work том 1
.pdfWhen using these various visuals, do not turn your back to the audience. Position yourself so you can use the visuals while facing your audience.
Visual aids help to make presentations effective. It is important that data can be presented in a clear manner that is easy to interpret and analyse, and for the listeners to understand.
Describing graphs and charts
4. Study the information given below and do the tasks that follow.
A fact is different from an opinion because it is objective and often involves measurement. Graphs, charts and tables are ways of presenting information in a form that is easy to understand. Line graphs are used to show a trend or pattern which usually takes place over a period of time. It is important to look at the overall pattern on a line graph as well as the significant features within it. Match each type shown above with one of the following descriptions.
23029187
1.A __________ shows the different parts of a total amount. For example, it could show the percentage of money that a student spends on entertainment, clothes, accommodation and food.
2.A __________ is useful for comparing things and showing amounts or quantities at specific times. For example, the percentage of people who own certain products (cars, televisions, etc.) in three different periods.
3.A __________ contains a list of numbers or facts arranged in rows and columns. It could, for example, be a list of results for football league tables.
4.A __________ is useful for showing how things change over time, and for showing two or more sets of measurements which are related to each other. For example, it might show how the number of passengers of an airline has changed from month to month.
5.Pair-work. Which of the ways of presenting information (graphs, charts, tables) would you use to illustrate the following? Explain your choice to a partner.
1.Coal production in your area each month during a 12-month period
2.The results of a survey of the world’s biggest markets for coal
3.A comparison of coal production in Asia (has grown fastest) and Europe (has seen a decline in production) during the last five years
4.Coal consumption in power generation in four world regions (Africa, Europe, South America and North America) during three periods: 2007, 2008, 2009
2312908
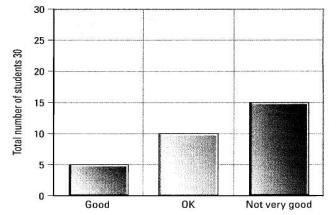
6. Look at the bar chart below. It shows what a group of students think about a seminar they have just attended.
Having looked at this graph, you could say that half the students did not like the seminar. Or you could say that 50 per cent of the students did not like the seminar. You could be even more specific and state that 5 out of 30 students did not like the seminar. These are all facts.
7. Find out some factual information about hobbies of your group-mates using the worksheet below. Put a tick against each activity the people like doing and then write the total in the Total column. Turn the table into three different types of diagrams (graph, bar chart, pie chart). Be ready to describe them to the whole group.
WORKSHEET 4.3
Activity |
|
|
|
|
|
|
|
|
|
|
|
|
|
|
|
Total |
|
|
|
|
|
|
|
|
|
|
|
|
|
|
|
|
|
Sports |
|
|
|
|
|
|
|
|
|
|
|
|
|
|
|
|
|
|
|
|
|
|
|
|
|
|
|
|
|
|
|
|
|
Singing |
|
|
|
|
|
|
|
|
|
|
|
|
|
|
|
|
|
|
|
|
|
|
|
|
|
|
|
|
|
|
|
|
|
Dancing |
|
|
|
|
|
|
|
|
|
|
|
|
|
|
|
|
|
|
|
|
|
|
|
|
|
|
|
|
|
|
|
|
|
Computer games |
|
|
|
|
|
|
|
|
|
|
|
|
|
|
|
|
|
|
|
|
|
|
|
|
|
|
|
|
|
|
|
|
|
Jogging |
|
|
|
|
|
|
|
|
|
|
|
|
|
|
|
|
|
|
|
|
|
|
|
|
|
|
|
|
|
|
|
|
|
Yoga |
|
|
|
|
|
|
|
|
|
|
|
|
|
|
|
|
|
|
|
|
|
|
|
|
|
|
|
|
|
|
|
|
|
Cooking |
|
|
|
|
|
|
|
|
|
|
|
|
|
|
|
|
|
|
|
|
|
|
|
|
|
|
|
|
|
|
|
|
|
2322901
8. Describe your own diagrams using the following structures:
number (e.g. five out of ten) students enjoy...
percentage (e.g. 50 per cent of) students enjoy...
general (e.g. the majority of / a large number of / most / very few /hardly any)
students enjoy…
Use of language
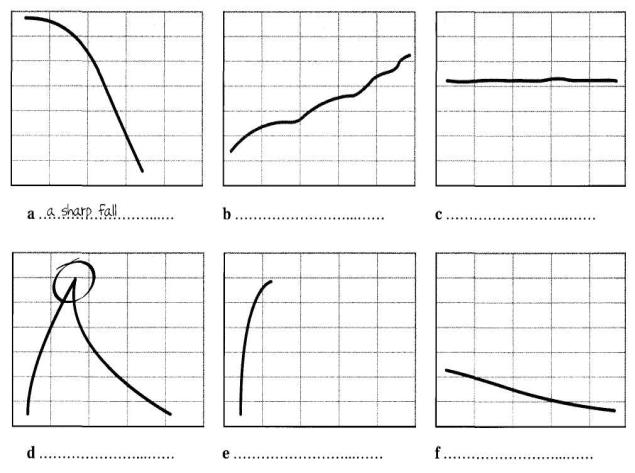
9. Using some of the words and phrases from the table 4.3 Useful language: describing trends, describe the pattern in each graph below. The first (a) has been done for you.
10. Describe each pattern using an adverb and the information from the tables given below. e.g. a It falls sharply
233410

Table 4.3
Useful language: describing trends
|
Meaning |
|
Verb |
|
Noun |
|
go down |
|
decrease |
|
same |
|
|
|
fall |
|
same |
|
|
|
|
same |
|
|
|
|
drop |
|
|
|
|
|
|
same |
|
|
|
|
decline |
/ |
|
|
|
|
plunge (big change) |
/ |
|
|
|
|
plummet (big change) |
|
|
|
go up |
|
increase |
|
same |
|
|
|
rise |
|
same |
|
|
|
grow |
|
growth |
|
|
|
double |
|
doubling in + n |
|
|
|
treble |
|
trebling in+ n |
|
|
|
rocket (big change) |
/ |
|
|
no change |
|
level off |
|
a levelling off at |
|
|
|
remain the same |
/ |
|
|
|
|
remain stable |
/ |
|
|
|
|
stabilize |
/ |
|
|
|
|
|
|
|
|
constant change |
|
fluctuate |
|
fluctuation in + n |
|
|
|
|
|
|
|
position |
|
reach a high/peak of |
|
a high of |
|
|
|
reach a low of |
|
a low of |
|
|
|
/ |
||
|
|
|
stood at |
||
|
|
|
|
|
|
|
|
|
|
|
|
|
Meaning |
ADJ/ADV |
|
|
|
|
|
|
|
|
|
|
small change |
steady(ily) |
|
|
|
|
|
slight(ly) |
|
|
|
|
|
gradual(ly) |
|
|
|
|
|
|
|
|
|
|
large change |
considerable (ly) |
|
|
|
|
|
sharp(ly) |
|
|
|
|
|
dramatic(ally) |
|
|
|
|
|
significant(ly) |
|
|
|
|
|
substantial(ly) |
|
|
|
|
|
|
|
|
|
 Grammar Reference:
Present Simple, Continuous and Perfect Tenses. Adjectives. Adverbs.
234351
Follow-up
11. Group-work. You are going to give a presentation on coal production using the information from the article given below. Focus on:
•global coal demand
•coal production
•coal consumption
•coal price forecast
Use any of the ways (graphs, charts, tables) to illustrate the information and words and phrases from the table 4.3 Useful language: describing trends.
12. Practise giving your presentation in the group. You may choose a presenter or give a team-presentation.
Coal Production
Why There's Further Upside for Coal Stocks
By Ian Cooper
"While coal supply is bad for China, it's great news for U.S. coal companies, which are predicting that global coal demand, will outstrip supply by 25 to 35 million metric tons. Coal consumption could rise 74% by 2030. India alone is expecting for its current annual demand of 460 million metric tons to quadruple by 2031. That's great news for coal company earnings potential.
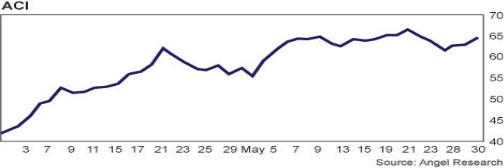
Digest that... and we'd recommend keeping an eye on Arch Coal (ACI:NYSE), which just raised its dividend, and the Market Vectors Coal ETF (KOL), which tracks the performance of a Stowe Coal Index that includes 60 global coal production and transportation companies," said the editors of Small Cap Trading Pit and Wealth Daily, April 26, 2008.
Two months after the recommendation, we're still just as bullish.
ACI ran from a $54 low to a high of $68 after our mention, only to settle at $68 yesterday.
235346

KOL ran from about $42 to about $54.
And there's still plenty of upside remaining, as coal futures now price for more than double what they were six months ago.
Coal Production and the Global Coal Problem
If it's not one thing, it's another for China... earthquakes... pollution... and we're just months from the 2008 Summer Olympics. China, which depends on coal for 70% of its power, now warns that power plants are running out of supply, with some regions down to a three-day supply.
Reportedly, power plants in the Anhui province have about 2.8 days supply. Beijing has 6.9 day supplies. A week's supply, say reports, is considered the danger line.
Even Australia, the largest exporter of coal, is having a tough time. Thanks to flooding issues, six of the largest coal exporters failed to deliver, causing a big drop in supply.
Sure, other coal exporters could easily fill the gap left by Australia. But South Africa has been busy dealing with power shortages. And Russia is more focused on exporting gas than coal.
And while coal production projects have been announced, we're not going to see an overnight increase in supply. In the meantime, we're stuck with rising coal prices... ahead of the 2008 Summer Olympics.
And we're not the only ones still bullish on higher coal costs.
Friedman Billings Ramsey just raised its coal price forecast and upgraded Massey Energy, suggesting that demand will outpace supply through 2010.
The forecast for metallurgical coal was raised by 90% for 2009 to $130 per ton. For 2010, the forecast was raised to $250 a ton. For steam coal, used to produce electricity, prices were forecast to run another 25% in 2009 and 2010.
236457
And it's all thanks to lower supply and significant international demand. The steam coal market, they say, is "undersupplied as power demand accelerates the need for the commodity."
If you want to leverage low supply and high demand for coal, the KOL ETF and shares of ACI are still just as attractive. SC Trading Pit issued a buy on an $8 laggard coal stock going to $12.
When markets get volatile, as they are now, investors start looking for a safe thing.
Coal Doesn't Seem Boring when Investors are Nervous...
Another way to profit from coal is to buy coal dividend paying stocks, or those providing a steady source of income. Dividends help protect investors even during economic malaise.
Some of our favorite dividend-paying coal stocks include (dividends, according to Yahoo Finance):
•Penn Virginia Resources (PVR) pays a 6.7% dividend.
•Alliance Resources Partners (ARLP) pays a 5.2% dividend.
•Natural Resources (NRP) pays a 5.9% dividend.
•Progress Energy (PGN) pays a 5.8% dividend.
•CH Energy (CHG) pays a 5.7% dividend.
•Alliance Holdings (AHGP) pays a 4.3% dividend.
•Arch Coal Inc. (ACI) pays a 0.60% dividend.
•Massey Energy (MEE) pays a 0.30% dividend.
In our current economic meltdown, it's best to diversify with stocks that can bring in consistent money to help offset hyper-priced food and energy bills. With the expectation of higher coal cost, plus dividend payouts, we expect further upside in each of the coal stocks we've mentioned.
The eventual goal of every investor is to go from supporting a portfolio to having a portfolio that supports the investor. That's part of the reason we love dividend stocks. They produce a steady stream of income despite the direction of the broader market.
Good Investing,
Ian L. Cooper
_____________________________________________________________
Accessed on the site http://www.wealthdaily.com/
2378654

Unit 6 Delivery Techniques
Focus on
•delivery techniques
•elements of effective delivery
•manner of delivery
•body language
By the end of the unit you will be aware of:
•types of delivery
•appropriate manner of delivery
•non-verbal communication
•ways to interest your audience
•ways of catching audience attention
Lead-in
1. Pair-work. Read the following quotation. How do you understand it? Do you agree with it? How does it relate to the topic of the unit? Share your ideas with your partner.
"When you can do the common things in life in an uncommon way, you will command the attention of the world." (George Washington Carver)
Brainstorming
2.Pair-work. Discuss the following questions with a partner:
1.How do you understand the term ‘non-verbal communication’?
2.What does non-verbal communication include?
3.What elements of non-verbal communication are most important?
Fill in the mind-map given on the following page and describe it to the whole group.
2389765
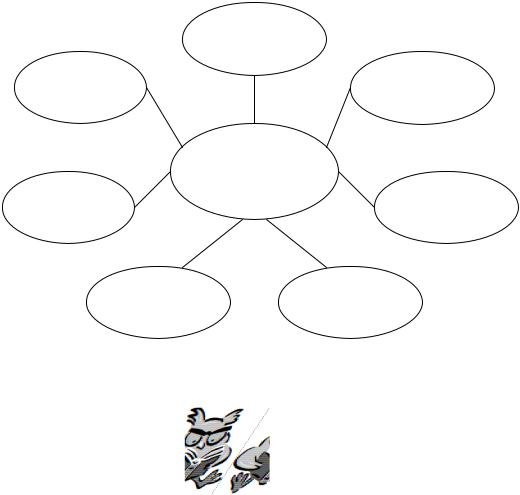
Eye contact
Non-verbal communication
Reading and Discussion
3. Read carefully the article given below. Pay attention to the points you discussed in 2. Add new information to your mind-map or table.
Speak English with Body Language
By: Joseph DeVeto
When we speak, we use much more than just words. We also communicate with our face, our hands, and even our own body. This kind of communication can be called "body language" or "non-verbal communication". Non-verbal communication not only includes how we move our body, but also hand gestures, facial expressions including eye contact, and how we use our voice. Psychologists estimate that between 60% and 80% of all of our communication with other people is non-verbal. We communicate a wide range of information non-verbally. We also show our feelings, attitudes, moods, hopes and wishes far better with non-verbal language than with words.
23940876