

Статистика пожаров / National Fire Protection Association / Fire loss in the United States during 2003
.pdfCivilian Deaths
The 1,584,500 fires reported to by fire departments in the U.S. in 2003 resulted in an estimated 3,925 civilian deaths based on data reported to the NFPA. This is an increase of 16.1% from a year ago.
An estimated 3,165 died in residential fires in 2003, an increase of 17.4%. Of these deaths, 410 occurred in apartment fires, an increase of 5.1%. Another 2,735 civilians died in oneand two-family dwellings, an increase of 20.0%. This is 455 more deaths than the year before, and returns it closer to 2000 and 2001 levels. When dwelling death rates declined sharply in 2002 we advised caution because death rates can vary considerably from year to year, particularly for smaller communities. The same applies to the 2003 increase, but the long-term trend is still downward.
In all, fires in the home (oneand two-family dwellings including manufactured homes and apartments) resulted in 3,145 civilian deaths, an increase of 17.8% from a year ago. Looking at trends in civilian deaths since 1977-781, several observations are worth noting (see Figure 3). Home fire deaths were at their peak in 1978 when 6,015 fire deaths occurred. Home fire deaths then decrease steadily during the 1979-82 period except for 1981, and decreased a substantial 20% during the period to 4,820 by the end of 1982. From 1982 to 1988, the number of home fire deaths stayed quite level in the 4,655 to 4,955 area except for 1984 when 4,075 fire deaths occurred. In the past fourteen years, home fire deaths moved well below the 1982-88 plateau and has stayed in the 3,145 to 3,720 area during 1991 to 2003 except for 1996, 1999 and 2002.
With home fire deaths still accounting for 3,145 fire deaths or 80% of all civilian deaths, fire safety initiatives targeted at the home remain the key to any reductions in the overall fire death toll. Five major strategies are: First, more widespread public fire safety education is needed on how to prevent fires and how to avoid serious injury or death if fire occurs. Information on the common causes of fatal home fires should continue to be used in the design of fire safety education messages. Second, more people must use and maintain smoke detectors and develop and practice escape plans. Third, wider use of residential sprinklers must be aggressively pursued. Fourth, additional ways must be sought to make home products more fire safe. The regulations requiring more childresistant lighters are a good example, as is the recent examination of the feasibility of less
Fire Loss in the U.S., 2003 |
7 |
NFPA Fire Analysis and Research, Quincy, MA |

Figure 3 Civilian Fire Deaths
in the Home in the United States (1977-2003)
Civilian Deaths
7,000
5,865
6,000
5,000
4,000
3,145
3,000
2,000
1,000
0
|
7 |
|
8 |
|
9 |
1980 |
1981 |
1982 |
1983 |
1984 |
1985 |
1986 |
1987 |
1988 |
1989 |
1990 |
1991 |
|
92 |
|
93 |
|
94 |
|
95 |
|
96 |
|
97 |
|
98 |
|
99 |
|
|
0 |
|
|
1 |
|
|
2 |
|
|
3 |
7 |
7 |
7 |
1 |
1 |
1 |
1 |
1 |
1 |
1 |
1 |
2 |
0 |
2 |
0 |
2 |
0 |
2 |
0 |
|||||||||||||||||||||||||||
19 |
|
19 |
|
19 |
|
|
|
|
|
|
|
|
|
|
|
|
|
|
|
|
|
||||||||||||||||||||||||
|
|
|
|
|
|
|
|
|
|
|
|
|
|
|
|
|
|
9 |
9 |
9 |
9 |
9 |
9 |
9 |
9 |
0 |
|
0 |
|
0 |
|
0 |
|
||||||||||||
Year
Source: NFPA's Survey of Fire Departments for 2003 U.S. Fire Experience
Fire Loss in the U.S., 2004 |
8 |
NFPA Fire Analysis and Research, Quincy, MA |
Table 4
Estimates of 2003 Civilian Fire Deaths and
Injuries by Property Use
|
Civilian Deaths |
|
Civilian Injuries |
|
||
|
|
Percent |
Percent |
|
Percent |
Percent |
|
|
Change |
of all |
|
Change |
of all |
|
|
From |
Civilian |
|
From |
Civilian |
Property Use |
Estimate |
2002 |
Deaths |
Estimate |
2002 |
Injuries |
Residential (total) |
3,165 |
+17.4* |
80.6 |
14,075 |
+0.2 |
77.6 |
One-and-Two- |
2,735 |
+20.0* |
69.7 |
10,000 |
+0.5 |
55.2 |
Family Dwellings1 |
|
|
|
|
|
|
Apartments |
410 |
+5.1 |
10.5 |
3,650 |
-1.4 |
20.1 |
Other Residential2 |
20 |
-20.0 |
0.5 |
425 |
+6.3 |
2.3 |
Non-residential |
2204 |
+175.0 |
5.6 |
1,525 |
-1.6 |
8.4 |
Structures3 |
|
|
|
|
|
|
Highway Vehicles |
455 |
-15.7 |
11.7 |
1,400 |
-17.7 |
7.7 |
Other Vehicles5 |
20 |
-20.0 |
0.5 |
200 |
+60.0 |
1.1 |
All Other6 |
65 |
+62.5 |
1.7 |
925 |
-7.5 |
5.1 |
Total |
3,925 |
+16.1* |
|
18,125 |
-1.6 |
|
Estimates are based on data reported to the NFPA by fire departments that responded to the 2003 National Fire Experience Survey. Note that most changes were not statistically significant; considerable year-to-year fluctuation is to be expected for many of these totals because of their small size.
1This includes manufactured homes.
2Includes hotels and motels, college dormitories, boarding houses, etc.
3This includes public assembly, educational, institutional, store and office, industry, utility, storage, and special structure properties.
4This includes 100 fire deaths in the Station Nightclub Fire in Rhode Island, and 31 deaths in two nursing home fires in Connecticut and Tennessee.
5This includes trains, boats, ships, farm vehicles and construction vehicles.
6This includes outside properties with value, as well as brush, rubbish, and other outside locations. *Statistically significant at the .05 level.
Fire Loss in the U.S., 2003 |
9 |
NFPA Fire Analysis and Research, Quincy, MA |
fire-prone cigarettes. The wider use of upholstered furniture and mattresses that are more resistant to cigarette ignitions is an example of change that has already accomplished much and will continue to do more. Fifth, the special fire safety needs of high-risk groups, e.g., the young, older adults, and the poor need to be addressed. 2, 3
Also in 2003, an estimated 220 civilians died in nonresidential structure fires, a highly significant increase of 175%. This increase reflects the 100 fire deaths that occurred in the Station Nightclub Fire in Rhode Island, and 31 deaths that occurred in two nursing home fires in Connecticut and Tennessee.
Civilian fire death rates by size of community were examined for the period (see Figure 4). The smallest communities (under 2,500 population) had the highest rate. The rate for communities under 2,500 population was more than twice the national average rate.
Of the 3,385 civilians that died in structure fires, 305 or 9.0% died in fires that were intentionally set.
Also in 2003, 455 civilians died in highway vehicle fires, a decrease of 15.7%, and 20 died in other vehicle fires.
Fire Loss in the U.S., 2003 |
10 |
NFPA Fire Analysis and Research, Quincy, MA |

Figure 4 Civilian Fire Deaths per Million Population
By Size of Community (1999-2003)
Civilian Fire Deaths per Million People
30
27.3
25
20 |
|
|
|
|
|
|
|
|
|
|
|
|
|
|
|
|
|
17.8 |
|
|
|
|
|
|
|
|
|
|
|
|
|
||||
|
|
|
|
|
|
|
|
|
|
|
|
|
|
||||
|
|
|
|
|
|
|
|
|
|
|
|
|
|
|
|
|
|
15 |
15.2 |
|
|
|
|
|
|
|
|
|
|
|
|||||
|
|
|
|
|
|
|
|
|
13.2 |
|
|
|
|
|
|||
|
|
|
|
|
|
|
|
|
|
|
|
|
|
||||
|
|
|
|
|
|
|
|
|
|
|
|
|
|
|
|||
|
12.1 |
11.4 |
10.9 |
|
|
|
12.1 |
11.3 |
|||||||||
|
|
|
11.6 |
||||||||||||||
|
|
|
|
|
|
|
|
|
|
|
|
|
|
|
|||
|
|
|
|
|
|
|
|
|
|
|
|
|
|
|
|||
10
5
0
under 2,500 2,500 to |
5,000 to |
10,000 to |
25,000 to |
50,000 to |
100,000 to |
250,000 to |
500,000 to |
1,000,000 |
4,999 |
9,999 |
24,999 |
49,999 |
99,999 |
249,999 |
499,999 |
999,999 |
or more |
Source: NFPA's Annual Survey of Fire Departments for U.S. Fire Experience (1999-03)
Size of Community
Fire Loss in the U.S., 2004 |
11 |
NFPA Fire Analysis and Research, Quincy, MA |
Civilian Fire Injuries
Results based on data reported to the NFPA indicate that in addition to 3,925 civilian fire deaths, there were 18,125 injuries in 2003. This is a decrease of 1.6% from a year ago.
Estimates of civilian fire injuries are on the low side, because many civilian injuries are not reported to the fire service. For example, many injuries occur at small fires that fire departments do not respond to, and sometime when departments do respond they may be unaware of injured persons that they did not transport to medical facilities.
The NFPA estimates that there were 14,075 civilians injured in residential properties, a slight increase of 0.2%. Of these injuries, 10,000 occurred in oneand twofamily dwellings, while 3,650 occurred in apartments.
For the 1977-2003 period, the number of civilian injuries has ranged from a high of 31,275 in 1983 to a low of 18,125 in 2003 for an overall decrease of 42%. There was no consistent pattern going up or down until 1995, when injuries fell roughly 5,000 in 1994-95 to 25,775, changed little in 1996, dropped 8% to 23,750 in 1997, changed little in 1998, dropped 5% in 1999, and then increased slightly in 2000, and then dropped 20% in 2001-2003 to 18,125 by the end of 2003.
Property Loss
The NFPA estimates that the 1,584,500 fires responded to by the fire service caused $12,307,000,000 in property damage in 2003. This is an increase of 19.1% from a year ago. (This total figure includes the Southern California Wildfires (Cedar and Old Wildfires) with an estimated total property loss of $2,040,000,000. Loss by specific property type for this fire were not available, and are not included for results by property type in this report).
Fires in structures resulted in an estimated $8,678,000,000 in property damage, a slight 0.7% decrease from a year ago. Average loss per structure fire was $16,705, a slight decrease of 0.8%.
Over the 1977-2003 period, and excluding the events of 9/11/01, the average loss per structure fire ranged from a low of $3,757 to a high of $17,016 in 2001 for an overall increase of 353%. When property loss is adjusted for inflation, the increase in the average structure fire loss between 1977 and 2001 is 56%.
Of the property loss in 2003, an estimated $6,074,000,000 occurred in residential properties, up a very slight 0.3% from a year ago. An estimated $5,052,000,000 occurred in oneand two-family dwellings, virtually no change from a year ago. An estimated $897,000,000 also occurred in apartments. Other property damage figures worth noting
Fire Loss in the U.S., 2003 |
12 |
NFPA Fire Analysis and Research, Quincy, MA |
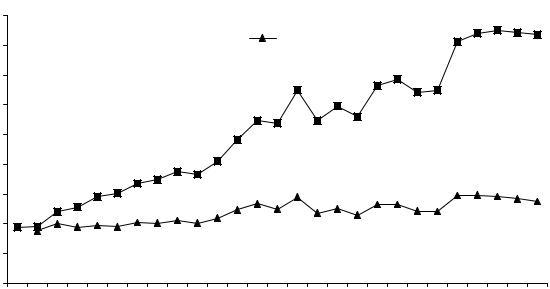
Figure 5. U.S. Average Property Loss per Structure* Fire in the United States (1977-2003)
Average Property Loss per Structure Fire
18,000
16,000
14,000
12,000
10,000
8,000
6,000
4,000
2,000 $3,757
0

 Unadjusted
Adjusted for Inflation |
$16,705 |
|
$5,502
|
77 |
|
78 |
|
79 |
|
80 |
|
81 |
|
82 |
|
83 |
|
84 |
|
3 |
4 |
5 |
6 |
7 |
8 |
9 |
|
0 |
01 |
|
02 |
03 |
|||||||
1 |
|
1 |
|
1 |
|
1 |
|
1 |
|
1 |
|
1 |
|
1 |
|
1985198619871988198919901991199219 |
19 |
19 |
19 |
19 |
19 |
19 |
20 |
20 |
|
20 |
|
20 |
||||||||
9 |
|
9 |
|
9 |
|
9 |
|
9 |
|
9 |
|
9 |
|
9 |
|
|
|
|
|
|
|
|
|
|
|
|
|
|
||||||||
Source: NFPA's Survey of Fire Departments |
Year |
|
|
|
|
|
|
|
*Does not include the |
|||||||||||||||||||||||||||
for 2003 U.S. Fire Experience |
|
|
|
|
|
|
|
|
|
|
|
|
|
|
events of 9/11/01 |
|||||||||||||||||||||
Fire Loss in the U.S., 2004 |
|
|
|
|
|
|
|
|
|
|
|
|
|
|
|
|
|
|
|
|
|
|
13 |
|
|
|
|
NFPA Fire Analysis and Research, Quincy, MA |
||||||||
.
for 2003 include: $69,000,000 in educational properties, a decrease of 25%; $721,000,000 in store and office properties an increase of 19.4%; $302,000,000 in public assembly properties, a decrease of 11.7%; $675,000,000,000 in storage properties, an increase of 7.7%.
It should be kept in mind that property loss totals can change dramatically from year to year because of the impact of occasional large loss fires. The NFPA provides an analysis of these large loss fires in the November/December issue of NFPA Journal every year.
Intentionally Set Fires
Based on data reported by fire departments in the survey, the NFPA estimates there were 37,500 intentionally set structure fires in 2003, a significant decrease of 15.7% from a year ago. (Note the NFPA survey is based on the newly revised NFIRS 5.0 system. This new system has an intentionally set category which is equivalent to the old incendiary category. There is no new equivalent to the old suspicious category which has been eliminated.)
These intentionally set structure fires resulted in an estimated 305 civilian deaths, a decrease of 12.9%. These set structure fires also resulted in $692,000,000 in property loss, a significant decrease of 24.7% from last year.
Also in 2003, there were an estimated 30,500 intentionally set vehicle fires, a significant decrease of 25.6%. These set vehicle fires resulted in $132,000,000, a highly significant decrease of 40.5%.
Fire Loss in the U.S., 2003 |
14 |
NFPA Fire Analysis and Research, Quincy, MA |
|
|
Table 5 |
|
Estimate of 2003 Losses in |
|
|
Intentionally* Set Structure Fires |
|
Intentionally* Set |
Estimate |
Percent change |
Structure Fires |
|
from 2002 |
Number of Structure Fires |
37,500 |
-15.7** |
Civilian Deaths |
305 |
-12.9 |
Property Loss1 |
$692,000,000 |
-24.7** |
The estimates are based on data reported to the NFPA by fire departments that responded to the 2003 National Fire Experience Survey.
1 This includes overall direct property loss to contents, structure, a vehicle, machinery, vegetation, or anything else involved in a fire. It does not include indirect losses, e.g., business interruption or temporary shelter costs. No adjustment was made for inflation in the year-to-year comparison.
*The NFPA Survey is based on the newly revised NFIRS 5.0 system. This new system has an intentionally set category which is equivalent to the old incendiary category. There is no new equivalent to the old suspicious category, which has been eliminated.
**Statistically significant at the .01 level.
Fire Loss in the U.S., 2003 |
15 |
NFPA Fire Analysis and Research, Quincy, MA |
Region
Fire loss rates nationwide and by region6 can be seen in Table 6. The South had the highest fire incident rate with 6.0 fires per thousand population followed by the Northcentral (5.6).
The South with 16.0 again had the highest civilian death rate per million population followed closely by the Northeast (16.0).
The Northcentral with 78.2 had the highest injury rate per million population, while the West had the lowest rate (41.9).
The West with $60.2 had the highest property loss rate per capita by far. This again reflects the impact of the Southern California Wildfires. Property loss rates for the other regions fell in the $35.8 to $37.4 range.
Fire incident rates by region and community size are shown in Table 7. The Northeast had the highest incident rates for communities of 50,000 to 249,999, the West had the highest rate for communities of 10,000 to 249,999, and the South had the highest rates for communities of 25,000 to 49,999, and for smaller communities (populations of less than 10,000).
Civilian fire deaths per million population are shown in Table 8. The Northeast had the highest death rate for communities of 500,000 or more, the Northcentral had the highest rates for communities of 100,000 to 249,999, the West had the highest rate for the smallest communities, and the South had the highest rates for communities of 2,500 to 99,999.
Civilian fire injury rates per million population are shown in Table 9. The Northeast had the highest rates for communities of 100,000 to 249,999, and communities of 2,500 to 4,999, the Northcentral had the highest rates for communities of 250,000 to 499,999, communities of 10,000 to 24,999, and communities less than 2,500, the South had the highest rates for communities of 500,000 or more, and communities of 25,000 to 49,999, and the West had the highest rate for communities of 5,000 to 9,999.
Property Loss rates per capita are shown in Tale 10. The Northeast had the highest rate for communities of 10,000 to 24,999, the West had the highest rates for communities of 25,000 to 49,999, communities of 5,000 to 9,999, and communities less than 2,500, the South had the highest rates for communities of 250,000 or more, communities of 50,000 to 99,999, and communities of 2,500 to 4,999.
Fire Loss in the U.S., 2003 |
16 |
NFPA Fire Analysis and Research, Quincy, MA |