

Статистика пожаров / National Fire Protection Association / Fire loss in the United States during 2008
.pdfTable 3
Estimates of 2008 Structure Fires and
Property Loss by Property Use
|
Structure Fires |
Property Loss1 |
||
|
|
Percent |
|
Percent |
|
|
Change |
|
Change |
Property Use |
Estimate |
from 2007 |
Estimate |
from 2007 |
California Wildfires 2008 |
|
|
$1,400,000,000 |
|
Public Assembly |
14,000 |
-3.5 |
$518,000,000 |
+4.0 |
Educational |
6,000 |
-7.7 |
66,000,000 |
-34.0** |
Institutional |
6,500 |
-7.1 |
22,000,000 |
-46.3** |
Residential (Total) |
403,000 |
-2.7 |
8,550,000,000 |
+13.3** |
Oneand Two-Family |
|
|
|
|
Homes2 |
291,000 |
-3.2 |
6,892,000,000 |
+10.7** |
Apartments |
95,500 |
-3.1 |
1,351,000,000 |
+16.1** |
Other Residential3 |
16,500 |
+10.0 |
307,000,000 |
+95.5** |
Stores and Offices |
20,500 |
-4.7 |
684,000,000 |
+5.0 |
Industry, Utility, |
|
|
|
|
Defense4 |
10,000 |
-13.0** |
1,401,000,0005 |
+79.9** |
Storage in Structures |
30,000 |
-3.2 |
661,000,000 |
-1.3 |
Special Structures |
25,000 |
+2.0 |
459,000,000 |
+26.8 |
Total |
515,000 |
-2.9 |
$12,361,000,0006 |
+16.2** |
The estimates are based on data reported to the NFPA by fire departments that responded to the 2008 National Fire Experience Survey.
1This includes overall direct property loss to contents, structure, a vehicle, machinery, vegetation or anything else involved in a fire. It does not include indirect losses, e.g., business interruption or temporary shelter costs. No adjustment was made for inflation in the year-to-year comparison.
2This includes manufactured homes.
3Includes hotels and motels, college dormitories, boarding houses, etc.
4Incidents handled only by private fire brigades or fixed suppression systems are not included in the figures shown here.
5This total reflects three industrial property incidents that resulted in $775 million in property damage.
6This total does not include.the California Wildfires 2008. **Change was statistically significant at the .01 level.
Fire Loss in the U.S. 2008, 8/09 |
4 |
NFPA Fire Analysis and Research Quincy, MA |

3,500,000 |
Figure 1 |
|
|
|
|
|
Estimate of Fires by Type |
Total |
3,000,000 |
in the United States (1977 2008) |
Outside |
|
||
|
|
Structure |
2,500,000 |
|
Vehicle |
2,000,000 |
|
|
1,500,000 |
|
1,451,500 |
|
|
|
1,000,000 |
|
|
|
|
700,500 |
500,000 |
|
515,000 |
|
|
236,000 |
0 |
|
|
Fire Loss in the U.S. 2008, 8/09 |
5 |
NFPA Fire Analysis and Research Quincy, MA |
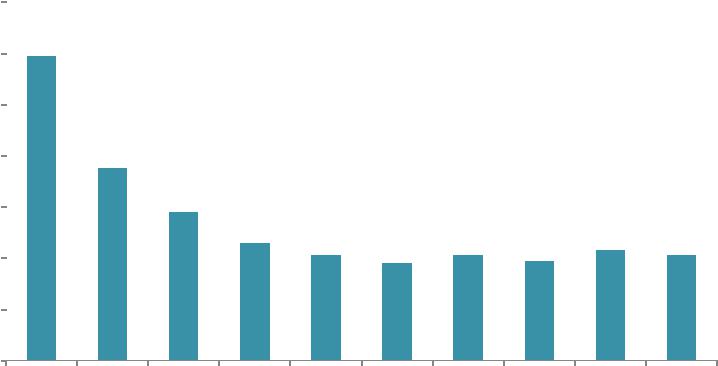
Figure 2. Fires per Thousand Population by Size of Community (2004 2008)
|
14 |
|
11.9 |
|
|
|
|
|
|
||
|
12 |
|
|
|
|
Population |
|
|
|
|
|
10 |
|
|
|
|
|
|
|
|
|
|
|
perFiresThousand |
8 |
|
|
7.5 |
|
4 |
|
|
|
5.8 |
|
|
6 |
|
|
|
|
|
2 |
|
|
|
|
|
0 |
|
under 2,500 |
2,500 to |
5,000 to |
|
|
||||
|
|
|
|||
|
|
|
|
4,999 |
9,999 |
Source: NFPA Survey of Fire Departments for U.S. Fire Experience; (2004-2008)
Fire Loss in the U.S. 2008, 8/09
4.6
4.1 |
3.8 |
4.1 |
3.9 |
4.3 |
4.1 |
10,000 to |
25,000 to |
50,000 to |
100,000 to |
250,000 to |
500,000 to |
1,000,000 or |
2,499 |
49,999 |
99,999 |
249,999 |
499,999 |
999,999 |
more |
Size of Community
6 |
NFPA Fire Analysis and Research, Quincy, MA |
particular, fires outside with value decreased a highly significant 16.5% to 71,000, rubbish fires decreased a significant 9.0% to 188,000, and brush fires decreased 5.6% to 335,000.
Civilian Fire Deaths
The 1,451,500 fires reported by fire departments in the U.S. in 2008, resulted in an estimated 3,320 civilian deaths based on data reported to the NFPA. This is a slight decrease of 3.2% from a year ago. The nature of this decrease is better understood when results are examined by property type.
An estimated 2,780 civilians died in residential fires in 2008, a decrease of 4.0% from a year ago. Of these deaths, 390 occurred in apartment fires and the lowest figure since 2002 when a similar number died in apartment fires. Another 2,365 died in oneand two-family homes fires, virtually no change from a year ago.
In all, fires in the home (oneand two-family homes including manufactured homes and apartments) resulted in 2,755 civilian deaths, a decrease of 3.8% from a year ago, and the third lowest since 1977. Looking at trends in civilian deaths since 1977-781, several observations are worth noting (see Figure 3). Home fire deaths were at their peak in 1978 when 6,015 fire deaths occurred. Home fire deaths then decreased steadily during the 1979-82 period except for 1981, and decreased a substantial 20% during the period to 4,820 by the end of 1982. From 1982 to 1988, the number of home fire deaths stayed quite level in the 4,655 to 4,955 area except for 1984 when 4,075 fire deaths occurred. From 1989 to 1996 home fire deaths continued to decline and stayed in the 3,425 to 4,335 area. From 1997 onward home fire deaths have generally continued to decline with the number of deaths staying in the 2,580 to 3,190 area since 2001.
Overall for the 1977-2008 period, the number of home fire deaths decreased from 5,865 in 1977 to 2,775 in 2008 for a decrease of 53%. The number of home fire incidents also declined steadily for an overall decrease of 47% for the same period. When the death rate per 1,000 home fire incidents is looked at (Figure 3), there is no steady decline, but rather the rate fluctuates considerably up and down2. In fact, the death rate per 1,000 home fires was 8.1 in 1977 and 7.2 in 2008 for a decrease of 11%. These results suggest that even though the number of home fires and home fire deaths declined similarly during the period, the death rate did not, and when there is a home fire, the fire death rate risk has not changed much for the period.
With home fire deaths still accounting for 2,755 fire deaths or 83% of all civilian deaths, fire safety initiatives targeted at the home remain the key to any reductions in the overall fire death toll. Five major strategies are: First, more widespread public fire safety education is needed on how to prevent fires and how to avoid serious injury or death if
Fire Loss in the U.S. 2008, 8/09 |
7 |
NFPA Fire Analysis and Research, Quincy, MA |
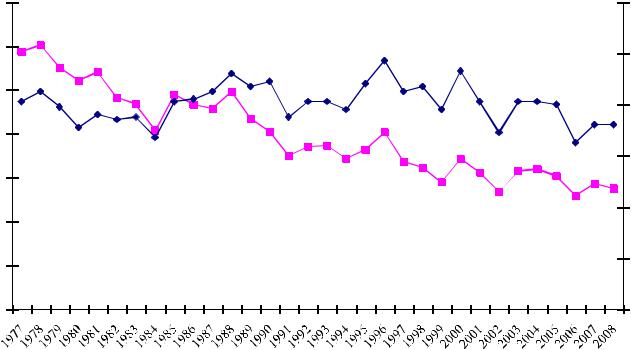
Figure 3.
Civilian Home Fire Deaths and Rates per 1000 Fires, 1977-2008
|
7000 |
|
12 |
|
|
6000 |
5,865 |
10 |
|
|
|
Fires |
||
|
|
|
||
Fire Deaths |
5000 |
|
|
|
|
8 |
1000 Home |
||
|
7.2 |
|||
|
|
|||
4000 |
8.1 |
|
||
|
|
|||
3000 |
|
6 |
||
Home |
|
|
Rates per |
|
2000 |
2,755 |
4 |
||
|
||||
|
|
|||
|
1000 |
|
2 |
Death |
|
0 |
|
0 |
|
|
|
Year |
|
|
Source: NFPA Survey of Fire Departments (1977 2008)
Fire Loss in the U.S. 2008, 8/09 |
8 |
NFPA Fire Analysis and Research, Quincy, MA |
Table 4
Estimates of 2008 Civilian Fire Deaths and
Injuries by Property Use
|
Civilian Deaths |
|
Civilian Injuries |
|
||
|
|
Percent |
Percent |
|
Percent |
Percent |
|
|
Change |
of all |
|
Change |
of all |
|
|
From |
Civilian |
|
From |
Civilian |
Property Use |
Estimate |
2007 |
Deaths |
Estimate |
2007 |
Injuries |
Residential (total) |
2,780 |
-4.0 |
83.7 |
13,560 |
-3.1 |
81.2 |
One-and-Two- |
2,365 |
+0.5 |
71.2 |
9,185 |
-4.8 |
55.0 |
Family Homes1 |
|
|
|
|
|
|
Apartments |
390 |
-24.7 |
11.8 |
3,975 |
+0.6 |
23.8 |
Other Residential2 |
25 |
-16.7 |
0.7 |
400 |
0 |
2.4 |
Non-residential |
120 |
+14.3 |
3.6 |
1,400 |
+3.7 |
8.4 |
Structures3 |
|
|
|
|
|
|
Highway Vehicles |
350 |
-4.1 |
10.5 |
850 |
-43.3** |
5.1 |
Other Vehicles4 |
15 |
-25.0 |
0.5 |
215 |
+22.9 |
1.3 |
All Other6 |
55 |
+22.2 |
1.7 |
680 |
+4.6 |
4.0 |
Total |
3,320 |
-3.2 |
|
16,705 |
-5.5 |
|
Estimates are based on data reported to the NFPA by fire departments that responded to the 2008 National Fire Experience Survey. Note that most changes were not statistically significant; considerable year-to-year fluctuation is to be expected for many of these totals because of their small size.
1This includes manufactured homes.
2Includes hotels and motels, college dormitories, boarding houses, etc.
3This includes public assembly, educational, institutional, store and office, industry, utility, storage, and special structure properties.
4 This includes trains, boats, ships, farm vehicles and construction vehicles.
6 This includes outside properties with value, as well as brush, rubbish, and other outside locations.
**Change was statistically significant at the .01 level.
Fire Loss in the U.S. 2008, 8/09 |
9 |
NFPA Fire Analysis and Research, Quincy, MA |
fire occurs. Information on the common causes of fatal home fires should continue to be used in the design of fire safety education messages. Second, more people must use and maintain smoke detectors and develop and practice escape plans. Third, wider use of residential sprinklers must be aggressively pursued. Fourth, additional ways must be sought to make home products more fire safe. The regulations requiring more childresistant lighters are a good example, as are requirements for cigarettes, with reduced ignition strength (generally called “fire-safe” cigarettes). The wider use of upholstered furniture and mattresses that are more resistant to cigarette ignitions is an example of change that has already accomplished much and will continue to do more. Fifth, the special fire safety needs of high-risk groups, e.g., the young, older adults, and the poor need to be addressed.3.4
Also in 2008, 120 civilians died in nonresidential structure fires, an increase of
14.3%.
Civilian fire death rates by size of community were examined for the 2004-08 period (see Figure 4). The smallest communities (under 2,500 population) had the highest rate. The rate for communities under 2,500 population was more than twice the national average rate.
Of the 2,900 civilians that died in structure fires, 315 or 10.8% died in fires that were intenionally set.
Also in 2008, an estimated 350 civilians died in highway vehicle fires, the lowest it has been since the NFPA started using its current survey methodology in 1977-78.
Civilian Fire Injuries
Results based on data reported to the NFPA indicate that in addition to 3,320 civilian fire deaths, there were an estimated 16,705 civilian fire injuries in 2008. This represents a decrease of 5.5% from a year ago.
Estimates of civilian fire injuries are on the low side, because many civilian injuries are not reported to the fire service. For example, many injuries occur at small fires that fire departments do not respond to, and sometime when departments do respond they may be unaware of injured persons that they did not transport to medical facilities.
The NFPA estimates that there were 13,560 civilians injured in residential properties, a decrease of 3.1%. Of these injuries, 9,185 occurred in oneand two-family homes, and 3,975 occurred in apartments. There were also 1,400 civilians injured in nonresidential structures in 2008.
For the 1977-2008 period, the number of civilian injuries has ranged from a high of 31,275 in 1983 to a low of 16,400 in 2006 for an overall decrease of 48%.
Fire Loss in the U.S. 2008, 8/09 |
10 |
NFPA Fire Analysis and Research, Quincy, MA |
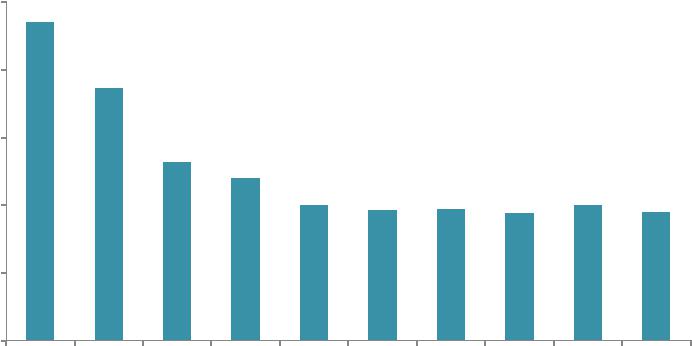
Figure 4. Civilian Fire Deaths per Million Population by Size of Community (2004-2008)
Civilian Fire Deaths per Million People
25 23.5
20 |
18.6 |
15 |
13.2 |
|
12.0
10.0 |
9.6 |
9.7 |
9.4 |
10.0 |
9.5 |
|
|
10
5
0
under 2,500 2,500 to |
5,000 to |
10,000 to |
25,000 to |
50,000 to |
100,000 to |
250,000 to |
500,000 to |
1,000,000 |
4,999 |
9,999 |
24,999 |
49,999 |
99,999 |
249,999 |
499,999 |
999,999 |
or more |
Source: NFPA's Annual Survey of Fire Departments |
Size of Community |
for U.S. Fire Experience (2004 08) |
|
Fire Loss in the U.S 2008, 8/09 |
11 |
NFPA Fire Analysis and Research, Quincy, MA |
there was no consistent pattern going up or down until 1995, when injuries fell roughtly 5,000 in 1994-95 to 25,775. From 1996 to 2002, injuries declined 28% to 18,425 by the end of 2002. From 2002 to 2008, injuries have been in the 17,650 to 18,425 area except for 2006 and 2008.
Property Loss
The NFPA estimates that the 1,451,500 fires responded to by the fire service caused $15,478,000,000 in property damage in 2008. This is an increase of 5.7% from a year ago. (This total figure includes the California Wildfires 2008 with an estimated total property loss of $1,400,000,000).
Wildfire losses typically include many structures and vehicles, but detailed property losses often are not available.
Fires in structures resulted in $12,361,000,000, a highly significant increase of 16.2%. Average loss per structure fire was $24,002, an increase of 19.7%.
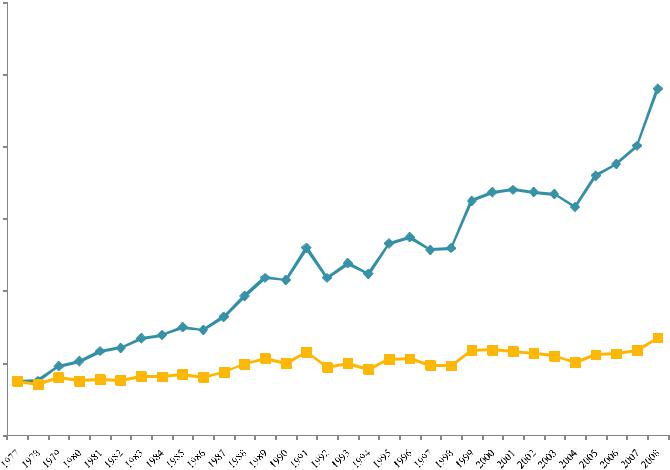
Over the 1977-2008 period, and excluding the events of 9/11/01, the average loss per structure fire ranged from a low of $3,757 in 1977 to a high of $24,002 in 2008 for an overall increase of 538%. When property loss is adjusted for inflation, the increase in the average structure fire loss between 1977 and 2008 is 80%.
Of the property loss in structures, $8,550,000,000 occurred in residential properties, a highly significant increase of 13.3%. An estimated $6,892,000,000 occurred in oneand two-family homes, a significant increase of 10.7%. An estimated $1,351,000,000 also occurred in apartments.
Other property damage figures worth noting for 2008 include: $1,401,000,000 in industrial properties, a highly significant increase of 79.9%, and includes three incidents that resulted in a total property loss of $775,000,000; $459,000,000 in special properties, a significant increase of 26.8%; $307,000,000 in other residential properties, an increase of 95.5%, and includes one incident with $100,000,000 in property loss; and $66,000,000 in educational properties, a significant decrease of 34.0%.
It should be kept in mind that property loss totals can change dramatically from year to year because of the impact of occasional large loss fires. The NFPA provides an analysis of these large loss fires in the November/December issue of NFPA Journal every year.
Fire Loss in the U.S. 2008, 8/09 |
12 |
NFPA Fire Analysis and Research, Quincy, MA |
30,000
25,000
20,000
15,000
10,000
5,000
0
Figure 5. Average Loss per Structure
Fire in the United States (1977 2008)
$24,002
 Unadjusted
 Adjusted for Inflation
$6,756
Source: NFPA Survey of Fire Departments (1977-2008) |
Year |
|
Fire Loss in the U.S 2008, 8/09 |
13 |
NFPA Fire Analysis and Research, Quincy, MA |