

Maxwell_v16_L07_Postprocessing
.pdfLecture 7:
Maxwell Postprocessing
ANSYS Maxwell V16
Training Manual

 Content
A.Maxwell Postprocessing
B.Solution Data
C.Field Overlays
D.Report Plots
E.Fields Calculator
F.Output Variables
G.Design Summery
© 2013 ANSYS, Inc. |
May 21, 2013 |
2 |
Release 14.5 |
 A. Maxwell Postprocessing
Maxwell Postprocessing
–ANSYS Maxwell has very powerful and flexible data management and plotting capabilities.
–The following postprocessing options are discussed in detail in this lecture
•Field Overlays
•2D and 3D Report plot
•Fields Calculator
•Output Variables
•Design Summery
© 2013 ANSYS, Inc. |
May 21, 2013 |
3 |
Release 14.5 |

 B. Solution Data
Solution Data
–Solution Data contains all the information related to executed solution process
–A Solution Data window can also be opened while the solution process is running to check solution convergence as it runs
–Solution Data can be accessed from the menu item Maxwell 3D Results
Solution Data
Profile Tab:
• Contains log of tasks performed by Maxwell during solution process and time taken for each task
• It also reports peak physical memory used for each task
• Listed tasks can be different based on type of solution being carried out
• Tasks that can use HPC licenses also show the number of processors being used.
© 2013 ANSYS, Inc. |
May 21, 2013 |
4 |
Release 14.5 |
 …Solution Data
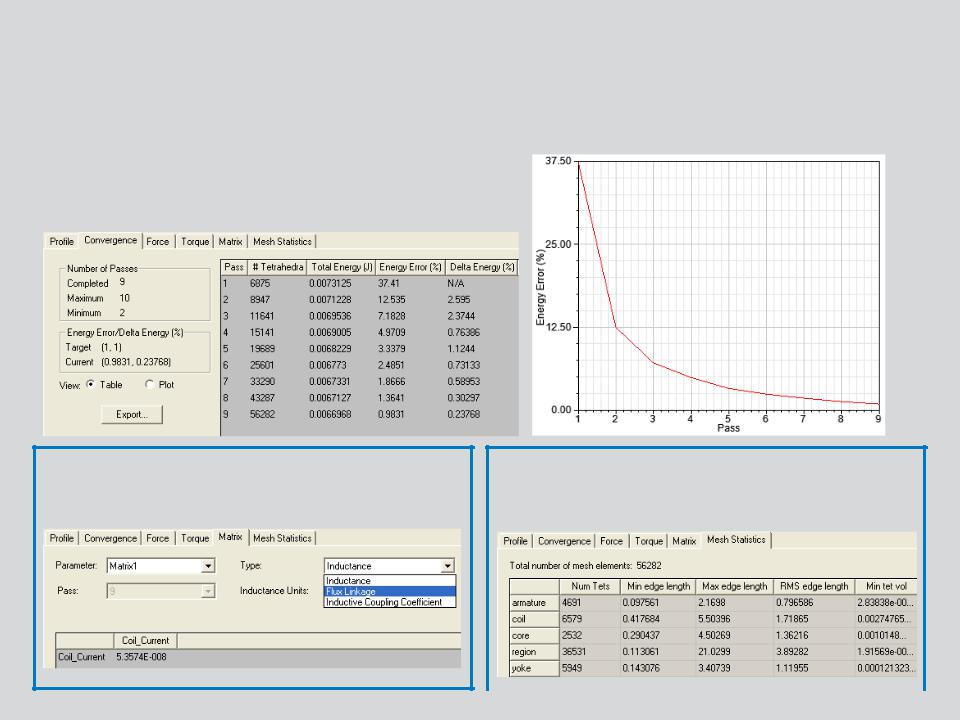
Solution Data (Contd…)
Convergence Tab:
•Reports Adaptive Convergence information
•Available only with Static Solvers
•Can be viewed as a Table or Plot
Force, Torque and Matrix Tab:
•Reports computed values of assigned parameters
Mesh Statistics Tab:
•Reports information related to FEM mesh used for analysis
© 2013 ANSYS, Inc. |
May 21, 2013 |
5 |
Release 14.5 |
 C. Field Overlays
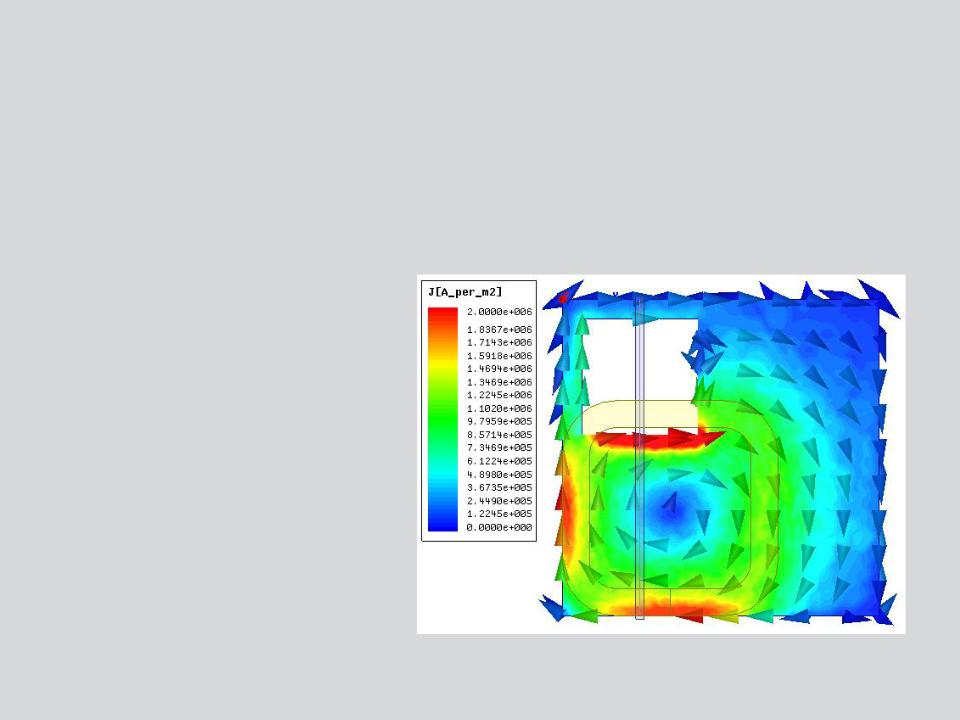
Field Plots
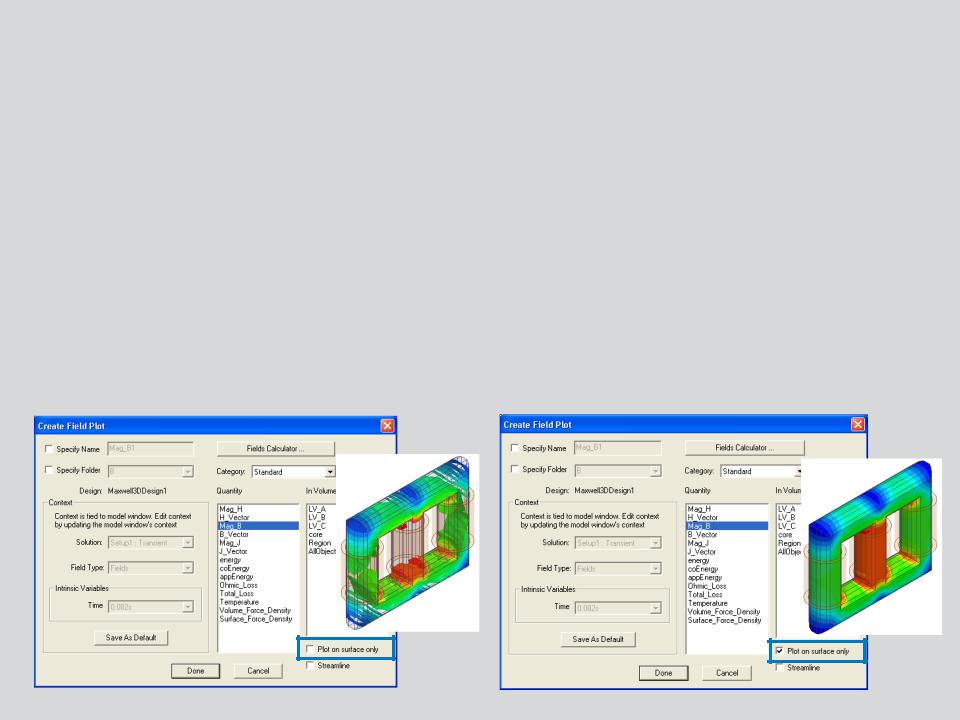
–Field overlays are representations of basic or derived field quantities on surfaces or objects
–A field plot can be a contour plot or a vector plot
–All the basic file quantities (such as B, H, J, E etc) and in-built derived quantities (such as Ohmic Losses, Core Loss, Force Density etc) can be directly used for plotting
–Additional quantities can be derived from basic quantities using Fields Calculator and can be used for plotting
–A field Plot can be created by selecting the object for plot and then selecting menu item Maxwell 3D/2D Fields Fields and selecting required quantity
© 2013 ANSYS, Inc. |
May 21, 2013 |
6 |
Release 14.5 |
 …Plot Attributes
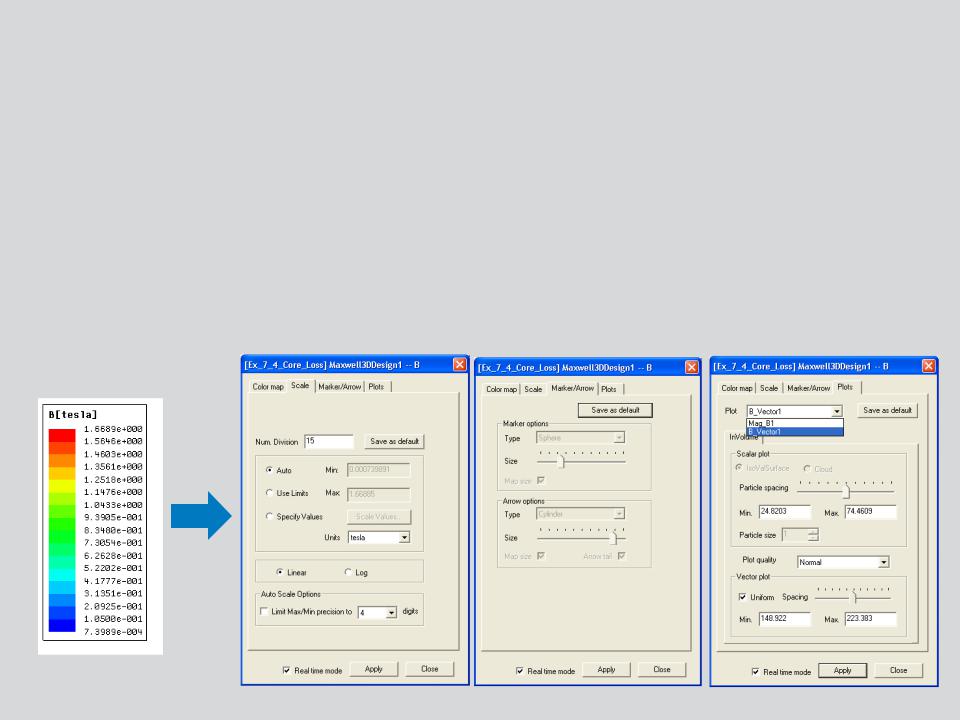
Modifying Plot Attributes
–Many times it required to change the display attributes of the plot to better analyze the results or better viewing of vector plots
–After creation of the plot, double clicking on the legend (Colorkey) will open a dialogue box to modify plot attributes
Color Map Tab: Sets predefined color schemes used for plot Scale Tab: Sets range and Number of Colors of plot
Marker /Arrow Tab: Sets Size and style of arrows in vector plot
Plots Tab: Sets display style of contour plots and density of arrows for vector plot
© 2013 ANSYS, Inc. |
May 21, 2013 |
7 |
Release 14.5 |
 …Field Animation
Field Animation
–Field animation are useful to analyze changes in the field quantity with respect to time or any input parameters
–A Field Animation cane be created by selecting the field plot that needs to be animated and then selecting menu item Maxwell 3D/2D Fields Animate
Note: Field animation for transient solutions must have Save Fields defined
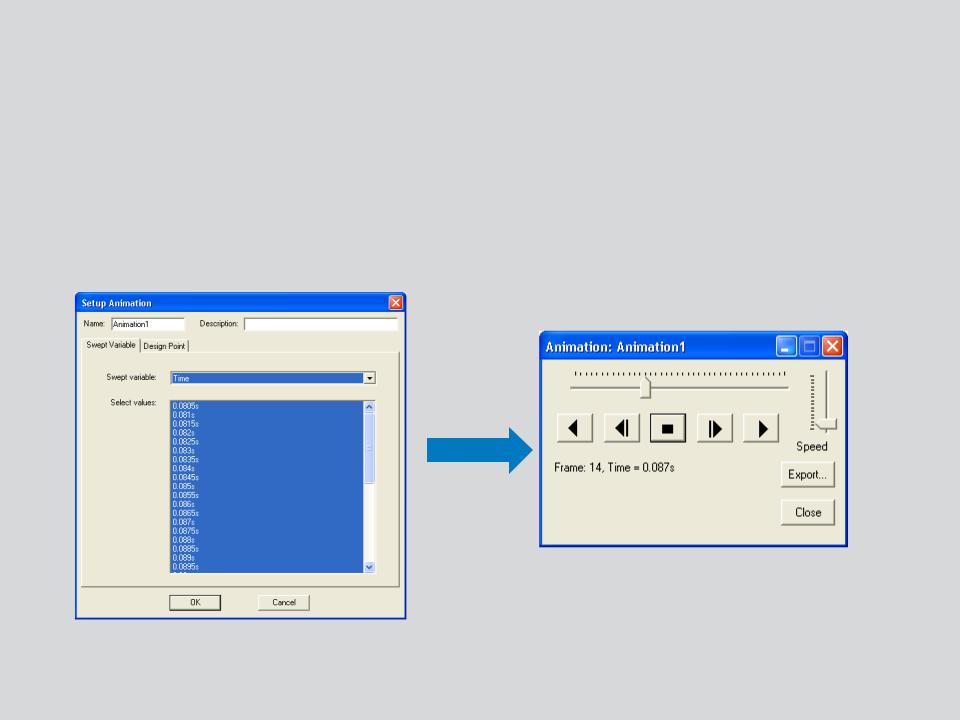
Animation can be setup by selecting swept variable and values for which field is animated
•Animation window enables to Stop, Play or Rewind the animation
•Animation Speed can also be controlled
•Export button will export the animation in AVI or GIF format
© 2013 ANSYS, Inc. |
May 21, 2013 |
8 |
Release 14.5 |
 D. Report Plots
Report Plots
–Report plots can be used to analyze change in any of the output quantities along a curve or with respect to any input parameter or time
–Report Plots can be created by selecting menu item Maxwell 3D Results <Report Type > <Plot Type>
Report Types
Solver Specific Reports
•Plots for solver specific quantities such as core loss, assigned parameters or expression cache etc.
Field Reports
•Plots any field quantities (such as Mag_B, Mag_H etc.) and calculator expressions
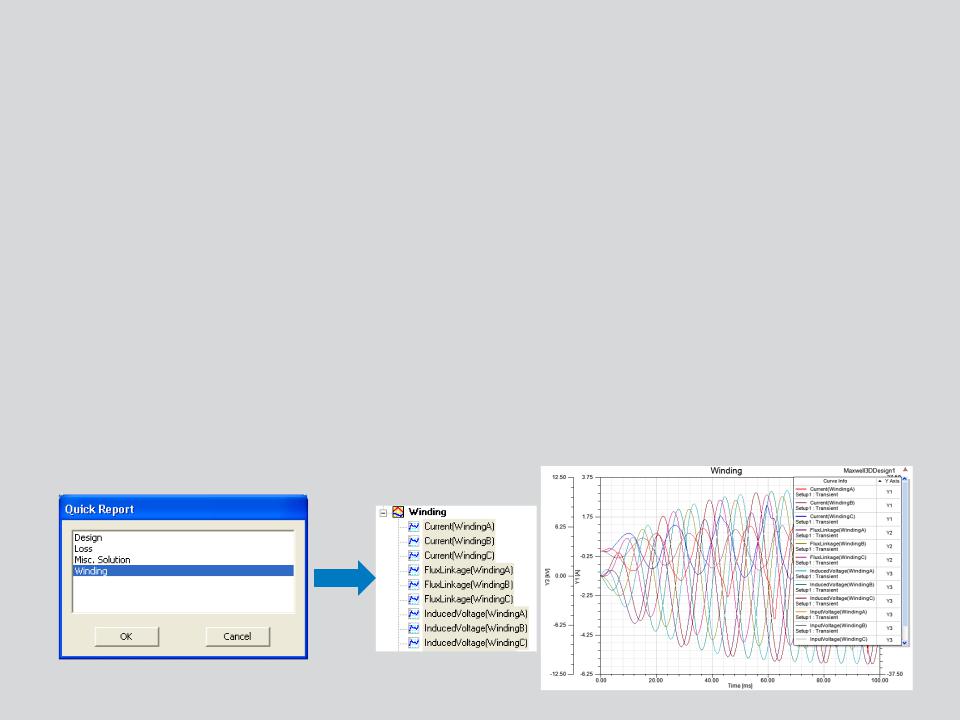
Quick Reports
•Single click report generation for preset quantities such as assigned parameters, Losses, motion
•X axis of plot will be Adaptive passes for Static solver while for transient solver it will be time
© 2013 ANSYS, Inc. |
May 21, 2013 |
9 |
Release 14.5 |

 …Report Plots
Plots Types
Rectangular Plot: Plots multiple traces overlaid in single Plot area
Data Table: Plots traces in tabular form
Rectangular Stacked Plot: Plots multiple traces stacked vertically
3D Rectangular Plot: Plots 3D surface of output against two inputs
© 2013 ANSYS, Inc. |
May 21, 2013 |
10 |
Release 14.5 |