

vk.com/id446425943
The global perspective on prime property and investment

vk.com/id446425943
The Wealth
Report 2019
COMMISSIONED BY
Lord Andrew Hay
EDITOR
Andrew Shirley
GLOBAL HEAD OF RESEARCH
Liam Bailey
WRITTEN BY
KNIGHT FRANK RESEARCH
Tom Bill
Anthony Duggan
Kate Everett-Allen
Gráinne Gilmore
Flora Harley
Nicholas Holt
David Ji
Sophia King
William Matthews
Lily Nguyen
CHIEF ECONOMIST
James Roberts
GROUP HEAD OF MARKETING,
COMMUNICATIONS & DIGITAL
Simon Leadbetter
CREATIVE HEAD OF PUBLICATIONS
Christopher Agius
HEAD OF PUBLICATIONS
Kate Mowatt
HEAD OF CORPORATE
COMMUNICATIONS
Alice Mitchell
SUB-EDITOR
Louise Bell, Sunny Creative
COVER
Ben Fearnley
ILLUSTRATIONS
Muti
SHOUT
DATA VISUALISATIONS
Nicholas Rapp
PRINTED BY
Optichrome
ALL KNIGHT FRANK CONTACTS: firstname.familyname@knightfrank.com
Defi nitions
UHNWI
Ultra-high-net-worth individual – someone with a net worth of over US$30 million excluding their primary residence
HNWI
High-net-worth individual – someone with a net worth of over US$1 million excluding their primary residence
PRIME PROPERTY
The most desirable and most expensive property in a given location, generally defined as the top 5% of each market
by value. Prime markets often have a significant international bias in terms of buyer profile
NOW AVAILABLE
View The Wealth Report and properties from around the world on your device today
knightfrank.com/wealthreport
Data sources
Numbers from Knight Frank’s proprietary research and from carefully selected third parties lie at the heart of The Wealth Report’s findings. Some of the report’s key sources are detailed below.
PROPRIETARY RESEARCH
The PIRI 100 Now in its 12th year, the Knight Frank Prime International Residential Index (PIRI 100) tracks the movement in luxury prices across the world’s top residential markets.
The Index, compiled using data produced by our research teams around the world, covers major financial centres, gateway cities and second home hotspots – both coastal and rural – as well
as leading luxury ski resorts.
The Attitudes Survey The 2019 instalment of this unique survey is based on responses provided during October and November 2018 by 600 private bankers and wealth advisers who between them manage over US$3 trillion of wealth for UHNWI clients.
Special thanks to Alfa Bank, ANZ Bank Australia, ANZ Bank New Zealand, Barclays, Cathay United Bank, Citi Private Bank, CTBC (Philippines) Corporation, ICEA LION Asset Management, Macquarie Private Bank, Maybank Philippines, Nedbank Private Wealth, NIC Group, RBC Wealth Management, Sumitomo Mitsui Trust Bank Ltd, TrustPlutus Wealth Managers (India) and
UOB Private Bank for their participation.
THIRD PARTY DATA
GlobalData WealthInsight Provider of this year’s high-net-worth wealth distribution data, GlobalData WealthInsight delivers high quality intelligence on global HNWIs and UHNWIs. Delivering a suite of research products and bespoke services, it is an intuitive and vital resource for those working and hoping to work with wealthy individuals and their families, including wealth managers, not-for-profit organisations, schools and universities, casinos, estate agencies, investment professionals and luxury brands. info@wealthinsight.com
Superyacht Intelligence With the industry’s largest in-house team of researchers and analysts, working alongside the most respected market commentators, the Superyacht Intelligence Agency is the most respected source of market analysis, insight and consultancy focused solely on this specialist sector. consultancy@superyachtintelligence.com
WINGX Founded in 2011, WINGX Advance provides business intelligence for the global private jet market spanning the entire supply chain, from airports, operators and manufacturers to industry investors and financial analysts. office@wingx-advance.com
Welcome to The Wealth Report
13th Edition
LORD ANDREW HAY
GLOBAL HEAD OF RESIDENTIAL
THE WEALTH REPORT
Predicting what the next 12 months have in store for our clients has proved to be an interesting process. The multitude of global, political and economic concerns
that I mentioned on this page a year ago, far from being resolved, have increased and become more complex.
Nevertheless, I am optimistic about the year ahead. There may be challenges, but there will also be considerable opportunities for our clients as markets flex. In this year’s edition of The Wealth Report we highlight residential and commercial markets across the world that offer opportunities and options for those looking to invest in property.
To help our clients access these opportunities, we have created a Private O ce dedicated to supporting your property needs. Find out more on page 40. Our global network has also expanded, with new associations in New Zealand and an expanded platform in Europe and China, and we see great opportunities in Japan over the next five years.
With clear political leadership lacking in many parts of the world, private individuals and corporations are increasingly taking up the reins when it comes to delivering a whole range of public goods. In this edition I’m very proud that we have been able to persuade some of the world’s leading conservationists, including Dr Lisbet Rausing, Kristine Tompkins, Jochen Zeitz, Caroline Rupert and Sir Richard Branson, to talk to us about how they have been using their wealth and property to protect the environment. Their work is fascinating and inspiring.
Our annual update on the glamorous world of investments of passion also offers an intriguing glimpse of what is happening outside the world of real estate.
As our client base of UHNWIs and family offices continues to grow, our focus on service becomes even greater as we aim to provide market-leading advice and insight backed up by a totally customer-centric approach. Being privately owned and agile allows us to put our clients first, especially at those challenging times when they need us most.
I do hope you enjoy this edition of The Wealth Report. As always, my partners and I are keen to support and guide you.
1 KNIGHTFRANK.COM

vk.com/id446425943
THE WEALTH REPORT
04.
Executive summary
A whistle-stop tour of the key findings from the 2019 edition of The Wealth Report, and our predictions for the year ahead
11.
Global wealth trends
The dragon still packs a punch
Results from this year’s analysis of global UHNWI populations page 12
London calling
The world’s top spots, according to the Knight Frank City Wealth Index – and five cities to watch
page 18
The wind and the waves
An insight into the world’s private jet and superyacht fleets page 22
The social network
What social media can tell us about where our readers spend their time page 24
Risk and reward
Our annual round-up of the issues affecting global wealth flows page 26
06.
The big interview
Businessman Jochen Zeitz talks exclusively to The Wealth Report about why he believes business can help to save the planet
29. |
41. |
Property |
Investment |
market |
outlook |
update |
Changing tack |
|
Five key trends shaping |
Turning point |
future investment decisions |
The latest Knight Frank |
page 42 |
Prime International |
|
Residential Index (PIRI 100) |
Portfolio management |
page 30 |
Global opportunities in |
|
commercial real estate |
What, where, why |
page 46 |
An overview of key property |
|
investment trends |
The new world |
page 36 |
Our prime residential |
|
forecasts for 2019 |
Singapore king |
page 54 |
Property legend Raj Kumar |
|
on how he made it big |
Next neighbourhoods |
page 38 |
The residential hotspots set |
|
to outperform the rest |
Take control |
page 58 |
Top tips for family offices |
|
building property portfolios |
|
page 40 |
|
65. Contents
Luxury spending
Born to rewild
The conservationists working to protect some of the world’s most precious habitats
page 66
Record breakers
The Knight Frank Luxury Investment Index
page 72
Blockbuster
The impact of blockchain on the world of art and luxury investment page 76
Casks of gold
Enter the world of whisky, the new luxury investment of choice
page 78
Keeping a cool head
Practical tips for getting most out of investments of passion page 84
85.
Databank
Global wealth distribution and
Attitudes Survey 2019 results
92.
Editor’s letter
Andrew Shirley reflects on some of the issues raised in our 2019 edition
2 | KNIGHTFRANK.COM |
3 | KNIGHTFRANK.COM |

vk.com/id446425943
EXECUTIVE SUMMARY
AT A GLANCE
4 |
5 As wealth increases, 2019 will see governments |
Hard Brexit, no Brexit, Brexit-lite: |
settle into two camps: the first will try to attract |
whatever the outcome, London |
more of it; the second will seek to push it away. |
will remain the leading global |
In the former camp sits Italy, where a new “non- |
wealth centre in 2019. With the |
dom” regime will kick fully into gear this year, |
world’slargestUHNWIpopulation, |
resulting in a growing band of wealthy migrants |
the city sweeps the board in our |
enjoying la dolce vita in return for a fixed tax |
annual City Wealth Index, pushing |
payment of €100,000 on their global income. |
its only serious rival, New York, |
Conversely, Singapore, Australia, New Zealand, |
into second place. |
Canada, the UK and others will make wealthy |
Liam Bailey, Knight Frank’s Global Head of Research, provides a whistle-stop |
non-residents jump through ever larger hoops |
to access their property markets. |
|
tour of the key findings from the 2019 edition of The Wealth Report, |
|
and predicts the shape of the year ahead |
|
t is a privilege to work on The Wealth Report. Each year, I sit down with |
|
the editor, Andrew Shirley, six months before publication, to plan the |
|
content. The objective is simple – to explain how private wealth is |
|
shaping property markets globally. |
|
IBut in order to achieve a more rounded picture, we also take an in-depth look |
Wright |
at the things that interest and influence our clients, from art to whisky and fine |
John |
wine, to private jets, superyachts and classic cars. I hope you enjoy the ride. |
Image: |
1 |
|
Despiteadarkeningeconomicoutlook,wealth creation will remain a constant in 2019. The global UHNWI population is forecast to
rise by 22%over the next five years, meaning an extra 43,000 people will be worth more than US$30 million by 2023.
2 Asia’s strong economic performance (it hosts eight of the top ten countries with the fastest growing UHNWI populations) means 2019 will be the year the number of US$ millionaires globally exceeds 20 million for the first time. India will lead five-year growth with 39%, followed by
and China (35%).
3
Existing UHNWIs expect their wealth to increase over the next 12 months, with confidence most marked in the US where 80% expect to be better off.
|
|
|
|
|
|
|
|
|
|
|
|
|
|
|
|
|
|
|
|
|
|
|
|
The Wealth Report |
|
|
9 As wealth moves more rapidly around the world, |
|
|
|
|
|
|||||||||||||||||
|
|
investors will become increasingly active in their |
|
|
|
|
|
|||||||||||||||||
|
|
investment strategies. Rising interest rates |
|
|
|
|
|
|||||||||||||||||
|
|
and the end of quantitative easing mean we are |
|
|
|
|
|
|||||||||||||||||
|
|
reaching the end of the “everything bubble”. |
|
|
|
|
|
|||||||||||||||||
|
|
In the past decade it was enough to buy classic |
|
|
|
|
|
|||||||||||||||||
|
|
cars, art or property and the generosity of central |
|
|
|
|
|
|||||||||||||||||
|
|
|
|
|
10 |
|
||||||||||||||||||
|
|
banks would help deliversuper-chargedreturns. |
|
|
|
Investors in 2019 will increase their exposure |
||||||||||||||||||
|
|
As this process unwinds property investors will |
|
|
|
|
to education facilities, student housing |
|||||||||||||||||
|
|
become increasingly focused on income, asset |
|
|
|
|
and “last mile” logistics property, as well as |
|||||||||||||||||
|
|
management and developmentopportunities. |
|
|
|
|
targeting office investment in key tech and |
|||||||||||||||||
|
|
|
|
|
|
|
|
|
|
|
|
|
|
|
|
|
|
|
|
|
|
|
|
innovation markets. |
|
|
|
|
|
|
|
|
|
|
|
|
|
|
|
|
|
|
|
|
|
|
|
|
|
|
|
|
|
|
|
|
|
|
|
|
|
|
|
|
|
|
|
|
|
|
|
|
|
Expect slowerpricegrowthin key luxury |
|
|
|
|
|
|
|
|
|
|
|
|
|
|
|
|
|
|
|
|
|
|
|
|
residentialmarkets,withmoremarketsseeing |
8 |
The desire for mobility means wealth |
|
|
|
|
values fall this year. As values adjust, buyers |
||||||||||||||||||
|
exporting nations will begin to watch |
|
|
|
|
will feel the balance of power shift in their |
||||||||||||||||||
|
their currency and foreign reserves |
|
|
|
|
favour. The search for deals will combine |
||||||||||||||||||
|
increasingly closely. Recent capital |
|
|
|
|
with currency movements to propel more |
||||||||||||||||||
|
controls in China will remain in |
|
|
|
|
purchasers into 2018’s “most unfashionable |
||||||||||||||||||
|
place, while in India a two-year 144% |
|
|
|
|
market” – London. |
||||||||||||||||||
|
increase in outbound remittances |
|
|
|
|
|
|
|
|
|
|
|
|
|
|
|
|
|
|
|
||||
|
will create risks of additional controls |
|
|
|
|
|
|
|
|
|
|
|
|
|
|
|
|
|
|
|
||||
|
|
|
|
|
|
|
|
|
|
|
|
|
|
|
|
|
|
|
||||||
|
– but the strength of economic growth |
|
|
|
|
|
|
|
|
|
|
|
|
|
|
|
|
|||||||
|
will delay action in 2019 at least. |
|
|
|
|
|
|
|
|
|
|
|
||||||||||||
|
|
|
|
|
|
|
11 |
Beyond property, interest in the world of |
||||||||||||||||
|
|
|
|
|
|
|
|
|
|
|
|
|
|
|
|
|
|
|
|
|||||
|
|
|
|
|
|
|
|
|
|
|
|
|
|
|
|
|
|
|
|
|||||
|
|
|
|
|
|
|
|
|
|
|
|
|
|
|
|
|
|
|
|
|||||
|
|
|
|
|
|
|
|
|
|
|
|
|
|
|
|
|
|
|
|
|
|
|
|
collectables will continue to expand into new |
7 |
As some governments race to attract |
|
|
|
|
|
|
|
|
|
|
|
|
|
|
|
areas. Expect a boom in investment in one |
|||||||
|
|
|
|
|
|
|
|
|
|
|
||||||||||||||
|
|
|
|
|
|
|
|
|
||||||||||||||||
|
wealth, a backlash will grow with |
|
|
|
|
|
|
|
|
|
|
|
|
|
|
|
|
|
|
|
|
|
drink in particular. A 580% rise over the past |
|
|
|
|
|
|
|
|
|
|
|
|||||||||||||||
|
|
|
|
|
|
|
|
|
|
|
|
|
|
|
|
|
|
|
|
|
|
|||
|
the OECD and the EU, among others, |
|
|
|
|
decade in Knight Frank’s Rare Whisky 100 |
||||||||||||||||||
|
placing more countries under the |
|
|
|
|
Index, new direct flights between Edinburgh |
||||||||||||||||||
|
microscope as efforts to combat tax |
|
|
|
|
and Beijing, 40% annual growth in sales |
||||||||||||||||||
|
evasion and avoidance increase. |
|
|
|
|
of Scotch to India and China, and a new |
||||||||||||||||||
|
|
|
|
|
|
|
|
|
|
|
|
|
|
|
|
|
|
|
|
|
|
|
|
record sale price of £1.2 million for a single |
|
|
|
|
|
|
|
|
|
|
|
|
|
|
|
|
|
|
|
|
|
|
|
|
bottle should have Scotland’s distillers |
|
|
|
|
|
|
|
|
|
|
|
|
|
|
|
|
|
|
|
|
|
|
|
|
raising a dram or two. |
|
|
|
|
|
|
|
|
|
6 Hoopsornot,thewealthywillcontinue |
|
|
|
|
|
|
|
|
|
|
|
|
|
|
|
|
|
|
|
to demand access to global markets, |
|
|
|
|
|
|
|
|
|
|
|
|
|
|
|
|
|
|
|
especially as emerging economies see |
12 |
|
|
|
|
|
|
|
|
|
|
|
|
|
|
|
|
|
|
growth rates slow and the search for |
2019 will be the year when theorising |
|
|
|
|
|
|
|
||
|
|
|
|
|
|
|
|
|
diversification grows. A record 26% |
over the potential impact of blockchain |
|
|
|
|
|
|
|
|
|
|
|
|
|
|
|
|
|
|
|
|
|
|
|
|
|||||
|
|
|
|
|
|
|
|
|
|
|
|
|
|
|
|
|
|||
|
|
|
|
|
|
|
|
|
of global UHNWIs will begin to plan |
gives way to an appreciation of what it can |
|
|
|
|
|
|
|
|
|
|
|
|
|
|
|
|
|
|
for emigration this year, and to help |
achieve: helping to prove the authenticity |
|
|
|
|
|
|
|
|
|
|
|
|
|
|
|
|
|
|
|
|
|
|
|
|
|
||||
|
|
|
|
|
|
|
|
|
|
|
|
|
|
|
|
||||
|
|
|
|
|
|
|
|
|
them a record number of countries |
of the US$2 trillion of luxury goods sold |
|
|
|
|
|
|
|
|
|
|
|
|
|
|
|
|
|
|
will offer citizenship and residency |
annually; confirming the ownership of art; |
|
|
|
|
|
|
|
|
|
|
|
|
|
|
|
|
|
|
|
|
|
|
|
|
|
||||
|
|
|
|
|
|
|
|
|
through investment schemes, with |
enabling fractional ownership of some of |
|
|
|
|
|
|
|
|
|
|
|
|
|
|
|
|
|
|
|
|
|
|
|
|
|
||||
|
|
|
|
|
|
|
|
|
Moldova and Montenegro the latest |
the world’s most desirable collectibles; oh, |
|
|
|
|
|
|
|
|
|
|
|
|
|
|
|
|
|
|
|
|
|
|
|
|
|
|
|||
|
|
|
|
|
|
|
|
|
|
|
|
|
|
|
|
|
|||
|
|
|
|
|
|
|
|
|
to offer themselves as wealth havens. |
and facilitating the creation of US$170,000 |
|
|
|
|
|
|
|
||
|
|
|
|
|
|
|
|
|
|
|
|
|
|
|
|
||||
|
|
|
|
|
|
|
|
|
|
|
digital cats (yes, really). |
|
|
|
|
|
|
|
|
|
|
|
|
|
|
|
|
|
|
|
|
|
|
|
|
|
|
||
|
|
|
|
|
|
|
|
|
|
|
|
|
|
|
|
|
|
|
|
|
|
|
|
|
|
|
|
|
|
|
|
|
|
|
|
|
|
|
|
4 | KNIGHTFRANK.COM |
5 | KNIGHTFRANK.COM |

vk.com/id446425943
BUSINESS WITH A CONSCIENCE
I T ’ S T I M E F O R
PLAN B
Jochen Zeitz, one of the world’s most successful and influential businessmen, talks exclusively to The Wealth Report about his most ambitious challenge to date and why business has a crucial role to play in saving the planet
Words: Andrew Shirley,
Editor, The Wealth Report
When Jochen Zeitz was appointed CEO of Puma in 1993, the German sportswear manufacturer was going nowhere. Within 13 years he’d boosted
the company’s share price by 4,000%, propelled Puma into third place in its sector behind global behemoths Nike and Adidas, and overseen the sale of a majority stake in the business to the Gucci-owning luxury goods giant PPR, now known as Kering.
It was an impressive performance, particularly for somebody aged just 30 at the time, and with no previous track record of running a global business. But persuading customers to splash out on snazzy training shoes has, arguably, been the least of Mr Zeitz’s achievements.
My journey to find out what drives him has taken me acrosscontinents,fromthecrampedbasementofatrendy west London music venue – more on that later – to the iconic Victoria & Alfred waterfront district of Cape Town in South Africa, before I eventually get to chat extensively with the man himself on a damp, blustery night in one of London’s leafiest neighbourhoods.
Other interviewers have referred to Mr Zeitz’s athletic marathon-runner’s physique or his penchant for sharp
black suits and crisp white shirts (always worn without a tie), but when I walk out of the wintry weather into a cosy pub in Richmond it’s a slightly soggy, windswept man with a small dog by his feet who beckons me over with a friendly wave to join him at a table in the corner.
I apologise for dragging him out on such a miserable evening, especially as he’s just back from an extended honeymoon in Africa with his wife, the film producer Kate Garwood, and their two young children, but he says it’s no problem. “I like being outside and Foxy [a dog of indeterminate parentage that the family rescued from ‘death row’ in Los Angeles] needed a walk.”
Broad horizons
This love of the great outdoors, nurtured, he says, during a childhood spent in the German countryside helps to explain why he chose Richmond, with its great expanse of ancient parkland, when setting up home in London three years ago. “I’m not really a city centre kind of guy,” he says.
In fact, it also explains a lot about Mr Zeitz and his intertwined passions and beliefs – including his deep love of Africa and his even deeper commitment to the
Image: Mia Collis
environment. Africa has been a recurring theme throughout his life. During his revival of Puma, the brand sponsored some of the continent’s national football teams, kitting the players out in controversial skintight shirts. On a personal level, he has owned Segera, a 50,000-acre conservation reserve in northern Kenya with an award-winning eco-safari lodge, since 2005. He also co-founded the Zeitz Museum of Contemporary Art Africa (Zeitz MOCAA) in Cape Town, which was opened by Archbishop Desmond Tutu in 2017.
Outside the box Africa is a recurring theme in the life of Jochen Zeitz, pictured here at his lodge, Segera, in Kenya
The big interview
So what drew him to Africa? “I used to travel a lot in Asia and LatinAmerica,butsomehowwhen I came to Africa it just kind of felt like home,” he explains. “To begin with it was the incredible nature thatIsawwhenItravelledthrough the continent. Then seeing more of its creativity and diversity was something that fascinated me.”
That diversity is on full display at the Zeitz MOCAA, a converted dockside grain silo that houses an eclectic mix of works assembled by Mr Zeitz over the past 11 years. Unusually,butperhapsunsurprisinglygivenhisethos,thecollection was created more to make a statement than for personal pleasure.
“I felt that there was an opportunity and a need for a major museum in Africa, and because nobodyhaddoneitIjustsaid,well, let me. Art has a huge role to play whenitcomestochangingpeople’s perceptions and ideas. The collection is very much built around the objective of changing people’s minds about the environmental, social, personal, political topics thatartistsarekeentotalkabout.”
Having been lucky enough to visit the museum with my son, I put it to Mr Zeitz that many of the works seem, in the words of a ten-year-old boy, quite dark. “It’s challenging, for sure,” he agrees.
“There are a lot of issues in Africa, and the world, and art is not necessarily there to make you feel comfortable. It’s a great comment for a young person to make. That’s when the dialogue starts. It’s like, why is it what it is? What needs to change in the world to make it better?”
Looking at the world with a different eye is, Mr Zeitz says, something he learned in Africa. “I started looking at time in a different way and the relevance of today versus tomorrow and the past. I felt that I wanted to contribute by doing something meaningful in Africa. A lot
6 | KNIGHTFRANK.COM |
7 | KNIGHTFRANK.COM |

vk.com/id446425943
BUSINESS WITH A CONSCIENCE
of my ideas originated there, and have since turned into the global initiatives that I support and am involved in.” Mr Zeitz’s underlying philosophy, developed during the rehabilitation and rewilding of Segera, a former cattle farm which at the time of his purchase was overgrazed, heavily poached and not working in harmony
with the local community, is that of the 4Cs – balancing conservation, community, culture and commerce. These are the principles which, he believes, should drive all businesses.
He first started trying to use his 4C approach to influence the wider world with the launch in 2008 of the Zeitz Foundation of Intercultural Ecosphere Safety. This was quickly followed a year later by The Long Run initiative, which Mr Zeitz created to bring together ecologically minded tourism businesses suchasSegeraandestablishbestpractice in line with the 4Cs.
Today,LongRunmembersmanageover14millionacres oflandworldwide,butitwashisground-breakingdecision in 2011 to develop and publish full environmental profit and loss accounts for Puma and its supply chain that
really put him in the limelight as somebody campaigning to change the way the world does business.
Putting a value on Puma’s use of resources, water consumptionandcarbonemissionswasthemostefficient way, Mr Zeitz believes, to mitigate the company’s impact on the environment and its use of raw materials.
“Businesses rely on natural resources and if we do not stop working against nature we will run into severe shortages in the future. If we want to be commercially sustainable, we also have to be ecologically sustainable.”
So, has the move had the impact he hoped? Have environmental profit and loss balance sheets gone mainstream? “I wish this could one day become a standard, but that’s something that can only be brought about by governments,” hesays.“Asatool,though,moreandmore companies are using it and that’s great
progress. Businesses are realising that they need to understand where their environmental footprint is.”
Mr Zeitz’s most recent, and arguably most ambitious, push to bring more businesses on board with his vision is The B Team, a global venture co-founded with
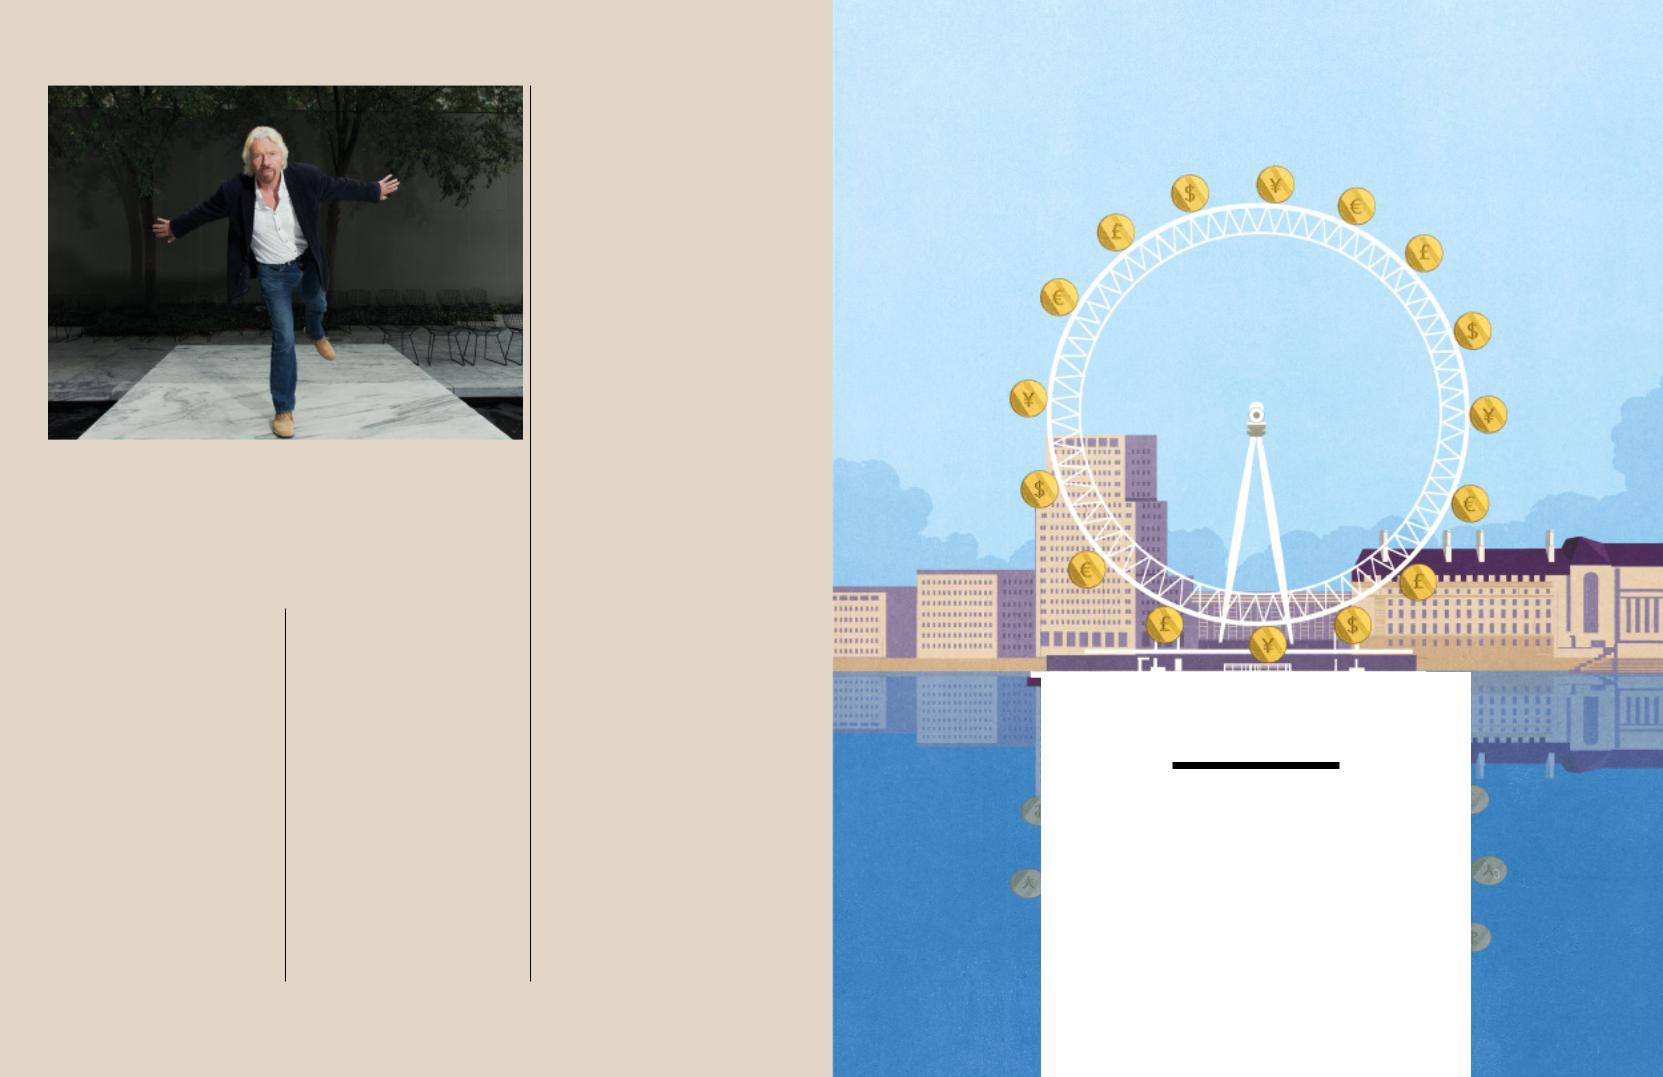
the serial entrepreneur and philanthropist Sir Richard Branson (see page 10), to encourage more sustainable ways of doing business for the wellbeing of people and the planet – literally to create a plan B.
“Plan A, where business has been primarily motivated by profit, is no longer an option,” he says. “If you consider that globally 60% of environmental impacts are generated by the 1,000 biggest companies in the world, you know that to solve problems you need to get businesses involved. The B Team aims to show leadership that promotes a different way of thinking.”
A magic touch
One area where The B Team has played a key role was helping to push through the Paris Climate Change accord in 2016. Laidback throughout our conversation, Mr Zeitz becomes more animated when I ask how he feels about the decision of the US to withdraw from the agreement. “If anything, it has united the world even more when it comes to having clear climate goals and sticking to the climateagreement.Nobodywillstopthat,inmyopinion.” His Instagram feed makes it clear he has no time for climate change deniers.
He’s also scathing about Brexit, hinting that he might not have bought his Richmond home if he’d known what was coming. “I understand the fears that have been created, but if you look at the pure economics and where the world needs to be, it makes no sense. Ultimately, you have to have the end goal in mind, and thinking that you can do this on your own is wishful thinking. As a German who grew up in the wake of World War Two, I believe the only thing that can save us is unity.”
When it comes to bringing people together and creating winning teams, whether it’s persuading Usain Bolt to wear Puma shoes or teaming up with individuals such as Sir Richard Branson who share the same vision, Mr Zeitz seems to have a magic touch.
So what’s his secret? What does he think makes him so persuasive? “I have no idea. It’s a very good question. I just don’t give up.” So, tenacious rather than persuasive, I venture? “Yes, probably.”
This brings me back to the aforementioned evening spent in the basement of the Notting Hill Arts Club in west London. After finding out I was keen to interview him, Mr Zeitz invited me to a fundraising concert for an all-female anti-poaching team at Segera. He mentioned he would be playing a “few tunes” with some friends. Those few tunes turned out to be a virtuoso guitar
performance using a complex-looking percussive technique that involves tapping and banging various parts of the instrument as well as playing it conventionally. The friends were two of the world’s best acoustic guitarists, Mike Dawes and Justin Sandercoe.
When we meet later I ask how on earth, given his punishing schedule, he has found time to learn to play the guitar like a professional, and how long it took to reach that point. “Five years,” he replies. I look stunned. “But I practise every day. I take my guitar everywhere,” he adds. “It’s a complicated way of playing, but I like a challenge. I don’t like doing things halfway. When I want to do something, I try to do it well.”
That’s a pretty neat way of summing up Jochen Zeitz. He could have settled for being the youngest ever CEO of a German listed company, or for successfully rewilding a large chunk of Africa, or for co-founding an iconic Cape Town art gallery voted one of the world’s best visitor attractions in 2018. But why stop there? Why do things halfway when there’s a whole world out there to save? When our fascinating time together in the pub draws to a close he says goodbye and strides out into the rain, Foxy trotting alongside, to get on with the job.
The big interview
The great persuader opposite: Mr Zeitz has a talent for getting the right people on board, such as Usain Bolt for Puma below: a work in Cape Town’s “challenging” Zeitz MOCAA
For more inspirational rewilding stories, turn to page 66
8 | KNIGHTFRANK.COM |
9 | KNIGHTFRANK.COM |
vk.com/id446425943
BUSINESS WITH A CONSCIENCE
ENTREPRENEUR SIR RICHARD BRANSON,
CO-FOUNDER OF THE B TEAM, TALKS TO THE WEALTH REPORT ABOUT WHY THE ORGANISATION’S ROLE IS SO IMPORTANT
What inspired you to form The B Team with Jochen Zeitz?
The B Team was founded in the belief that the private sector can, and must, redefine both its responsibilities and its own terms of success. This was inspired by the growing trust gap between citizens and governments, between individuals and institutions, and between profits and values.
We recognised that businesses have often been a major part of the problem. With the launch of The B Team, we wanted to show that we, as business leaders, can also drive sustainable solutions.
Since then, we’ve been working with civil society and others to find ways to transform business into a force for good. The bold example of B Team Leaders such as Paul Polman,MarcBenioffandBobCollymoreshows us every day what it means to place purpose
and conviction at the core of your business and yourpersonalmission.Togetherwelearn,share, collaborate and push each other forward on the most pressing issues of our time.
The B Team’s aims are hugely ambitious, from improving social justice to treating the environment better. What would you say is its most important role?
As B Team Leaders, I think the most important contributions we can make are leading by example, using our voice and scaling solutions. This is how we can help to create an environment for change.
At the same time, we must remember to listen. That’s how we learn to build the new practices that meet those goals, whether they involve respecting and strengthening human rights and the rule of law, advocating for climate action or eradicating modern slavery.
And where we see progress stall, we will push for a higher level of ambition.
How satisfied are you with progress so far, and what would you say are the Team’s biggest successes to date?
I’m very proud of our accomplishments. Perhaps most importantly, behind all these achievements lie the strong collective and individual commitments of our Leaders. Together, we’ve played a pivotal role in advancing global policy in line with our agenda and shifting business norms and practices.
In 2015, The B Team was instrumental in ensuring that a commitment to net zero emissions by 2050 was included in the text of the Paris Agreement. At the time, many felt that this was far too ambitious. However, we knew it was not only possible, but necessary. Today we see more business and political leaders recognising the need to adopt this goal and act on it.
In the current fractious global geopolitical environment, is The B Team’s role now more important than when it was formed?
In an ideal world, The B Team wouldn’t be needed. And with enough ambition and action we might no longer be needed in the future.
But the last few years have seen many countries move backwards. Public discourse on climate change, migration and digital transformation, to name just a few issues, has become divisive, polarising our communities and undermining any form of meaningful collaboration to fight injustice, inequality and environmental threats.
In this environment, businesses have to shoulder an even greater burden. And as trust in government continues to erode, The B Team, in concert with business and civil society, must ask governments to step up. If we can achieve a critical mass, we have a chance of creating a fairer, greener and more human economy. Working together, we can build a principled and purpose-driven private sector and demonstrate that business can be a force for good.
10 | KNIGHTFRANK.COM
Global wealth trends
The big issues shaping the decisions of the wealthy
The dragon still packs a punch |
The wind and the waves |
The latest forecast of global UHNWI |
On the move with the world’s private jet |
population growth |
and superyacht fleets |
– page 12 |
– page 22 |
London calling |
The social network |
The Knight Frank |
Where our readers spend their time, |
City Wealth Index |
based on social media activity |
– page 18 |
– page 24 |
Risk and reward
The factors driving the flow of wealth around the world
– page 26

vk.com/id446425943
MAPPING UHNWI POPULATIONS
Tense times The impact of any further escalation in trade tensions between the US and China is likely to be felt across the world
The dragon still packs a punch
Asia is set to outperform as global wealth growth slows, according to a new analysis of UHNWI populations carried out exclusively for The Wealth Report
Words: Gráinne Gilmore, Head of UK Residential Research, Knight Frank
The International Monetary Fund (IMF) entitled its World Economic Outlook report for the final quarter of 2018 Challenges to Steady Growth. Not the most eye-catching headline, perhaps, but one that reflects the fact that the economic cycle, especially in developed
economies, is poised for a period of recalibration after the stellar growth seen in some countries in 2017 and 2018. These economies are now more likely to feel the effect of monetary tightening and the impact of geopolitical and economic policy headwinds.
This outlook is reflected in the five-year forecasts for the number of people joining the ranks of the world’s ultra-wealthy, prepared by wealth data specialists GlobalData WealthInsight. Some 42,711 people, roughly equal to the number of runners in the London marathon, will see their wealth rise to US$30 million or more between 2019 and the end of 2023. This will take the number of UHNWIs worldwide to almost 250,000.
AT A GLANCE
The global UHNWI population is forecast to grow by 22% over the next five years
UHNWI GROWTH BY REGION
|
INDIVIDUALS WORTH |
|
FIVE-YEAR FORECAST |
||||||||
EUROPE |
OVER US$30M IN 2018 |
|
GROWTH |
|
|
||||||
|
|
|
|||||||||
|
|
|
|
|
|
|
|
70,627 |
|
|
|
|
|
|
|
|
|
|
|
24% |
|||
|
|
|
|
|
|
|
|
||||
NORTH AMERICA |
|
|
|
|
|
|
|
51,912 |
|
18% |
|
|
|
|
|
|
|
|
|||||
ASIA |
|
|
|
|
|
|
48,245 |
|
23% |
||
|
|
|
|
|
|
||||||
LATIN AMERICA |
|
|
|
|
|
10,457 |
|
|
|
21% |
|
|
|
|
|
|
|||||||
MIDDLE EAST |
|
|
|
|
8,301 |
|
|
|
20% |
||
|
|
|
|
|
|||||||
AUSTRALASIA |
|
|
|
4,400 |
|
|
|
22% |
|||
|
|
|
|
||||||||
RUSSIA & CIS |
|
|
2,350 |
|
|
|
25% |
||||
|
|
|
|
||||||||
AFRICA |
|
2,050 |
|
|
|
20% |
|||||
|
|
|
|
||||||||
Global wealth trends
WEALTH OF NATIONS |
|
|
|
|
|
|
|
|
|
|
|
|
|
|
|
|||
KEY |
FIVE-YEAR FORECAST |
|
UNDER |
|
|
20% TO |
|
|
25% TO |
|
|
MORE THAN |
||||||
|
|
|
|
|
||||||||||||||
NUMBER OF INDIVIDUALS WORTH OVER US$30M IN 2018 |
GROWTH |
|
20% |
|
|
24.9% |
|
|
30% |
|
|
30% |
|
|||||
|
|
|
|
|
|
|
|
|
|
|
|
|
|
|
|
|
||
|
|
|
|
|
|
|
|
|
|
|
|
|
|
|
|
|
|
|
NORTH AMERICA (51,912) |
|
|
|
ASIA (48,245) |
|
|
|
|
|
THAILAND |
|
|
||||||
|
|
|
|
|
|
|
|
|
|
|
|
|
|
|
|
|||
|
|
|
|
|
|
|
|
|
|
|
|
631 |
|
|
|
|
||
|
|
|
|
|
|
|
|
|
HONG KONG |
|
|
|
|
|
|
|
||
|
|
CANADA |
|
|
|
|
|
3,010 |
|
|
|
SOUTH |
|
|
||||
|
|
4,785 |
|
|
|
|
|
|
|
|
|
|
|
|
|
|
||
|
|
|
|
MALAYSIA |
|
|
|
|
|
SINGAPORE |
KOREA |
|
|
|||||
|
|
|
|
|
|
|
|
|
|
|
|
|||||||
|
|
|
|
|
|
|
|
|
|
1,893 |
|
|
||||||
|
|
|
|
636 |
|
|
|
|
|
|
3,598 |
|
|
|||||
|
|
|
|
|
|
|
|
|
|
|
|
|
|
|||||
US |
JAPAN |
CHINA |
47,127 |
18,534 |
9,953 |
INDONESIA |
|
OTHER |
TAIWAN |
|
|
1,781 |
|
||
756 |
|
4,836 |
|
|
INDIA |
|
|
||
|
|
|
|
|
|
1,947 |
|
|
|
PAKISTAN |
|
|
PHILIPPINES |
VIETNAM |
313 |
|
|
215 |
142 |
|
EUROPE (70,627) |
IRELAND |
|
|
|
|
|
|
LATIN AMERICA (10,457) |
||||
|
|
|
|
|
|
|
|
|
|
|
CHILE |
||
|
|
|
1,029 |
|
|
|
|
|
|
COLOMBIA |
|
||
|
|
|
|
|
|
|
|
|
|
748 |
|||
|
|
|
|
|
|
|
|
|
|
|
|||
|
|
|
|
|
|
|
|
NORWAY |
|
478 |
|
|
ARGENTINA |
|
|
FRANCE |
|
|
|
|
SPAIN |
2,919 |
|
|
|
|
444 |
|
|
4,505 |
|
|
|
|
|
|
|
|
|
|
|
|
|
|
|
|
4,111 |
|
|
|
|
|
|
||
|
|
|
SWITZERLAND |
|
|
|
|
|
|
||||
|
|
|
|
|
|
|
|
BRAZIL |
MEXICO |
|
|||
|
NETHERLANDS |
|
4,768 |
|
|
|
|
|
|
|
|||
|
|
|
|
|
AUSTRIA |
|
|
3,754 |
2,778 |
|
|||
3,261 |
|
|
|
|
|
|
|
|
|
|
|
||
|
|
|
|
|
|
|
|
1,722 |
|
|
|
|
|
HUNGARY |
|
|
|
|
|
|
|
POLAND |
PERU |
|
|
OTHER |
|
|
|
|
|
|
|
|
328 |
|
|
1,927 |
|||
213 |
|
|
|
|
|
|
|
|
|
|
|||
|
|
|
|
|
|
|
|
589 |
|
|
|
|
|
|
|
|
|
|
|
|
|
|
|
|
|
|
|
|
|
|
|
|
|
|
UK |
|
ROMANIA |
|
|
|
|
CYPRUS |
GERMANY |
|
|
|
|
|
215 |
|
|
|
|
||
205 |
|
14,047 |
|
|
|
12,559 |
|
|
|
|
|
|
|
|
|
|
|
|
|
|
|
|
CZECH REP |
|
|
|
|
|
|
|
|
|
|
|
|
|
|
MIDDLE EAST |
(8,301) |
|
|
|
|
|
|
|
|
|
|
|
450 |
|
|
||
|
|
|
|
|
|
|
|
|
|
|
|
|
|
|
|
|
|
|
|
|
|
|
MONACO |
|
|
|
SAUDI ARABIA |
|
BELGIUM |
|
|
|
|
|
|
|
223 |
|
|
|
950 |
|
|
|
|
|
|
|
|
|
UAE |
|
|
||
|
|
|
|
|
|
|
|
|
|
|
|
||
1,598 |
|
|
|
|
|
|
|
DENMARK |
693 |
|
|
|
|
|
|
|
|
|
|
|
|
|
|
|
|
|
|
|
|
|
OTHER |
|
|
|
|
1,193 |
|
OTHER |
ISRAEL |
|
|
LUXEMBOURG |
ITALY |
6,983 |
|
|
SWEDEN |
|
|
|
3,231 |
1,732 |
|
||
|
3,824 |
|
|
|
|
|
|
||||||
689 |
|
4,083 |
|
|
|
|
|
|
|
|
|
||
|
|
|
|
|
|
|
|
|
|
|
|
||
|
|
|
|
|
|
|
|
|
|
|
|
|
|
PORTUGAL |
|
|
|
|
|
|
|
GREECE |
|
TURKEY |
|
||
|
|
|
|
|
|
|
|
1,695 |
|
||||
737 |
|
|
|
|
|
|
|
|
704 |
|
|
||
|
|
|
|
|
|
|
|
|
|
|
|
||
|
|
|
|
|
|
|
|
|
|
|
|||
|
AUSTRALASIA (4,400) |
|
|
|
RUSSIA & CIS (2,350) |
|
|
AFRICA (2,050) |
NIGERIA 194 |
||||
|
|
NEW ZEALAND |
RUSSIA |
|
|
|
OTHER |
KENYA |
|
|
TANZANIA |
||
AUSTRALIA |
|
|
|
|
|
88 |
|||||||
1,292 |
|
|
1,500 |
|
|
|
476 |
125 |
|
|
|||
|
|
|
|
|
|
|
|
||||||
3,062 |
|
|
|
|
|
|
|
|
|
SOUTH AFRICA |
|
OTHER |
|
|
|
|
|
|
|
|
|
|
|
|
|||
|
|
|
|
|
|
|
|
|
|
|
638 |
||
|
|
|
|
|
|
|
|
|
|
661 |
|
|
|
|
|
|
|
|
|
|
|
|
|
|
|
|
|
|
|
OTHER |
|
|
|
|
|
|
UKRAINE |
ZAMBIA |
BOTSWANA EGYPT |
UGANDA |
|
|
|
46 |
|
|
|
|
|
|
374 |
17 |
22 |
283 |
22 |
12 | KNIGHTFRANK.COM |
Source: GlobalData WealthInsight |
13 | KNIGHTFRANK.COM |
|
vk.com/id446425943
MAPPING UHNWI POPULATIONS
While this 22% increase represents an acceleration in growth compared with the past five years, when UHNWI numbers rose by 18%, the average year-on-year increase of 4% is more measured than the 10% growth seen in 2017 alone.
A mixed outlook
“Equity markets, real estate markets and luxury investments all had a stellar year in 2017. Growth in 2018 has been good in some cases, but has not replicated the levels seen in 2017, and the outlook reflects more mixed conditions ahead,” says Oliver Williams, Head of GlobalData WealthInsight.
Some commentators have pointed towards a global slowdown or recession in 2019 or 2020. While the consensus is that we will see moderation rather than downturn, countries will have less room for manoeuvre to respond in the event of an economic shock.
Even so, 2019 will see the number of people globally with US$1 million or more in net assets – HNWIs – exceed 20 million for the first time, according to GlobalData WealthInsight. Some 6.6 million will be based in North America, with 5.9 million in Europe and a further 5.8 million in Asia.
Mr Williams highlights the link between entrepreneurialism and wealth creation. “The easier it is to create a business, the more wealthy entrepreneurs there will be – and the more equal wealth is among HNWIs. Countries where building a business is more challenging tend to have a higher concentration of wealth and a disproportionate number of UHNWIs and billionaires.”
The ranks of the ultra-wealthy – those with net assets of more than US$30 million – expanded by 7,091 in 2018, a rise of 4%. “Growth in non-financial assets – that is, real estate – is one of the leading factors driving UHNWI growth,” says Mr Williams. “Others include returns from traditional and alternative investments, along with growth conditions in major economies.”
Asia is the biggest hub for billionaires, with numbers set to rise above 1,000 by
Global wealth hotspots above: growth in Mexico’s UHNWI population is set to outstrip its Latin American neighbours bottom right: Japan remains Asia’s biggest wealth hub
AT A GLANCE
In 2019, the number of US$ millionaires worldwide will exceed 20 million for the first time
2023, accounting for more than a third of the world’s billionaire population of 2,696. China has seen a sharp rise in the number of billionaires in the last five years, but growth looks set to moderate in the medium term.
Global variations
However, there are marked geographical differences, adds Mr Williams. “In North America, financial assets are a major growth driver at the moment. In Europe and Asia, real estate is most important. Meanwhile, Latin American economies are particularly affected by fluctuations in the US dollar exchange rate.”
As the data for The Wealth Report is expressed in US dollars, these fluctuations are factored in. “The performance of the US dollar impacts millionaires in many countries. When the US dollar is appreciating rapidly against certain currencies, the number of HNWIs can decrease even though their wealth in local currency terms remains the same,” Mr Williams says.
While the expansion of wealth populations is expected to be broadly steady in each of the next five years, some regions will outperform. UHNWI numbers in Asia, for example, are expected to rise by 23%, compared with 18% in North America.
|
|
|
|
|
|
|
|
|
|
|
|
|
Global wealth trends |
|
|
|
|
|
|
|
Echoingthetrendsseeninpreviouseditions |
|
UHNWIs. But strong forecast growth – some |
||||
|
|
|
|
|
|
|
|
||||||
|
|
|
|
|
|
|
of The Wealth Report, Asian countries will |
|
23% between 2018 and 2023 – means that |
||||
|
|
|
AT A GLANCE |
see the biggest growth in UHNWIs over the |
|
Mexico will be catching up quickly, with a |
|||||||
|
|
|
next five years. India leads with 39% growth, |
|
predicted population of 3,427 UHNWIs in |
||||||||
|
The number of UHNWIs |
followed by the Philippines (38%) and China |
|
five years’ time. |
|||||||||
|
(35%). Of the 59 countries and territories in |
|
The forecast growth in ultra-wealthy |
||||||||||
|
|
|
in India is set to rise |
|
|||||||||
|
|
|
our forecasts, eight of the top ten countries |
|
people chimes with the findings of this year’s |
||||||||
|
|
|
by 39% to 2,697 |
by future growth are in Asia, with Romania |
|
Attitudes Survey, which shows that the |
|||||||
|
|
|
by 2023 |
|
|
|
and Ukraine taking the remaining spots. |
|
majority of UHNWIs expect their wealth to |
||||
|
|
|
|
|
|
However, it is worth noting that some of |
|
increase in 2019. However, there is divergence |
|||||
|
|
|
|
|
|
|
|
||||||
|
|
|
|
|
|
|
these countries are starting from a low base. |
|
in the strength of this sentiment, with four- |
||||
|
|
|
|
|
|
|
For example, Romania will have 278 UHNWIs |
|
fifths of wealth advisers in the US expecting |
||||
|
|
|
|
|
|
|
by 2023, while Ukraine will have 485. The |
|
their clients’ wealth to rise in 2019, compared |
||||
|
|
|
|
|
|
|
Philippines is forecast to have 296 UHNWIs |
|
with just under two-thirds in Asia. |
||||
|
|
|
|
|
|
|
by 2023, less than 2% of the ultra-wealthy |
|
There is more alignment on the challenges |
||||
|
|
|
|
|
|
|
population of Japan, the biggest Asian wealth |
|
posed by the local political and economic |
||||
|
|
|
|
|
|
|
hub with 20,570. |
|
environment, however. Some 65% of Asian |
||||
|
|
|
|
|
|
|
In Africa, Kenya leads the way, with 24% |
|
respondents to the Attitudes Survey, along |
||||
|
|
|
|
|
|
|
|
||||||
|
|
|
|
|
|
|
forecast growth by the end of 2023. This fits |
|
with 59% of those in the US, said that local |
||||
|
|
|
|
|
|
|
with more upbeat economic forecasts for |
|
conditions would make it more difficult to |
||||
|
|
|
|
Find out more about |
|
Kenyan GDP in the coming years, yet risks |
|
create and retain wealth in the future. |
|||||
|
|
|
|
the latest investment |
|
remain to this economic outlook as the gov- |
|
|
|||||
|
|
|
|
trends on page 42 |
|
|
|
||||||
|
|
|
|
|
|
|
|
|
ernment looks to narrow its |
|
Trade tensions |
||
|
|
|
|
|
|
|
|
|
|
|
|
||
|
|
|
|
|
|
|
|
|
|
|
fiscal deficit. The number of |
|
Rising trade tensions between China and |
|
|
|
|
|
|
|
|
|
|
|
|
||
|
THE ASCENT OF MONEY |
|
|
|
|
ultra-wealthy people in the |
|
the US will have an impact on wider global |
|||||
|
|
|
|
|
country is set to reach 155 in |
|
growth as well as on both countries, predicts |
||||||
|
Global millionaire population |
|
|
|
|
|
|
|
2023, making up 6% of the |
|
Mr Williams. But Dr Ian Bremmer, president |
||
|
|
|
|
23.4 million |
|
|
|
|
|||||
|
25 million |
|
|
|
|
total UHNWI population |
|
and founder of Eurasia Group, the leading |
|||||
|
|
|
|
|
|
|
|
|
|||||
20 |
17.3 million |
19.6 million |
|
|
|
|
in Africa. |
|
global political risk research firm, believes |
||||
|
|
|
|||||||||||
|
|
|
|
|
|
|
|
|
South Africa will remain |
|
the effect may be more muted than expected, |
||
15 |
|
|
|
|
|
|
|
|
|
|
|||
|
|
|
|
|
|
|
|
||||||
|
|
|
|
|
|
|
|
|
the largest wealth hub in |
|
at least in the short term. “Any tensions |
||
|
|
|
|
|
|
|
|
||||||
10 |
|
|
|
|
|
|
|
|
|
the region, with a 32% share |
|
|
|
5 |
|
|
|
|
|
|
|
|
|
of the ultra-wealthy pop- |
|
|
|
|
|
|
|
|
|
|
|
|
ulation in five years’ time. |
|
|
||
|
|
|
|
|
|
|
|
|
|
|
|
|
|
0 |
|
|
|
|
|
|
|
|
|
Africa as a whole will see its |
|
|
|
|
|
|
2013 |
|
2018 |
|
2023 |
|
|
|
UHNWI population grow by |
|
|
|
Global billionaire population |
|
|
|
|
|
|
|
31% in the decade to 2023. |
|
|
||
|
|
|
|
|
|
|
|
In Latin America, the |
|
|
|||
3,000 |
|
|
|
|
|
2,696 |
|
|
|
||||
|
|
|
|
|
|
|
|
|
|||||
|
|
|
|
2,229 |
|
|
|
|
|
upheavals in the Brazilian |
|
|
|
2,000 |
|
|
|
|
|
|
|
economy mean that the |
|
|
|||
|
|
|
|
|
|
|
|
|
|
|
|||
|
|
|
|
|
|
|
|
|
UHNWI population will |
|
|
||
1,440 |
|
|
|
|
|
|
|
|
|
||||
|
|
|
|
|
|
|
not regain the levels seen in |
|
|
||||
1,000 |
|
|
|
|
|
|
|
|
|
|
|
||
|
|
|
|
|
|
|
|
|
2013 by 2023, even as the |
|
|
||
|
|
|
|
|
|
|
|
|
|
|
countr y emerges from |
|
|
0 |
|
|
|
|
|
|
|
|
|
recession. However, it will |
|
|
|
|
|
|
2013 |
|
2018 |
|
2023 |
|
|
|
still be the continent’s |
|
|
|
|
|
|
|
Source: GlobalData WealthInsight |
|
biggest wealth hub in five |
|
|
||||
|
|
|
|
|
|
|
|
|
|||||
|
|
|
|
|
|
|
|
|
|
|
years’ time with 3,962 |
|
|
|
|
|
|
|
|
|
|
|
|
|
|
||
14 | KNIGHTFRANK.COM |
15 | KNIGHTFRANK.COM |
vk.com/id446425943
MAPPING UHNWI POPULATIONS
between the world’s two largest economies draw outsized attention,” he points out. “There are plenty of areas where these two countries will see significant conflict next year, most importantly around technology. But against the backdrop of a softer economy, both leaders are looking for excuses to avoid further trade escalation. We won’t see an allout ‘trade war’ in 2019.”
Any escalation in trade tensions has the potential to affect all households. In its World Economic Outlook, the IMF says: “An intensification of trade tensions, and the associated rise in policy uncertainty, could dent business and financial market sentiment, trigger financial market volatility, and slow investment and trade.
“Higher trade barriers would disrupt global supply chains and slow the spread of new technologies, ultimately lowering global productivity and welfare. More import restrictions would also make tradable consumer goods less affordable, harming low-income households disproportionately.”
Finding ways to respond to this risk falls withintheremitoftheWorldEconomicForum. This year’s annual meeting in Davos, under the heading “Globalization 4.0”, aimed
to encourage policymakers to come up with an approach to globalisation that would minimise nationalistic and protectionistpolicies.
T h e r e s p o n s e from UHNWIs, as highlighted in our inter v iews w it h Jochen Zeitz and Richard Branson, co-founders of The B Team (see pages 6–10), is to look at ways in which businesses can join together to be a force for positive social
change, and lobby governments to work together on joint goals.
The search for stability
This fits with Ian Bremmer’s assessment of recent geopolitical developments. “As inequality grows – and, with it the disenfranchisement of large parts of society – the response of UHNWIs needs to be ‘how can we fix this?’”, he says. However, he adds: “The more immediate response is, ‘What can I do to protect my family?’”
This is borne out in the global residential real estate trends seen over the last two
AT A GLANCE
UHNWI residential real estate choices are increasingly driven by the search for stability
years. “The footprint of the ultra-wealthy is growing larger when it comes to property investment. Go back 10 or 15 years, and UHNWI residential property investment wouldhavebeendrivenlargelybythedecision as to where children were to be educated,” notesAndrewHay,GlobalHeadofResidential at Knight Frank.
“Education is still a key consideration – but UHNWIs are also becoming increasingly strategic in response to global uncertainty and political upheavals. As a result they are investing in additional homes in cities and countries where they can see greater levels of stability,” he adds.
In the years to come, growing economic and geopolitical challenges – such as rising interest rates, the withdrawal of fiscal stimulus, slowing economic growth and trade tensions, not to mention Brexit and the ongoing upheaval in the Middle East – are settotranslateintomoderatewealthcreation, but also a search among the ultra-wealthy for stability, both personally and in terms of their assets.
TURBULENCE AHEAD
Wealth advisers who expect the political and economic environment to make it harder for clients to create and protect wealth in 2019
Environment within their country of residence Environment globally
|
50 |
60 |
70 |
80% |
AFRICA |
58% |
|
66% |
|
ASIA |
|
65% |
69% |
|
AUSTRALASIA |
|
|
70% |
76% |
EUROPE |
56% |
|
65% |
|
LATIN |
55% |
|
64% |
|
AMERICA |
|
|
|
|
MIDDLE EAST |
59% |
|
|
72% |
NORTH |
59% |
|
62% |
|
AMERICA |
|
|
||
|
|
|
|
|
RUSSIA & CIS |
|
65% |
|
80% |
GLOBAL |
62% |
68% |
|
|
AVERAGE |
|
|||
|
|
|
|
|
Source: The Wealth Report Attitudes Survey 2019
|
Global wealth trends |
|
n early 2019, many of the trends that shaped the global economy in 2018 – from Brexit |
JAMES ROBERTS, CHIEF |
to trade wars to financial market volatility – appear still to be prevalent. However, |
ECONOMIST AT KNIGHT FRANK, |
markets have long since priced in the implications of these widely discussed events, |
IDENTIFIES FOUR TRENDS |
and I believe that there are new trends that could move to the forefront this year. |
THAT LOOK SET TO SHAPE |
IThe following economic and geopolitical changes are the ones that I believe UHNWIs |
WEALTH CREATION IN 2019 |
should consider when investing in 2019 and beyond. |
Recession scares
Some believe that a major economic downturn occurs every ten years or so, which – given that in many countries the last recession occurred in 2008/09 – would make the next one imminent. However, the theory is not 100% reliable: Australia, for example, has not seen a recession since the early 1990s. Downturns occur not because the calendar says it’s time, but because excesses have built up in the economy. In 2018, we saw a number of assets with swollen values correct, such as cryptocurrencies, technology shares and house prices in certain global cities. While some repricing has already occurred, leading to speculation that recession is looming, there could be opportunities for investors willing to take a long-term view. UK assets, for instance, have perhaps accumulated too much Brexit discount.
Leaderless populism
In recent years, we have seen the rise of populist movements under charismatic leaders, but the emergence of groundswell movements without formal structure is a new phenomenon. For a recent example, look no further than France and its gilets jaunes, or “yellow vests”. While the country is no stranger to street protests, the French government has struggled to cope with demonstrators who have no obvious leadership that can set out a list of grievances and engage in talks. If this marks the beginning of a new phase of populism, UHNWIs may well start to show a preference towards investing in places with less of a tradition of street protest. This could perhaps favour the so-called “S-for-stability” locations, such as Singapore, Scandinavia and Switzerland.
The new Vikings
The UK’s departure from the EU is already affecting the internal politics of the trade bloc. Traditionally, Britain has acted as a counterweight to the influence of France and Germany, but now a coalition of eight northern European nations – sometimes referred to as “the new Hanseatic League” – has emerged, based onthelogicthattheircombinedvoiceswillhavemorestrengthwhennegotiatingwiththelargestEUstates. This more prominent role on the diplomatic stage could draw investor attention to the small but wealthy nations of the North Sea and Baltic coastlines. The UK has traditionally appealed to UHNWIs seeking a countrywithliberalvalues,politicalstabilityandsafehavenqualities.TheNetherlands,Denmark,Sweden, and Finland share these characteristics, and also offer growing exposure to Europe’s tech start-up scene.
New energy politics
For decades, the politics of the Middle East have been keenly monitored around the world because of their impact on oil prices. BP in its most recent Energy Outlook report predicted that most future growth in energy demand will be for gas and electricity, reflecting our ever-increasing reliance on battery power and prompting The Economist to hail the end of the era of the internal combustion engine. UHNWIs must consider the geopolitical implications. Will a US with a thriving shale gas industry be quite so willing in the future to intervene in the Middle East? Will the need for political stability in the Congo basin rise up the global agenda, given its status as a major producer of cobalt, a vital component in batteries? Will sun-drenched, windswept countries enjoy a surge in energy exports in the future?
16 | KNIGHTFRANK.COM |
17 | KNIGHTFRANK.COM |
vk.com/id446425943
GLOBAL CITIES
London calling
The Wealth Report reveals the results of the latest Knight Frank City Wealth Index, and turns the spotlight
on five cities set to grow in prominence in the coming years
Words: Flora Harley, Senior Analyst, Knight Frank Research
The decision where to invest is a complex one driven by a range of factors, not least familiarity with the market in question and a good understanding of its dynamics.
This year, we have refined and built on the Knight Frank City Wealth Index, crunching numbers for many of the world’s leading cities in order to generate more of the detailed insights that investors rely on and identify the global urban powerhouses that matter most to the world’s movers and shakers. We also have an eye to the future, with an assessment of five global cities that we believe are set to grow in prominence and prosperity.
The results show that London has shrugged off concerns regarding Brexit to retake the top spot from New York, with the Big Apple slipping to second place overall. Investment was the only category in which New York managed to outperform the UK capital.
Asia’s growing prominence is confirmed, with Hong Kong and Singapore taking third and fourth positions respectively. Overall, the number of slots in our top 20 occupied by cities in the Asia-Pacific region rises to
Europe remains stable with six, but the number of North American cities making an appearance drops to seven.
TheKnightFrankCityWealth Index is built around three categories: wealth, investment and lifestyle. Here, we provide a brief explanation of each, along
with some of this year’s key findings
WEALTH
Using data from analyst GlobalData WealthInsight, we havelookedatthecurrentpopulationofHNWI(thosewith net assets of more than US$1 million) and UHNWI (those
with net assets of over US$30 million) residents in each city, as well as analysing recent growth performance.
Key findings In terms of UHNWIs, London has the largest population with 4,944, an increase of 582 over the last five years, the most of any city. For HNWIs, Tokyo reigns supreme with 488,582, although New York has seen the highest growth with an additional 55,434 HNWIs. New York also has the highest concentration of billionaires, with 94. Growth in Asia is noticeable, with Asian cities holding six of the top ten spots in the wealth category. Taipei comes in ninth, following 17% growth in its UHNWI population over the past five years.
INVESTMENT
To understand where the wealthy are investing, we assessed the most comprehensive data on major property investments (those worth the equivalent of US$10 million or more) by private individuals or family offices across both commercial and residential markets. Our ranking takes into account the volume
Global wealth trends
Peak performer Despite the uncertainty surrounding the UK’s exit from the EU, London has regained its position as the leading global city
Turn to page 30 for prime residential price data
of investment and its diversity in terms of the number of different nationalities investing.
Key findings North American cities reign supreme for private investment, occupying six of the top ten spots in this category, with New York in top place. But London remains dominant for diversity of investors.
LIFESTYLE
Drawing on our annual Attitudes Survey, we have identified some key decision influencers. For example, education – quantified here by the number and quality of universities – is a significant driver for purchases of first and second homes globally. Security is another key factor, as are luxury indicators including the number of five-star hotels and the quantity and quality of leading restaurants.
Key findings This category is a tale of two cities: London and Tokyo. London leads, due to the high number of five-star hotels – 76 – and the number and quality of its universities. Tokyo ranks highest for luxury dining and is the safest city according to The Economist Safe Cities Index.
THE KNIGHT FRANK CITY WEALTH INDEX 2019 |
|
|
Connecting lines show the top ve cities |
|||||||
|
OVERALL RANK |
|
|
WEALTH RANK |
|
INVESTMENT RANK |
|
LIFESTYLE RANK |
||
|
|
|
|
|
|
|
|
|
||
1 |
LONDON |
|
|
1= |
LONDON |
1 |
NEW YORK |
1= LONDON |
||
|
|
|||||||||
2 |
NEW YORK |
|
|
1= |
NEW YORK |
2 |
LONDON |
1= SINGAPORE |
||
|
|
|||||||||
3 |
HONG KONG |
3= |
BEIJING |
3= |
HONG KONG |
3 |
NEW YORK |
|||
4 |
SINGAPORE |
3= |
HONG KONG |
3= |
LOS ANGELES |
4 |
HONG KONG |
|||
5 |
LOS ANGELES |
5 |
SINGAPORE |
5 |
WASHINGTON DC |
5 |
TOKYO |
|||
6 |
CHICAGO |
6 |
FRANKFURT |
6 |
SYDNEY |
6 |
PARIS |
|||
7 |
SHANGHAI |
7 |
SEOUL |
8 |
CHICAGO |
7 |
CHICAGO |
|||
8 |
SYDNEY |
8 |
SHANGHAI |
9 |
SINGAPORE |
8 |
SAN FRANCISCO |
|||
9 |
TOKYO |
10= |
MUNICH |
10 |
ATLANTA |
9 |
WASHINGTON DC |
|||
10 |
TORONTO |
10= |
PARIS |
12 |
BERLIN |
10 |
AMSTERDAM |
|||
11= |
BERLIN |
13 |
LOS ANGELES |
14 |
AMSTERDAM |
12 |
BERLIN |
|||
11= |
FRANKFURT |
18 |
TORONTO |
17 |
FRANKFURT |
13 |
LOS ANGELES |
|||
11= |
PARIS |
19 |
CHICAGO |
18 |
TORONTO |
15 |
SHANGHAI |
|||
14= |
BEIJING |
21 |
ATLANTA |
19 |
TOKYO |
16 |
SYDNEY |
|||
14= |
SAN FRANCISCO |
27 |
SYDNEY |
20 |
MUNICH |
18 |
SEOUL |
|||
14= |
SEOUL |
28 |
TOKYO |
23= SAN FRANCISCO |
19 |
TORONTO |
||||
17= |
MUNICH |
29 |
SAN FRANCISCO |
23= SHANGHAI |
20 |
BEIJING |
||||
17= |
WASHINGTON DC |
34 |
BERLIN |
35 |
SEOUL |
34 |
MUNICH |
|||
19 |
ATLANTA |
48 |
AMSTERDAM |
37 |
BEIJING |
35 |
FRANKFURT |
|||
20 |
AMSTERDAM |
50 |
WASHINGTON DC |
42 |
PARIS |
37 |
ATLANTA |
|||
Sources: Knight Frank Research, GlobalData WealthInsight, RCA, Five Star Alliance, Michelin, Times Higher Education, The Economist
18 | KNIGHTFRANK.COM |
19 | KNIGHTFRANK.COM |
vk.com/id446425943
GLOBAL CITIES
FUTURE CITIES
When considering the cities of the future, we have focused on those factors that will support wealth creation including innovation indicators, wealth forecasts and economic growth, and those aspects that improve a city’s growth prospects, such as infrastructure.
Cities that demonstrate these characteristics are likely targets for future property investment. Below we look at five urban centres across the world that we believe will increasingly attract investors over the coming years.
01 Over the next five years, Oxford Economics data indicates that real GDP will grow by almost 60%. Often dubbed India’s
Bengaluru
Cities in India are often overshadowed by the success of
Mumbai, but Bengaluru is expected to disrupt this narrative.
|
answer to Silicon Valley, Bengalaru is known for its technology |
|
sector. The city is home to companies including Flipkart, Infosys |
|
and Wipro, and over 400 multinationals including Microsoft, |
98** |
Hitachi and Samsung have bases there. This is supported by the |
fact that the city has been grossing the country’s highest office |
absorption volume consecutively for the last ten years. Bengaluru has made a commitment to creating a knowledge economy by investing in education centres, including the Indian Institute of Management Bengaluru, the Institute of Science and the National Aerospace Laboratories. The city’s broad ecosystem of innovation offers multiple opportunities for future growth, reflected in the rise of new age technology companies across sectors including artificial intelligence, food tech, fintech and robotics.
02
732**
Hangzhou
Hangzhou is making a name for itself both globally and within China. The transport, storage, information and communication services sector has more than doubled in the past five years, and is expected to grow by a further 46% over the next five, according to data from Oxford Economics. This growth in the city’s innovation and technology industry has resulted in an increase in its UHNWI population of 25% over the same period. Following in the footsteps of Alibaba, which was founded in Hangzhou, there are now 26 “unicorns” (tech companies with a valuation in excess of US$1 billion) in the city. Hangzhou also has the location
– in the middle of the Yangtze River delta, just an hour from Shanghai by high-speed train – and the infrastructure in the form of extensive rail, road and air routes to benefit from the economic success seen in the rest of China.
* UHNWI five-year forecast growth ** UHNWI population in 2018
03
559**
04
68**
05
426**
Global wealth trends
Stockholm
Stockholm is cementing its place as one of the world’s most innovative cities, making it a prominent centre for wealth creation and growth: GlobalData WealthInsight estimates that the UHNWI population will grow by 23% between 2018 and 2023. In 2017, the European Commission named Stockholm as the most innovative city in Europe, in part due to the value placed on welfare and sustainability, which nurtures pioneering ideas. As the birthplace of market-leading multinationals, including music streaming platform Spotify, it is clear that the entrepreneurial spirit is flourishing. This is further enhanced by the city’s ability to attract talent; Stockholm ranks second in the INSEAD Global Talent Competitiveness Index 2018, which measures a city’s ability to enable, retain, attract and grow its workforce. This is reflected by 8% population growth over the past five years and a further forecast increase of 7% over the next five.
Cambridge
As one of Europe’s leading technology clusters, Cambridge is the UK’s answer to Silicon Valley. In 2017, the turnover for digital tech business in “Silicon Fen” was £2.4 billion, or £152,000 per employee, according to Tech Nation. The world-class talent coming out of the University of Cambridge, combined with the city’s renowned research facilities and pre-existing network of tech businesses, encapsulates its appeal. Tech giants including Apple, Microsoft and Amazon have a presence and are developing pioneering technology including Amazon’s “Prime Air” and Apple’s AI capabilities. To accommodate the city’s growing success, Cambridge council is planning to build some 14,000 new homes by 2031. Infrastructure investment is also strong: a new train station was opened in 2017, with another on the way by 2021 and an underground railway, appropriately named the Isaac Newton Line, due to begin operation in 2025.
Boston
The city of Boston is an attractive and relatively affordable alternative investment destination to New York and San Francisco. Unlike these established markets, Boston is less densely populated by startups, making the competition for attracting capital less fierce. Yet the demand is still there; between 2015 and 2017 Boston received US$24.5 billion in venture capital investment, the fifth highest globally, according to the Center for American Entrepreneurship. The city is also able to draw on a vast pool of talent, with two Ivy League universities, Massachusetts Institute of Technology (MIT) and Harvard, which rank fourth and sixth respectively in The Times World University rankings for 2019. Tech giants including Google, Amazon, Facebook and Uber are already capitalising on this, with offices located in the city.
20 | KNIGHTFRANK.COM |
21 | KNIGHTFRANK.COM |

vk.com/id446425943
SUPERYACHTS AND PRIVATE JETS
The wind and the waves
Using data from the specialists at WINGX and Superyacht Intelligence, The Wealth Report analyses global private jet and superyacht fleets and how they move around the world
WHO'S GOT THE YACHTS? Breakdown and global ownership distribution of superyacht eet
BOAT |
% OF GLOBAL FLEET |
REGION |
LENGTH |
|
|
AFRICA
ASIA AND
AUSTRALASIA
45%
30–40m
EUROPE
40–60m |
38% |
|
|
MIDDLE |
|
|
|
|
|
|
EAST |
|
13% |
NORTH |
60–90m |
AMERICA |
|
|
|
|
90m+ |
4% |
|
|
LATIN AMERICA |
|
|
|
SUPERYACHT FLEET
CRUISE CONTROL
Global distribution of yacht voyages
50%
47%
40
 WESTERN MEDITERRANEAN
39%
30
28%
EASTERN
MEDITERRANEAN
20 |
21% |
CARIBBEAN 18%
10 |
|
|
|
|
|
|
|
ASIA, AUSTRALIA |
|||
8% |
|
|
|
8% |
|
||||||
|
|
|
|
|
|
|
US EAST COAST |
||||
|
|
|
|
|
|
|
|
|
|
||
7% |
|
|
|
|
|
|
7% |
|
|||
|
|
|
|
|
|
|
|
|
|||
|
|
|
|
|
|
|
|
|
NORTHERN EUROPE |
||
6% |
|
|
|
|
|
|
|
||||
3% |
|
|
|
|
|
|
4% |
|
|||
|
|
|
|
|
|
||||||
|
|
|
|
|
|
|
|
|
|
||
1% |
|
|
|
|
|
|
LATIN AMERICA |
||||
|
|
|
|
3% |
|
||||||
|
|
|
|
|
|||||||
|
|
|
|
|
|
|
|
|
|
|
|
SUMMER |
WINTER |
||||||||||
CRUISING |
CRUISING |
||||||||||
CLUB MED Distribution of Mediterranean voyages during summer cruising season
FRANCE |
CROATIA |
MONACO |
MONTENEGRO |
|
|
|
ITALY |
|
ALBANIA |
SPAIN |
TURKEY |
|
GREECE |
GIBRALTAR |
|
|
MALTA |
19% |
16% |
12% |
11% |
9% |
8% |
6% |
4% |
4% |
3% |
3% |
Source: Superyacht Intelligence
Global wealth trends
PRIVATE JET FLEET
DEPARTURE BOARDS Number of private jet departures in 2018* by region and from selected cities, airports and locations featured in The Wealth Report 2019
|
|
|
|
|
|
|
|
|
|
RANK: 29 |
7 |
17 |
21 |
33 |
|
|
|
|
|
MEXICO CITY |
LAS VEGAS |
MONTREAL |
LONDON |
MOSCOW |
|
|
|
|
|
(ADOLFO |
(MCCARRAN) |
(PIERRE E. |
(LUTON) |
(VNUKOVO |
91 |
163 |
202 |
146 |
154 |
LÓPEZ |
|
TRUDEAU) |
|
INTL) |
|||||
|
|
BEIJING |
TOKYO |
MANILA |
MUMBAI |
DUBAI |
|||
MATEOS) |
|
|
|
|
|||||
|
|
|
|
(BEIJING |
(TOKYO |
(NINOY |
(CHHATRAPATI |
(DUBAI |
|
|
|
|
|
|
|||||
|
|
|
|
|
CAPITAL) |
INTL) |
AQUINO) |
SHIVAJI) |
INTL) |
9,893 |
24,353 |
14,888 |
12,784 |
8,865 |
2,685 |
1,202 |
781 |
1,516 |
1,400 |
|
|
|
|
|
|
|
|
|
|
4,099 |
423 |
|
MIAMI |
369 |
|
1,577 |
||
FLIGHTS BETWEEN |
||
BAHAMAS |
ALL AIRPORTS SERVING |
|
|
EACH CITY IN 2018 |
1,295 |
(JANUARY TO DECEMBER) |
|
|
|
1,427 |
|
1,192 |
|
336 |
|
1,874 |
66,968 |
22,483 |
13,915 |
5,407 |
1,067 |
8,432 |
15,842 |
4,258 |
4,065 |
RANK: 1 |
8 |
18 |
54 |
176 |
36 |
14 |
67 |
71 |
NEW YORK |
PARIS |
GENEVA |
IBIZA |
LAGOS |
MILAN |
CANNES |
TEL AVIV |
ISTANBUL |
(TETERBORO) |
(LE BOURGET) |
(COINTRIN) |
(IBIZA) |
(MURTALA MUHAMMED) |
(LINATE) |
(NICE-CÔTE D'AZUR) |
(BEN GURION) |
(ATATÜRK) |
Numbers of flights per departure region
2.0 million
1.96M
 FRACTIONAL
 PRIVATELY OWNED
 CHARTER FLIGHTS
1.5
1.0
0.5 |
494,082 |
|
|
|
|
0 |
|
102,726 |
52,734 |
21,548 |
17,830 |
|
|
|
|
|
|
NORTH AMERICA |
EUROPE |
LATIN AMERICA |
ASIA-PACIFIC |
MIDDLE EAST |
AFRICA |
THE JET SET Distribution of private jet registrations
REGION |
NUMBER OF ACTIVE BUSINESS JETS |
|
LARGE JETS (10+ SEATS) AS % OF REGIONAL FLEET |
|||||||||||||
|
|
|
|
|
|
|
|
|
|
|
|
|
|
|
|
|
NORTH AMERICA |
|
|
|
|
|
13,685 |
29% |
|
|
|
|
|
|
|
|
|
|
|
|
|
|
|
|
|
|
|
|
|
|
||||
EUROPE, RUSSIA & CIS |
|
|
|
|
|
2,879 |
|
42% |
|
|
|
|
|
|
|
|
|
|
|
|
|
|
|
|
|
|
|
|
|
|
|||
LATIN AMERICA |
|
|
|
|
|
39% |
|
|
|
|
|
|
|
|
||
|
|
|
718 |
|
|
|
|
|
|
|
|
|
|
|||
ASIA-PACIFIC |
|
|
|
487 |
|
|
63% |
|
|
|
|
|
|
|
|
|
|
|
|
|
|
|
|
|
|
|
|
|
|
||||
|
|
|
|
|
|
|
|
|
|
|
|
|
|
|||
MIDDLE EAST |
|
|
198 |
|
|
72% |
|
|
|
|
|
|
|
|
||
|
|
|
|
|
|
|
|
|
|
|
|
|
||||
AFRICA |
|
|
135 |
|
|
56% |
|
|
|
|
|
|
|
|
||
|
|
|
|
*January to November (except where stated) |
||||||||||||
Source: WINGX |
|
|
|
|
|
|
|
|||||||||
22 | KNIGHTFRANK.COM |
23 | KNIGHTFRANK.COM |

vk.com/id446425943
UHNWI TRAVEL
The social network
A ground-breaking new study of social media activity for The Wealth Report reveals how our readers divide
their time around the world
Words: Flora Harley, Senior Analyst, Knight Frank Research
We can track how wealth moves in many ways, but usually this will be at the level of capital transfers and investment flows, as well as more
permanent population growth and migration trends. However, transitory movements are just as interesting
when trying to understand your clients and work out where their interests and passions lie. The private jet and superyacht data on page 22 provides some clues, but thanks to social media it’s now possible to pinpoint where real people are spending their time.
By crunching the geotags of just under 1.5 million anonymisedTwitterpostsfrom7,500UHNWIsbasedin15 countries, we have been able to piece together a picture of when and where people travel. The results of this unique analysis are represented in the visualisations opposite. Some of the headline findings are listed below.
•The US, UK, France, UAE and Germany were the top five destinations for travel abroad.
•Proximity is a factor, with many favouring neighbouring countries. For example, New Zealand is popular with Australians.
•June is the most popular month for travel for more than half of the nationalities studied, followed by October and May.
•Both the US and France saw the most UHNWI visitors in June, while the UK was most likely
to be visited in April.
HOME AND AWAY
Proportion of individuals active on social media in their own country and abroad
|
|
|
|
|
|
|
|
ACTIVE WHEN AWAY |
|
|
|
|
|
|
ACTIVE AT HOME |
|||||||||||||||||||||
|
|
|
|
|
|
|
|
|
|
|
|
|
|
|
|
|
|
|
|
|
|
|
|
|
|
|
|
|
|
|
|
|
|
|
||
|
|
|
|
|
|
|
|
|
|
|
|
|
|
|
|
|
|
|
|
|
|
|
|
|
|
|
|
|
|
|
|
|
|
|
|
|
|
|
|
|
|
|
|
|
|
|
|
|
|
|
|
|
|
|
|
|
|
|
|
|
|
|
|
|
|
|
|
|
|
|
|
|
|
AMERICAN |
|
|
|
|
|
|
|
28% |
|
|
|
|
|
|
|
|
|
|
|
|
|
|
|
|
|
|
|
|
|
|
99% |
|||||
|
|
|
|
|
|
|
|
|
|
|
|
|
|
|
|
|
|
|
|
|
|
|
|
|
|
|
|
|
|
|
||||||
AUSTRALIAN |
|
|
|
|
|
17% |
|
|
|
|
|
|
|
|
|
|
|
|
|
|
|
|
|
|
|
|
|
|
97% |
|
||||||
|
|
|
|
|
|
|
|
|
|
|
|
|
|
|
|
|
|
|
|
|
|
|
|
|
|
|
|
|
|
|
||||||
BRITISH |
|
|
|
|
|
|
|
|
|
|
|
|
|
|
56% |
|
|
|
|
|
|
|
|
|
|
93% |
|
|
|
|||||||
|
|
|
|
|
|
|
|
|
|
|
|
|
|
|
|
|
|
|
|
|
|
|
|
|
|
|
|
|
|
|
||||||
CANADIAN |
|
|
|
|
|
21% |
|
|
|
|
|
|
|
|
|
|
|
|
|
|
|
|
|
|
|
|
94% |
|
|
|
||||||
|
|
|
|
|
|
|
|
|
|
|
|
|
|
|
|
|
|
|
|
|
|
|
|
|
|
|
|
|
|
|
|
|
|
|
||
CHINESE |
|
|
|
|
|
|
|
36% |
|
|
|
|
|
|
|
|
|
80% |
|
|
|
|
|
|
|
|
|
|
||||||||
|
|
|
|
|
|
|
|
|
|
|
|
|
|
|
|
|
|
|
|
|
|
|
|
|
|
|
|
|
|
|
|
|
|
|
||
EMIRATI |
|
|
|
|
|
|
|
|
|
|
41% |
|
|
|
|
|
|
|
|
78% |
|
|
|
|
|
|
|
|
|
|
||||||
|
|
|
|
|
|
|
|
|
|
|
|
|
|
|
|
|
|
|
|
|
|
|
|
|
|
|
|
|
|
|
|
|||||
FRENCH |
|
|
|
|
|
|
|
29% |
|
|
|
|
|
|
|
|
|
|
|
|
|
|
|
|
89% |
|
|
|
|
|||||||
|
|
|
|
|
|
|
|
|
|
|
|
|
|
|
|
|
|
|
|
|
|
|
|
|
|
|
|
|
|
|
|
|||||
INDIAN |
|
|
|
|
|
22% |
|
|
|
|
|
|
|
|
|
|
|
|
|
|
|
|
|
|
89% |
|
|
|
|
|||||||
|
|
|
|
|
|
|
|
|
|
|
|
|
|
|
|
|
|
|
|
|
|
|
|
|
|
|
|
|
|
|
|
|
|
|
||
IRISH |
|
|
|
|
|
|
|
|
|
|
47% |
|
|
|
|
|
|
|
79% |
|
|
|
|
|
|
|
|
|
|
|||||||
|
|
|
|
|
|
|
|
|
|
|
|
|
|
|
|
|
|
|
|
|
|
|
|
|
|
|
|
|
|
|
||||||
NIGERIAN |
|
|
|
|
|
22% |
|
|
|
|
|
|
|
|
|
|
|
|
|
|
|
|
|
|
|
92% |
|
|
|
|
||||||
|
|
|
|
|
|
|
|
|
|
|
|
|
|
|
|
|
|
|
|
|
|
|
|
|
|
|
|
|
|
|
|
|
|
|
||
PAKISTANI |
|
|
|
|
|
|
|
32% |
|
|
|
|
|
|
|
|
|
|
|
|
81% |
|
|
|
|
|
|
|
|
|
|
|||||
|
|
|
|
|
|
|
|
|
|
|
|
|
|
|
|
|
|
|
|
|
|
|
|
|
|
|
|
|
|
|
|
|
||||
QATARI |
|
|
|
|
|
|
|
|
|
|
|
|
|
|
57% |
|
|
|
67% |
|
|
|
|
|
|
|
|
|
|
|
|
|
|
|||
RUSSIAN |
|
|
|
|
|
|
|
|
|
|
|
|
|
|
|
|
|
|
|
|
|
|
|
|
|
|
|
|
|
|
|
|
|
|||
|
|
|
|
|
|
|
|
|
|
40% |
|
|
|
|
|
|
|
|
|
81% |
|
|
|
|
|
|
|
|
|
|
||||||
|
|
|
|
|
|
|
|
|
|
|
|
|
|
|
|
|
|
|
|
|
|
|
|
|
|
|
|
|
|
|||||||
SAUDI ARABIAN |
|
|
|
|
|
|
|
|
|
|
|
|
57% |
|
|
64% |
|
|
|
|
|
|
|
|
|
|
|
|
|
|
||||||
|
|
|
|
|
|
|
|
|
|
|
|
|
|
|
|
|
|
|
|
|
|
|
|
|
|
|
|
|||||||||
SOUTH AFRICAN |
|
|
|
|
|
34% |
|
|
|
|
|
|
|
|
|
|
|
84% |
|
|
|
|
|
|
|
|
||||||||||
|
|
|
|
|
|
|
|
|
|
|
|
|
|
|
|
|
|
|
|
|
|
|
|
|
||||||||||||
TIME TO FLY |
|
|
|
|
|
|
|
|
|
|
|
15 APRIL: MOST POPULAR |
|
|
|
|
||||||||||||||||||||
|
|
|
|
|
|
|
|
|
|
|
WEEK FOR OVERSEAS VISITORS |
|||||||||||||||||||||||||
The most popular |
|
|
|
|
|
|
|
|
|
|
|
|
|
|
|
TO FLY TO THE UK |
|
|
|
|
|
|
|
|
|
|
||||||||||
months for travelling |
|
|
|
|
|
|
|
|
|
|
|
|
|
JUNE 3: TO FLY TO THE US |
|
|
|
|
||||||||||||||||||
|
|
|
|
|
|
|
|
|
|
|
|
|
|
|
|
|
|
|
|
|
|
|
|
|||||||||||||
#1 (RANK) |
|
|
|
|
|
|
|
|
|
|
|
|
|
|
|
|
|
|
JUNE 17: TO FLY TO FRANCE |
|||||||||||||||||
|
|
|
|
|
|
|
|
|
|
|
|
|
|
|
|
|
|
|
|
|
|
|
|
|
|
|
|
|
|
|
|
|
|
|
||
#2 |
|
|
|
|
|
|
|
|
|
|
|
|
|
|
|
|
|
|
|
|
|
|
|
|
|
|
|
|
|
|
|
|
|
|
|
|
#3 |
|
|
|
|
|
|
|
|
|
|
|
|
|
|
|
|
|
|
|
|
|
|
|
|
|
|
|
|
|
|
|
|
|
|
|
|
|
|
|
|
|
|
|
|
|
|
|
|
|
|
|
|
|
|
|
|
|
|
|
|
|
|
|
|
|
|
|
|
|
|
|
|
|
#4 |
|
|
|
|
|
|
|
|
|
|
|
|
|
MONTH |
|
|
|
|
|
|
|
|
|
|
|
|
|
|
|
|
|
|
|
|
|
|
#5 |
|
|
|
|
|
|
|
|
|
|
|
|
|
|
|
|
|
|
|
|
|
|
|
|
|
|
|
|
|
|
|
|
|
|
|
|
|
|
|
|
|
|
|
|
|
|
|
|
|
|
|
|
|
|
|
|
|
|
|
|
|
|
|
|
|
|
|
|
|
|
|
|
|
#6 |
|
|
|
|
|
|
|
|
|
|
|
|
|
POPULAR |
|
|
|
|
|
|
|
|
|
|
|
|
|
|
|
|
|
|
|
|
|
|
#8 |
|
|
|
|
|
|
|
|
|
|
|
|
|
|
|
|
|
|
|
|
|
|
|
|
|
|
|
|
|
|
|
|
|
|
|
|
#7 |
|
|
|
|
|
|
|
|
|
|
|
|
|
|
|
|
|
|
|
|
|
|
|
|
|
|
|
|
|
|
|
|
|
|
|
|
|
|
|
|
|
|
|
|
|
|
|
|
|
|
MOST |
|
|
|
|
|
|
|
|
|
|
|
|
|
|
|
|
|
|
|
|
|
|
#9 |
|
|
|
|
|
|
|
|
|
|
|
|
|
|
|
|
|
|
|
|
|
|
|
|
|
|
|
|
|
|
|
|
|
|
|
|
|
|
|
|
|
|
|
|
|
|
|
|
|
|
|
|
|
|
|
|
|
|
|
|
|
|
|
|
|
|
|
|
|
|
|
|
|
#10 |
|
|
|
|
|
|
|
|
|
|
|
|
|
|
|
|
|
|
|
|
|
|
|
|
|
|
|
|
|
|
|
|
|
|
|
|
|
|
|
|
|
|
|
|
|
|
|
|
|
|
|
|
|
|
|
|
|
|
|
|
|
|
|
|
|
|
|
|
|
|
|
|
|
#11 |
|
|
|
|
|
|
|
|
|
|
|
|
|
|
|
|
|
|
|
|
|
|
|
|
|
|
|
|
|
|
|
|
|
|
|
|
#12 |
|
|
|
|
|
|
|
|
|
|
|
|
|
|
|
|
|
|
|
|
|
|
|
|
|
|
|
|
|
|
|
|
|
|
|
|
|
|
|
|
|
|
|
|
|
|
|
|
|
|
|
|
|
|
|
|
|
|
|
|
|
|
|
|
|
|
|
|
|
|
|
||
JANUARY |
FEBRUARY |
MARCH |
APRIL |
|
MAY |
|
|
JUNE |
JULY |
AUGUST |
|
SEPTEMBER |
OCTOBER |
NOVEMBER |
DECEMBER |
|||||||||||||||||||||
Sources: Knight Frank Research, Mapper360® provided by Four Communications
Global wealth trends
HOT SPOTS
After the US, the top five destinations for each nationality
|
|
|
NATIONALITY |
AMERICAN |
AUSTRALIAN |
BRITISH |
CANADIAN |
CHINESE |
EMIRATI |
FRENCH |
INDIAN |
IRISH |
NIGERIAN |
PAKISTANI |
QATARI |
RUSSIAN |
SAUDI ARABIAN |
SOUTH AFRICAN |
|||||||||||||||||||
DESTINATION |
|
|
|
|
|
|
|
|
|
|
|
|
|
|
|
|
3 |
|
|
|
|
|
|
|
|
|
|
|
|
|
|
|
|
|
|||
|
|
|
|
|
|
|
|
|
|
|
|
|
|
|
|
|
|
|
|
|
|
|
|
|
|
|
|
|
|
|
|
|
|||||
BELGIUM |
|
|
|
|
|
|
|
|
|
|
|
|
|
|
|
|
|
|
|
|
|
|
|
|
|
|
|
|
|
|
|
|
|
|
|||
|
|
|
|
|
|
|
|
|
|
|
|
|
|
|
|
|
|
|
|
|
|
|
|
1 |
|
|
|
|
|
|
|
|
|
|
|||
|
|
|
|
|
|
|
|
|
|
|
|
|
|
|
|
|
|
|
|
|
|
|
|
|
|
|
|
|
|
|
|
|
|
||||
BENIN |
|
|
|
|
|
|
|
|
|
|
|
|
|
|
|
|
|
|
|
|
|
|
|
|
|
|
|
|
|
|
|
|
|
|
|||
|
|
|
|
|
|
|
|
|
|
|
|
|
|
|
|
|
|
|
|
|
|
|
|
|
|
2 |
|
|
|
|
|
|
|
|
|||
|
|
2 |
|
|
|
|
|
|
|
|
|
|
3 |
|
|
|
|
|
5 |
|
|
|
|
|
|
|
|
|
|
|
|
|
|
||||
CANADA |
|
|
|
|
|
|
|
|
|
|
|
|
|
|
|
|
|
|
|
|
|
|
|
|
|
|
|
|
|
|
|||||||
|
|
|
|
|
|
|
|
|
|
|
|
|
|
|
|
|
|
|
|
|
|
|
|
|
|
|
|
|
|
|
|
|
|
|
|||
|
|
|
|
|
|
|
|
|
|
5 |
|
|
|
|
|
|
|
|
|
|
|
|
|
|
|
|
|
|
|
3 |
|
4 |
|
|
|||
ECUADOR |
|
|
|
|
|
|
|
|
|
|
|
|
|
|
|
|
|
|
|
|
|
|
|
|
|
|
|
|
|
|
|
|
|||||
|
|
|
|
|
|
|
|
|
|
|
|
|
|
|
|
|
|
|
|
|
|
|
|
|
|
|
|
|
|
|
|
5 |
|
|
|||
|
|
|
|
|
|
|
|
|
|
|
|
|
|
|
|
|
|
|
|
|
|
|
|
|
|
|
|
|
|
|
|
|
|
||||
EGYPT |
|
|
|
|
|
|
|
|
|
|
|
|
|
|
|
|
|
|
|
|
|
|
|
|
|
|
|
|
|
|
|
|
|
|
|
|
|
|
|
|
|
|
|
|
|
|
|
|
|
|
|
|
|
|
|
|
|
|
|
|
|
|
|
|
|
|
|
|
|
|
|
|
|||
|
|
4 |
|
5 |
|
1 |
|
|
3 |
|
|
4 |
|
|
|
|
|
|
|
5 |
|
|
|
|
|
|
|
|
|
|
|
|
|||||
FRANCE |
|
|
|
|
|
|
|
|
|
|
|
|
|
|
|
|
|
|
|
|
|
|
|
|
|
||||||||||||
|
|
|
|
|
|
|
|
|
|
|
|
|
|
|
|
|
|
|
|
|
|
|
|
|
|
|
|
|
|
|
|
|
|
|
|||
|
|
|
|
|
|
|
3 |
|
|
4 |
|
|
|
|
|
|
2 |
|
|
|
2 |
|
|
|
|
|
|
|
|
|
|
|
|
||||
GERMANY |
|
|
|
|
|
|
|
|
|
|
|
|
|
|
|
|
|
|
|
|
|
|
|
|
|
|
|
|
|
||||||||
|
|
|
|
|
|
|
|
|
|
|
|
|
|
|
|
|
|
|
|
|
|
|
|
|
|
|
|
|
|
|
|
|
|
2 |
|||
|
|
|
|
|
|
|
|
|
|
|
|
|
|
|
|
|
|
|
|
|
|
|
|
|
|
|
|
|
|
|
|
|
|
||||
GREECE |
|
|
|
|
|
|
|
|
|
|
|
|
|
|
|
|
|
|
|
|
|
|
|
|
|
|
|
|
|
|
|
|
|
|
|||
|
|
|
|
|
|
|
|
|
|
|
|
|
|
|
|
|
|
|
|
|
|
|
|
|
|
|
|
|
|
|
|
|
|
|
|||
|
|
|
|
|
|
|
|
|
|
|
|
|
2 |
|
|
|
|
|
|
|
|
|
|
|
|
|
|
|
|
|
|
|
|
|
|||
HONG KONG |
|
|
|
|
|
|
|
|
|
|
|
|
|
|
|
|
|
|
|
|
|
|
|
|
|
|
|
|
|
|
|
|
|
||||
|
|
|
|
|
|
|
|
|
|
|
|
|
5 |
|
2 |
|
|
|
|
|
|
|
|
|
|
3 |
|
3 |
|
|
|
|
|
|
|||
|
|
|
|
|
|
|
|
|
|
|
|
|
|
|
|
|
|
|
|
|
|
|
|
|
|
|
|
|
|
|
|||||||
INDIA |
|
|
|
|
|
|
|
|
|
|
|
|
|
|
|
|
|
|
|
|
|
|
|
|
|
|
|
|
|
|
|||||||
|
|
|
|
|
|
|
|
|
|
|
|
|
|
|
|
|
|
|
|
|
|
|
|
|
|
|
|
|
|
|
|
|
|
|
|||
|
|
|
|
|
|
|
4 |
|
|
|
|
|
|
|
|
|
|
|
|
|
|
|
|
|
|
|
|
|
|
|
|
|
|
|
|||
ITALY |
|
|
|
|
|
|
|
|
|
|
|
|
|
|
|
|
|
|
|
|
|
|
|
|
|
|
|
|
|
|
|
|
|
||||
|
|
|
|
|
|
|
|
|
|
|
|
|
|
|
|
|
|
|
|
|
|
|
|
|
|
|
|
|
|
|
|
|
|
||||
JAPAN |
|
|
|
|
3 |
|
|
|
|
|
|
|
|
|
|
|
|
|
|
|
|
|
|
|
|
|
|
|
|
|
|
|
|
|
|||
|
|
|
|
|
|
|
|
|
|
|
|
|
|
|
|
|
|
|
|
|
|
|
|
|
|
1 |
|
|
|
|
|
|
|
|
|||
KENYA |
|
|
|
|
|
|
|
|
|
|
|
|
|
|
|
|
|
|
|
|
|
|
|
|
|
|
|
|
|
|
|
|
|
|
|||
|
|
|
|
|
|
|
|
|
|
|
|
|
|
|
|
|
|
|
|
|
|
|
|
|
|
|
|
5 |
|
|
|
|
|
|
|||
|
|
|
|
|
|
|
|
|
|
|
|
|
|
|
|
|
|
|
|
|
|
|
|
|
|
|
|
|
|
|
|
|
|
||||
KUWAIT |
|
|
|
|
|
|
|
|
|
|
|
|
|
|
|
|
|
|
|
|
|
|
|
|
|
|
|
|
|
|
|
|
|
|
|||
|
|
|
|
|
|
|
|
|
|
|
|
|
|
|
|
|
|
|
|
|
|
|
|
|
|
|
|
|
|
|
|
|
|
5 |
|||
MAURITIUS |
|
|
|
|
|
|
|
|
|
|
|
|
|
|
|
|
|
|
|
|
|
|
|
|
|
|
|
|
|
|
|
|
|
||||
|
|
|
|
|
|
|
|
|
|
|
|
|
|
|
|
|
|
|
|
|
|
|
|
|
5 |
|
|
|
|
|
|
|
|
||||
MALAYSIA |
|
|
|
|
|
|
|
|
|
|
|
|
|
|
|
|
|
|
|
|
|
|
|
|
|
|
|
|
|
|
|
|
|
|
|||
|
|
|
|
|
|
|
|
|
|
|
|
|
|
|
|
|
|
|
|
|
|
|
|
|
|
|
|
|
|
|
|
|
|
|
|||
|
|
3 |
|
|
|
|
|
|
|
2 |
|
|
|
|
|
|
|
|
|
|
|
|
|
|
|
|
|
|
|
|
|
|
|
|
|||
MEXICO |
|
|
|
|
|
|
|
|
|
|
|
|
|
|
|
|
|
|
|
|
|
|
|
|
|
|
|
|
|
|
|
|
|||||
|
|
|
|
|
|
|
|
|
|
|
|
|
|
|
|
|
4 |
|
|
|
|
|
|
|
|
|
|
|
|
|
|
|
|
|
|||
|
|
|
|
|
|
|
5 |
|
|
|
|
|
|
|
|
|
|
|
|
4 |
|
3 |
|
|
|
|
|
|
|
|
|
|
|||||
NETHERLANDS |
|
|
|
|
|
|
|
|
|
|
|
|
|
|
|
|
|
|
|
|
|
|
|
|
|
|
|
|
|
|
|||||||
|
|
|
|
|
|
|
|
|
|
|
|
|
|
|
|
|
|
|
|
|
|
|
|
|
|
|
|
|
|
|
|
|
|
|
|||
|
|
|
|
2 |
|
|
|
|
|
|
|
|
|
|
|
|
|
|
|
|
|
|
|
|
|
|
|
|
|
|
|
|
|
||||
NEW ZEALAND |
|
|
|
|
|
|
|
|
|
|
|
|
|
|
|
|
|
|
|
|
|
|
|
|
|
|
|
|
|
|
|
|
|
||||
|
|
|
|
|
|
|
|
|
|
|
|
|
|
|
4 |
|
|
|
|
|
|
|
|
|
|
|
|
|
|
|
|
|
|
|
|||
|
|
|
|
|
|
|
|
|
|
|
|
|
|
|
|
|
|
|
|
|
|
|
|
|
|
|
|
|
|
|
|
|
|
||||
OMAN |
|
|
|
|
|
|
|
|
|
|
|
|
|
|
|
|
|
|
|
|
|
|
|
|
|
|
|
|
|
|
|
|
|
|
|||
|
|
|
|
|
|
|
|
|
|
|
|
|
|
|
3 |
|
|
|
|
|
|
|
|
|
|
|
|
|
|
|
|
|
|
|
|||
|
|
|
|
|
|
|
|
|
|
|
|
|
|
|
|
|
|
|
|
|
|
|
|
|
|
|
|
|
|
|
|
|
|
||||
PAKISTAN |
|
|
|
|
|
|
|
|
|
|
|
|
|
|
|
|
|
|
|
|
|
|
|
|
|
|
|
|
|
|
|
|
|
|
|||
|
|
|
|
|
|
|
|
|
|
|
|
|
|
|
5 |
|
|
|
|
|
|
|
|
|
|
|
|
4 |
|
|
|
|
|
|
|||
|
|
|
|
|
|
|
|
|
|
|
|
|
|
|
|
|
|
|
|
|
|
|
|
|
|
|
|
|
|
|
|
|
|||||
SAUDI ARABIA |
|
|
|
|
|
|
|
|
|
|
|
|
|
|
|
|
|
|
|
|
|
|
|
|
|
|
|
|
|
|
|
|
|
||||
|
|
|
|
|
|
|
|
|
|
|
|
|
|
|
|
|
|
|
|
|
|
|
|
|
|
|
|
|
|
|
|
|
|
|
|||
|
|
|
|
|
|
|
|
|
|
|
|
|
|
|
|
|
|
|
4 |
|
|
|
|
|
|
|
|
|
|
|
|
|
|
|
|||
SINGAPORE |
|
|
|
|
|
|
|
|
|
|
|
|
|
|
|
|
|
|
|
|
|
|
|
|
|
|
|
|
|
|
|
|
|
|
|||
|
|
|
|
|
|
|
|
|
|
|
|
|
|
|
|
|
|
|
|
|
|
|
|
5 |
|
|
|
|
|
|
|
3 |
|
|
|||
|
|
|
|
|
|
|
|
|
|
|
|
|
|
|
|
|
|
|
|
|
|
|
|
|
|
|
|
|
|
|
|
|
|||||
SOUTH AFRICA |
|
|
|
|
|
|
|
|
|
|
|
|
|
|
|
|
|
|
|
|
|
|
|
|
|
|
|
|
|
|
|
|
|
||||
|
|
|
|
|
|
|
|
|
|
|
|
|
|
|
|
|
|
|
|
|
|
|
|
|
|
|
|
|
|
|
|
|
|
|
|||
|
|
5 |
|
4 |
|
2 |
|
|
|
|
|
|
|
|
|
5 |
|
|
|
3 |
|
|
|
|
|
|
|
4 |
|
|
|
4 |
|||||
SPAIN |
|
|
|
|
|
|
|
|
|
|
|
|
|
|
|
|
|
|
|
|
|
|
|
|
|
|
|||||||||||
|
|
|
|
|
|
|
|
|
|
|
|
|
|
|
|
|
|
|
|
|
|
|
|
|
|
|
|
|
|
|
|
|
|
|
|||
|
|
|
|
|
|
|
|
|
|
|
|
|
|
|
|
|
|
|
3 |
|
|
|
|
|
|
|
|
|
|
|
|
|
|
|
|||
THAILAND |
|
|
|
|
|
|
|
|
|
|
|
|
|
|
|
|
|
|
|
|
|
|
|
|
|
|
|
|
|
|
|
|
|
|
|||
|
|
|
|
|
|
|
|
|
|
|
|
|
|
|
|
|
|
|
2 |
|
|
|
|
4 |
|
4 |
|
2 |
|
5 |
|
1 |
|
3 |
|||
|
|
|
|
|
|
|
|
|
|
|
|
|
|
|
|
|
|
|
|
|
|
|
|
|
|
|
|
||||||||||
UAE |
|
|
|
|
|
|
|
|
|
|
|
|
|
|
|
|
|
|
|
|
|
|
|
|
|
|
|
|
|||||||||
|
|
|
|
|
|
|
|
|
|
|
|
|
|
|
|
|
|
|
|
|
|
|
|
|
|
|
|
|
|
|
|
|
|
|
|||
|
|
1 |
|
1 |
|
|
|
|
1 |
|
|
1 |
|
1 |
|
1 |
|
1 |
|
1 |
|
2 |
|
|
|
1 |
|
1 |
|
2 |
|
1 |
|||||
UK |
|
|
|
|
|
|
|
|
|
|
|
|
|
|
|
|
|
|
|||||||||||||||||||
|
|
|
|
|
|
|
|
|
|
|
|
|
|
|
|
|
|
|
|
|
|
|
|
|
|
|
|
|
|
|
|
|
|
|
|||
|
|
|
|
|
|
|
|
|
|
|
|
|
|
|
|
|
|
|
|
|
|
|
|
|
|
|
|
|
|
2 |
|
|
|
|
|||
UKRAINE |
|
|
|
|
|
|
|
|
|
|
|
|
|
|
|
|
|
|
|
|
|
|
|
|
|
|
|
|
|
|
|
|
|
|
|||
|
|
|
|
|
|
|
|
|
|
|
|
|
|
|
|
|
|
|
|
|
|
|
|
|
|
|
|
|
|
|
|
|
|
|
|||
|
|
|
|
|
|
|
|
|
|
|
|
|
|
|
|
|
|
|
|
|
|
|
Sources: Knight Frank Research, Mapper360® provided by Four Communications |
||||||||||||||
|
|
|
|
|
|
|
|
|
|
|
|
|
|
|
|
|
|
|
|
|
|
|
|
|
|
||||||||||||
24 | KNIGHTFRANK.COM |
25 | KNIGHTFRANK.COM |

vk.com/id446425943
MOVING MONEY AND RESIDENCY
Risk and reward
The Wealth Report assesses the factors driving capital movements around the world and takes a detailed look at wealth flows from three major hubs
Words: Flora Harley, Senior Analyst, Knight Frank Research
Wealth flows are influenced by many factors, including economic and personal stability, and preservation of wealth. Understanding these
ers can help provide insight into the direction investment flows, and how they impact on both residentialandcommercialpropertymarkets.
Increasingly, governments around the world are targeting globally mobile wealth, albeit for a variety of different reasons. Some are actively enticing wealthy individuals to relocate with favourable tax regimes, while others are introducing overseas buyer taxation on residential purchases.
Italy, for example, has introduced a new fixed
of €100,000 on global income for “non-domiciled” residents. Conversely, Singapore increased the foreign buyer stamp duty on residential property to 20% in July 2018. In England and Northern Ireland, a consultation on an overseas buyer’s taxation is scheduled to begin in 2019.
The backdrop to all this is the increasingly footloose natureofwealth.DatafromourAttitudesSurveyindicates that 36% of UHNWIs already hold a second passport, up from 34% last year, with 26% planning to emigrate permanently, up from 21%.
Enabling this is a growing number of citizenship and residency by investment schemes, with Moldova and Montenegro the latest to jump on the bandwagon in 2018. However, as we reported in The Wealth Report Autumn Update 2018, the OECD is scrutinising the potential misuse of these schemes. In October 2018, it released a “blacklist” of 21 jurisdictions, including Malta and Cyprus, that it believes are undermining international efforts to combat tax evasion. Some have since been removed from the list after putting in place a mechanism for the exchange of information.
A similar study is being conducted by the EU. Portugal is just one country under the microscope, with the authorities there coming under fire for issuing a golden visa – permanent residency, in return for a financial investment – to a Russian national wanted by Interpol.
Emerging woes
However, growing economic risk in emerging markets could boost demand for such schemes as money is channelled to safer havens. In October, the International Monetary Fund lowered growth forecasts for emerging markets from 4.9% in 2018 and 5.1% in 2019 to 4.7% in both years due to economic uncertainty and upheaval.
This concern is partly due to trade tensions between the US and China, as well as a result of investors seeking returns and turning to currency speculation. many citizens in these economies, including IndonesiaandChina,havepreviouslywitnessed strictercapitalcontrolsduetoeconomicdownturns, those who can may well be looking at options to keep their wealth globally mobile.
However, even if liquidity can be maintained, confidentiality is becoming harder to guarantee in certain parts of the world.
The EU, for example, is following the UK’s lead transparency measures with the approval of Anti-Money Laundering Directive in May 2018.
This will introduce fully public registers of the beneficial ownership of companies throughout the EU.
But such transparency is not finding universal favour: anumberofEUcountriesrecognisetheneedforregulators to be informed, but not for information to be made public.
FOCUS ON CHINA
In the past two years, China’s tightening grip on capital outflows has cast a shadow over outbound investment. The introduction of stricter controls has been partly driven by concern over falling foreign exchange reserves, which the government uses to maintain the value of the country’s own currency.
In the second half of 2016, China’s foreign currency reserveassetsfellbyUS$203billionasaresultofexchange rate fluctuations from a raft of overseas acquisitions. Across 2018 China’s foreign currency reserves fell by US$67 billion, although many of the declines seen in the earlier half of the year were beginning to reverse. If the exchange rate, which on 11 January 2019 stood at 6.76 renminbi to the US dollar, falls further, this decline could be exacerbated, possibly leading to further restrictions on overseas investment by Chinese nationals.
Real estate is now classified as a “sensitive” sector, which means almost all investments into overseas property markets require stringent official approval, especially for large transactions. Despite this, Chinese buyers are still looking at familiar global markets, such as London, Sydney, Melbourne and Hong Kong, which offer language advantages and immigration possibilities, as well as remaining outside any trade disputes.
The worsening trade relationship between China and the US may cause Chinese investors to shift their presence into other key markets. Indeed, there is already evidence for this: in the year to March 2018 there was a 4% decline in US transactions by buyers from mainland China, Hong Kong and Taiwan compared with the previous 12 months, according to the National Association of Realtors’ 2018 Profile of International Transactions in US Residential Real Estate.
Controls on capital outflows have had a limited impact on China’s domestic residential market. House prices across China grew by 24% between the beginning of 2016 and the third quarter of 2018 – but purchase restrictions applied across mainland Chinese cities are starting to exert downward pressure on prices.
FOCUS ON INDIA
India is witnessing a substantial rise in personal wealth. The country’s UHNWI population has grown by 30% in the past five years, according to data from GlobalData WealthInsight (see page 86), fuelling increased appetite for overseas real estate investments.
The results of our Attitudes Survey found that 24% of Indian UHNWIs have property investments, excluding first and second homes, outside India, up from 21% the
Global wealth trends
See page 72 for our latest luxury investment index
Slowing the flow As part of its attempts to bolster foreign currency reserves, China is imposing tighter restrictions on overseas property investment
26 | KNIGHTFRANK.COM |
27 | KNIGHTFRANK.COM |

vk.com/id446425943
MOVING MONEY AND RESIDENCY
previous year. Indian buyers are typically attracted by world class education opportunities for their children, new business ventures and stable investment returns. Coveted markets such as London, Melbourne and Dubai draw significant interest. However, other markets, particularly in Cyprus, Malaysia and Sri Lanka, are also proving popular with Indian investors.
Despite the restrictions in place under the Liberalised Remittance Scheme (LRS), there is a clear and growing interest from Indian nationals to invest abroad. The LRS permits each resident, as of May 2015, to remit up to US$250,000 overseas per financial year. Since the implementation of the higher limit, Indian residents have sent nearly US$30 billion overseas, with remittances up by 144% between the 2015/16 and 2017/18 financial years.
At present, there is no indication that there will be any change to the LRS limits. The last time the LRS limit was reduced was in 2013, partly driven by the Current Account Deficit (CAD) reaching 4.8% of GDP. Despite the recent depreciation of the Indian rupee, down 9.6% against the US dollar in the year to January 2019, the CAD remains within its “comfort zone”, most recently cited as 2.9%. However, it is worth noting that with a central government election due in the middle of 2019, there could be further economic changes that may impact outward flows.
FOCUS ON THE MIDDLE EAST
The spread of private wealth across the Middle East region is centred on the major Gulf States, with Saudi Arabia taking the top spot, followed by the United Arab Emirates, Kuwait, Qatar, Oman and Bahrain.
While oil income boosts government revenues, the two biggest sources of wealth for the private sector have been the construction and financial services sectors. Today, these are prominent in the investment portfolios of Middle Eastern private billionaires, accounting for 23% and 15% respectively.
Given the Gulf Cooperation Council’s social context, family businesses are the largest player in trading activities.KnightFrankMiddleEast’sWealthIntelligenceteam has identified 1,300 family businesses across the region. Inlinewithglobaltrends,generationaltransitionremains a challenge: just 7% of billionaire businesses survive to their fourth generation, and only 2% to their fifth.
As a result, Middle Eastern families are increasingly turning their attention to generational planning to preserve the passage of wealth. One consequence of this
HUNTING HIGH AND LOW
Middle Eastern wealth currently seeking new property investment opportunities (US$)
BAHRAIN |
SAUDI ARABIA |
KUWAIT |
OMAN |
QATAR |
|
UAE |
|||||||
0.4bn |
1.9bn |
|
0.1bn |
0.2bn |
0.8bn |
|
2.8bn |
||||||
|
|
|
|
|
|
|
|
|
|
|
|
|
|
LONDON |
UK REGIONAL |
EUROPE |
US |
3.3bn |
1.0bn |
1.3bn |
0.6bn |
Data as of 10 December 2018 |
Source: Knight Frank Middle East Wealth Intelligence |
||
is that investment is increasingly outward looking. Volatile oil revenues, regulatory changes such as VAT, geopolitical uncertainty and government investigations remain a key driver of outbound flows.
Real estate remains a significant wealth preservation asset class. Middle Eastern investors have been longstanding players in global real estate markets, in particular in the UK, Europe and US. Recently, this appetite for global geographic diversification has intensified due to the continued strength of the US dollar. Data from our Attitudes Survey shows that 29% of Middle Eastern UHNWIs increased their exposure to property in 2018.
Knight Frank Middle East’s Wealth Intelligence team has mapped the requirements of private wealthy investors in the Middle East. At the end of 2018, there was an estimated US$6.2 billion looking to be invested into commercial property alone, with a significant amount targeting the UK. London remains the top target, followed by other European cities, such as Berlin. This is driven by stability, transparency, liquidity, good returns and cost of debt.
In terms of sectors, office and hospitality remain preferred segments. However, following global trends and opportunities, there is an increasing enthusiasm and consideration for more specialist sectors, such as healthcare, education and the private rented sector.
Property market update
Residential and commercial property trends
Turning point |
What, where, why |
The latest results of the Knight Frank |
A round-up of the property |
Prime International Residential Index |
investment market in 2018 |
– page 30 |
– page 36 |
Singapore king
Investor Raj Kumar on the secrets of his success
– page 38
For sale through Knight Frank - Huxley House, St. John’s Wood
28 | KNIGHTFRANK.COM
vk.com/id446425943
LUXURY RESIDENTIAL MARKETS
TURNING POINT
We share our unique annual round-up of the winners and losers in the world of luxury residential property
Words: Kate Everett-Allen,
Head of International Residential Research, Knight Frank
The value of the 100 luxury residential markets tracked by the Knight Frank Prime International Residential Index (PIRI 100) increased on average by 1.3% last year, down from 2.1% in 2017 – and the Index’s lowest rate of
annual growth since 2012.
This decline comes as little surprise. As we learn to live without the ultra-low interest rates that have supercharged real estate markets globally since 2008, lower price growth is an inevitable consequence of the shift in monetary policy.
For sale through Knight Frank - Villa Sazia, Saint Jean - Cap Ferrat
Property market update
A year ago, 11 cities registered double-digit annual growth; in 2018, only five fell into this bracket. Yet despite the slowdown, almost three-quarters of the locations in the PIRI 100 registered rising or static growth in 2018 compared with 65 in 2017.
European cities are still performingstrongly,whilecities
Greater China continue slide down the rankings. However, divergence is appearing in emerging markets. Despite their economic woes, severa l key Lat in American cities saw prime prices increase,
while similarly challenged luxury markets in Turkey seeing sharp reversals in value.
Key global wealth hubs such as New York, London and Geneva, as well as cities that might be expected to still be enjoying a postfinancial crisis bounce (or, indeed, a preBrexit boom) such as Dublin, are now finding themselves in negative territory.
Below, we share some key findings and trends from the PIRI 100, along with insights from our research teams around the world.
Thriller in Manila
Manila tops the PIRI 100, with luxury home prices rising by 11%. This is driven by a lack of supply and the Philippines’ thriving economy
– a n n u a l G D P growth exceeded 6% in 2018 – which motivated some expatriates to grab a slice of real estate
back home. However, Manila’s
performance needs to be put into perspective. In the 12 years we have been compiling PIRI, the
top-performing market has yet to record annual growth below 21%. So 11% is quite a departure, but it confirms our theory that prime markets are converging and the outliers are disappearing.
Optimistic outlook Demand remains strong in French hotspots such as Cap Ferrat
THE PIRI 100 |
Luxury residential market performance by global rank and geography |
|
|
|
|
|
(annual % change December 2017 to December 2018) |
KEY: (AF) AFRICA - (AS) ASIA - (AU) AUSTRALASIA - (CA) CARIBBEAN - (EU) EUROPE - (LA) LATIN AMERICA - (ME) MIDDLE EAST - (NA) NORTH AMERICA - (RU) RUSSIA & CIS |
11.1% |
10.6% |
10.5% |
10.0% |
10.0% |
9.5% |
9.1% |
8.6% |
8.1% |
7.8% |
6.8% |
6.5% |
6.5% |
6.3% |
6.1% |
6.0% |
6.0% |
6.0% |
5.3% |
5.1% |
5.0% |
5.0% |
4.3% |
4.1% |
4.0% |
4.0% |
4.0% |
3.8% |
3.3% |
3.1% |
3.0% |
3.0% |
3.0% |
3.0% |
2.8% |
2.8% |
2.6% |
2.5% |
2.3% |
2.3% |
2.2% |
2.1% |
2.1% |
2.0% |
2.0% |
2.0% |
1.8% |
1.8% |
1.7% |
1.5% |
1.5% |
1.5% |
1.5% |
1.5% |
1.4% |
1.1% |
1.1% |
1.0% |
1.0% |
0.9% |
0.7% |
0.7% |
0.6% |
0.5% |
0.5% |
0.5% |
0.3% |
0.3% |
0.3% |
0.2% |
0.1% |
0.0% |
0.0% |
0.0% |
-0.7% |
-1.0% |
-1.5% |
-1.5% |
-1.5% |
-2.0% |
-2.3% |
-2.5% |
-2.5% |
-2.5% |
-2.8% |
-3.0% |
-3.4% |
-3.8% |
-3.9% |
-4.3% |
-4.4% |
-4.5% |
-5.0% |
-5.7% |
-7.2% |
-7.5% |
-10.0% |
-10.4% |
-11.5% |
-25.0% |
MANILA |
EDINBURGH |
BERLIN |
MUNICH |
BUENOS AIRES |
MEXICO CITY |
SINGAPORE |
BOSTON |
MADRID |
SAN FRANCISCO |
TOKYO |
JERSEY |
BARCELONA |
TORONTO |
SEATTLE |
LISBON |
ALGARVE |
CHAMONIX |
PARIS |
FRANKFURT |
ASPEN |
LOS ANGELES |
MOSCOW |
AUCKLAND |
AMSTERDAM |
CAP FERRAT |
BEIJING |
CAPE TOWN |
MIAMI |
SYDNEY |
VAL D'ISÈRE |
MARBELLA |
BRISBANE |
WASHINGTON DC |
CYPRUS |
VERBIER |
JAKARTA ST RÉMY DE PROVENCE |
CHICAGO |
GUANGZHOU |
MELBOURNE |
PERTH |
GOLD COAST |
MUSTIQUE |
GSTAAD |
MONACO |
CANNES |
HONG KONG |
SÃO PAULO |
OSLO |
COURCHEVEL 1850 |
IBIZA |
VENICE |
ÉVIAN |
DELHI |
MEGÈVE |
BENGALURU |
FLORENCE |
KUALA LUMPUR |
MÉRIBEL |
VIENNA |
ST PETERSBURG |
PHUKET |
LUCCA |
LAKE COMO |
ROME |
MUMBAI |
BAHAMAS |
ST BARTS |
MILAN |
SHANGHAI |
SARDINIA |
LAUSANNE |
BARBADOS |
BANGKOK |
ZURICH |
BRUSSELS |
ST TROPEZ |
TAIPEI |
GENEVA |
STOCKHOLM |
RIYADH |
UMBRIA |
NEW YORK |
DUBLIN |
MALLORCA DUBAI RIO DE JANEIRO |
OXFORD |
ABU DHABI |
LONDON |
NAIROBI |
BRITISH VIRGIN ISLANDS |
DOHA |
BODRUM |
ST MORITZ |
THE HAMPTONS |
ISTANBUL |
VANCOUVER |
LAGOS |
|||
AS |
EU |
EU |
EU LA LA AS NA EU NA AS EU EU |
NA |
NA |
EU EU EU EU EU NA NA RU AU EU |
EU AS AF NA AU |
EU EU AU NA EU EU AS EU |
NA AS AU AU AU CA EU EU EU AS |
LA |
EU |
EU EU EU EU AS EU AS |
EU |
AS |
EU EU |
RU AS |
EU EU |
EU AS CA CA EU AS |
EU |
EU |
CA AS |
EU EU |
EU AS EU EU ME EU |
NA |
EU |
EU |
ME |
LA EU |
ME EU |
AF CA ME ME |
EU |
NA |
ME |
NA |
AF |
||||||||||||||||||||||||||||||||||||||||||||||||||||||||||||||||
1 |
2 |
3 |
4= |
4= |
6 |
7 |
8 |
9 |
10 |
11 |
12= |
12= |
14 |
15 |
16= |
16= |
16= |
19 |
20 |
21= |
21= |
23 |
24 |
25= |
25= |
25= |
28 |
29 |
30 |
31= |
31= |
31= |
31= |
35= |
35= |
37 |
38 |
39= |
39= |
41 |
42= |
42= |
44= |
44= |
44= |
47= |
47= |
49 |
50= |
50= |
50= |
50= |
50= |
55 |
56= |
56= |
58= |
58= |
60 |
61= |
61= |
63 |
64= |
64= |
64= |
67= |
67= |
67= |
70 |
71 |
72= |
72= |
72= |
75 |
76 |
77= |
77= |
77= |
80 |
81 |
82= |
82= |
82= |
85 |
86 |
87 |
88 |
89 |
90 |
91 |
92 |
93 |
94 |
95 |
96 |
97 |
98 |
99 |
100 |
The Knight Frank Prime International Residential Index (PIRI 100) tracks the movement in the price of luxury homes |
Sources: All data comes from Knight Frank’s global network with the exception of: Tokyo (Ken Corporation); São Paulo and Rio de Janeiro (Fundação Instituto de Pesquisas Econômicas); Oslo (Torbjørn Ek); Chicago, Los Angeles, Miami, New York, |
|
San Francisco, Seattle and Washington DC (S&P CoreLogic Case-Shiller); Barcelona (Ministerio de Fomento); Jersey (States of Jersey); Berlin and Frankfurt (ImmobilienScout 24); Toronto (Toronto Real Estate Board); |
|
Mexico (Sociedad Hipotecaria Federal); Stockholm (Svensk Mäklarstatistik AB). |
|
Notes: All price changes in local currencies. Data for Cyprus relates to the period June 2017 to June 2018. Data for Barcelona and Jersey relates to the period September 2017 to September 2018. Data for Chicago, Los Angeles, Miami, New York, |
|
San Francisco, Seattle and Washington DC relates to the period October 2017 to October 2018. Data for Abu Dhabi, Berlin, Doha, Dubai, Frankfurt, Rio de Janeiro, Riyadh, São Paulo, Toronto and Vancouver relates to the period November 2017 to |
|
November 2018. Data for Stockholm relates to the period 1 January 2018 to 5 December 2018. Price change for Tokyo relates to properties above ¥100m. |
|
Data for Boston relates to downtown condominiums. Data for Buenos Aires relates to new-build properties only. |
30 | KNIGHTFRANK.COM |
31 | KNIGHTFRANK.COM |
vk.com/id446425943
LUXURY RESIDENTIAL MARKETS
PRIME MOVERS
Mapping luxury price movements worldwide
The Knight Frank Prime International Residential Index (PIRI 100) is now in its 12th year and tracks the movement in luxury prices across the world’s top residential markets. The index covers major financial centres, gateway cities and second home hotspots – both coastal and rural – as well as leading luxury ski resorts.
Miami
Stacey Watson, Knight Frank International
Home to around 33,300 millionaires, we expect Miami to record prime price growth of 5% in 2019, outperforming a number of other key US cities. Prices are rising from a comparatively low base, new investment in the form of the Brightline train is boosting the local economy and Florida’s low tax status may spur some US residents to move to the sunshine state in the wake of the new State and Local Tax (SALT) deductions.
Property market update
Singapore
Dr Lee Nai Jia, Knight Frank Singapore
Singapore’s path over recent years has been an erratic one, with prime prices stifled by stringent taxes and cooling measures. A reduction in Seller’s Stamp Duty in 2017 was interpreted by some as a change in policy sentiment, prompting a surge in demand, but a further tightening of stamp duties for nonresidents and developers in 2018 has halted the market. A slowdown in 2019 looks likely, although solid economic fundamentals should prevent prime price growth from entering negative territory.
Paris
Roddy Aris, Knight Frank International
Steady and sustainable defines Paris’s 5.3% price growth in 2018, which comes on the back of a 12% uplift in 2017. The city’s wide Haussmannian boulevards are enticing French expatriates and appealing to overseas buyers, including those from the US, the Middle East and China. At around €19,000 per sq m, prime prices in Paris are around half those found in London and New York and with largescale regeneration projects planned ahead of the 2024 Paris Olympics, investors as well as second home owners will be paying closer attention to the French capital.
Perth
Michelle Ciesielski, Knight Frank Australia
Early signs of business recovery and a strengthening office market had a positive impact on the prime residential market in Perth, with prices rising 2.1% in 2018. Properties along the waterfront have remained popular with the downsizing generation, and the city still offers good value relative to other major Australian cities. The spotlight in 2019 will remain on the pace of recovery as the Western Australian resources sector continues to build.
Mumbai
Arvind Nandan, Knight Frank India
Although non-residents are subject to restrictions when buying in India, the real estate market is opening up, and new regulations are boosting transparency. Pricegrowthwaslargelystaticin2018(0.3%) as developers offered discounts to dispose of unsold inventory. India is now the world’s fastest growing major economy according to the International Monetary Fund, with GDP growth of 7.5% forecast for 2019, and although prices may soften in the short term due to excess supply, in the long term we expect wage grow th and strong investment in infrastructure to bolster demand.
Sources: All data comes from Knight Frank’s global network with the exception of: Tokyo (Ken Corporation); São Paulo and Rio de Janeiro (Fundação Instituto de Pesquisas Econômicas); Oslo (Torbjørn Ek); Chicago, Los Angeles, Miami, New York, San Francisco, Seattle and Washington DC (S&P CoreLogic Case-Shiller); Barcelona (Ministerio de Fomento); Jersey (States of Jersey); Berlin and Frankfurt (ImmobilienScout 24); Toronto (Toronto Real Estate Board); Mexico (Sociedad Hipotecaria Federal); Stockholm (Svensk Mäklarstatistik AB).
Notes: All price changes in local currencies. Data for Cyprus relates to the period June 2017 to June 2018. Data for Barcelona and Jersey relates to the period September 2017 to September 2018. Data for Chicago, Los Angeles, Miami, New York, San Francisco, Seattle and Washington DC relates to the period October 2017 to October 2018. Data for Abu Dhabi, Berlin, Doha, Dubai, Frankfurt, Rio de Janeiro, Riyadh, São Paulo, Toronto and Vancouver relates to the period November 2017 to November 2018. Data for Stockholm relates to the period 1 January 2018 to 5 December 2018. Price change for Tokyo relates to properties above ¥100m.
Data for Boston relates to downtown condominiums. Data for Buenos Aires relates to new-build properties only.

vk.com/id446425943 |
|
|
|
|
|
|
|
||
LUXURY RESIDENTIAL MARKETS |
|
|
|
|
|
|
|
||
|
|
|
|
|
|
|
|
|
continues to evolve, its capacity for future |
|
|
|
|
|
|
|
|
|
|
|
|
|
|
|
|
|
|
|
|
|
|
RELATIVE VALUES |
|
|
|
|
|
|
growth is significant.” |
|
|
|
|
|
|
|
|
Once anaemic at best, Europe’s second |
|
|
|
|
|
|
|
|
|
||
|
|
|
|
|
|
|
|
||
|
|
|
|
|
|
|
|
||
|
|
How many square metres |
|
|
|
|
|
|
home markets have steadied. Lisbon (+6%) |
|
|
of prime property does |
|
|
|
|
|
|
|
|
|
US$1m* buy in key cities? |
|
|
|
|
|
|
and the Algarve (+6%) are both correcting |
|
|
|
|
|
|
SIZE |
|
|
|
|
|
|
|
|
|
|
|
after a decade-long downturn. In France, |
|
|
|
CITY |
|
|
|
(SQ M) |
|
|
|
|
|
|
|
|
|
|
|
President Macron’s honeymoon period |
|
|
|
|
|
|
|
|
|
|
|
|
|
MONACO |
16 |
|
|
may be over, but optimism among prime |
|||
|
|
|
|
|
|
|
|
|
|
|
|
HONG KONG |
22 |
|
|
buyers shows little sign of wavering. Our |
|||
|
|
NEW YORK |
31 |
|
|
data shows enquiries for French homes |
|||
|
|
LONDON |
31 |
|
|
rose by 59% in 2018 compared with 2017. |
|||
|
|
|
|
Of the 11 French markets tracked by PIRI, |
|||||
|
|
|
|
|
|
|
|
|
|
|
|
SINGAPORE |
36 |
|
|
only St Tropez saw prices slip lower, albeit |
|||
|
|
|
|
|
|
|
|
|
|
|
|
LOS ANGELES |
39 |
|
|
by just -1.5%. |
|||
|
|
GENEVA |
41 |
|
|
|
|||
|
|
PARIS |
46 |
|
|
AT A GLANCE |
|||
|
|
SHANGHAI |
57 |
|
|
||||
|
|
SYDNEY |
52 |
|
|
|
|||
|
|
BEIJING |
67 |
|
|
Manila leads |
|||
|
|
TOKYO |
67 |
|
|
the PIRI 100 |
|||
|
|
BERLIN |
73 |
|
|
for 2018 with |
|||
|
|
MIAMI |
93 |
|
|
11% annual growth |
|||
|
|
MELBOURNE |
97 |
|
|
|
|||
|
|
MUMBAI |
100 |
|
|
|
|||
|
|
ISTANBUL |
109 |
|
|
|
|||
|
|
DUBAI |
143 |
|
|
Safe havens |
|||
|
|
|
|
Capital flight, particularly from politically |
|||||
|
|
|
|
|
|
|
|
|
|
|
|
CAPE TOWN |
177 |
|
|
volatile emerging markets, continues to fuel |
|||
|
|
SÃO PAULO |
200 |
|
|
demand. In Madrid, Venezuelan buyers are |
|||
|
|
|
|
|
|
|
|
|
being joined by others from Latin America, |
|
|
|
|
|
|
|
|
|
while Turkish buyers are active in Germany |
|
|
|
|
|
|
|
|
|
and the Middle East. As our second home |
|
|
|
|
|
|
|
|
|
ownership chart on page 35 shows, economic |
|
|
HUMAN AT SCALE |
|
|
|
Sources: Knight Frank Research, |
|
|
and political volatility seem to be pushing |
|
|
|
|
|
|
|
|
wealth to new markets. |
|
|
|
* Exchange rates calculated at 31 December 2018 |
|
|
|
Douglas Elliman, Ken Corporation |
|
|
|
|
|
|
|
|
|
|
|
|
Interestingly, security concerns help to |
|
|
|
|
|
|
|
|
|
explain the 10% rise seen in Buenos Aires. |
Continental shifts |
|
|
|
|
|
|
|||
a decade of subdued growth when the market |
Interest in more secure new-build apart- |
||||||||
Burgeoning rental demand, limited supply |
reacted to political uncertainty as well as |
ments has helped push luxury prices higher. |
|||||||
and, in most cases, buoyant local economies |
the introduction of higher purchase taxes.” |
|
|||||||
mean four European cities, led by Edinburgh |
In Berlin, Till Brühöfener-McCourt, Head of |
Taking back control |
|||||||
(+10.6%) and Berlin (+10.5%) make the top ten, |
ResearchatourGermanpartnerZiegert,says: |
Singapore saw prices rise by just over |
|||||||
despite slower growth across the euro zone. |
“The city is still relatively young compared |
9%, marking the high point of its current |
|||||||
|
However, as my colleague Oliver Knight |
with other European cities and 2019 marks |
market cycle, according to Dr Lee Nai Jia, |
||||||
points out, “Edinburgh’s surge follows nearly |
its 30th birthday as a reunified city. As it |
our Head of Research there. The city has |
|||||||
Property market update
For sale through Knight Frank - One Blackfriars, London
been subject to more than 15 macroprudential regulations – or cooling measures
– since 2010. 2018 was no exception, with stamp duty for non-residents rising to 20%.
Auckland (+4.1%), Beijing (+3.9%), Guangzhou (+2.3%), Hong Kong (+1.8%), Shanghai (+0.1%) and Vancouver (-11.5%) also saw policymakers flex their muscles in an attempt to cool prices. Measures ranged from a ban on the purchase of existing homes by overseas buyers in New Zealand to a proposed vacancy tax on new developments in Hong Kong to higher mortgage rates and a points-based system for new buyers in some Chinese cities.
Hong Kong has been defying the odds for several years now with new price thresholds broken year-on-year but as David Ji, Knight Frank’s Head of Research for Greater China explains, 2018 marked a
turning point. “The stock market slid 13.6%, its worst decline since 2011, and interest rate hikes influenced buyer sentiment.”
Vancouver, arguably recipient of the most stringent regulations in 2018–in- cluding higher taxes for non-residents, a speculation and vacancy tax, an empty homes tax and an increased school tax for properties above C$3 million – is also still absorbing the impact of China’s tightening of capital controls, which up until late 2016 had been an influential source of demand.
NYLON futures
The impact of Brexit has been largely priced into the prime London market since the referendum in 2016, with prices in some neighbourhoods falling by as much as 20%. However, there is growing evidence of pentup demand as buyer registrations build,
Bouncing back Buyer registrations are building for prime London property
HOME FROM HOME |
74% |
|
|
||
Proportion of UHNWIs owning |
65% |
|
second homes outside their |
||
|
||
country of residence |
|
|
46% |
49% |
|
|
||
35% 35% |
|
15% 17%
MIDDLE EAST
LATIN AMERICA
EUROPE
RUSSIA & CIS
NORTH AMERICA
ASIA
AFRICA
AUSTRALASIA
Source: The Wealth Report Attitudes Survey 2019
suggesting that when – or if –a deal is agreed, theremaybeabounceasthosewhohavebeen wavering on the sidelines decide to commit.
The consultation period for a non-resident Stamp Duty Land Tax surcharge is now underway but international buyers, particularly those with US dollars (see currency chart on page 32), may be unfazed by the proposed 1% tax if the pound takes a tumble.
InNewYork,theStateandLocalTax(SALT) law, stock market volatility and a strong US dollar, which led some foreign buyers to sit on their hands during 2018, have compounded the underlying structural issue of oversupply. However, as Andrew Wachtfogel, Senior Vice President of Research and Analytics at our US partners Douglas Elliman points out, with Wall Street bonuses expected to be robust in 2019 and mortgage interest rates still near historic lows, there may be a silver lining.
34 | KNIGHTFRANK.COM |
35 | KNIGHTFRANK.COM |
vk.com/id446425943
COMMERCIAL REAL ESTATE
What, where, why
Knight Frank’s capital markets research team analyses key commercial property investment trends with a focus on where private capital is being spent
Data analysis by Lily Nguyen, Knight Frank Research
MARKET OVERVIEW
HOW MUCH IS BEING INVESTED?
Amount invested globally into commercial real estate*
|
US$1.2 trillion |
|
|
|
|
Q3 2018 |
|
|
|
||
|
1.0 |
US$907 BILLION |
|
|
0.8 |
|
|
|
|
|
|
See our top |
0.6 |
|
|
investment picks |
|
|
|
|
|
|
|
on page 46 |
0.4 |
|
|
|
|
|
|
0.2
0
2007 |
2010 |
2015 |
2018 |
 WHERE IS INVESTMENT COMING FROM?
The largest source of cross-border real estate investment capital is North America with the majority of this capital focused on investing within the US, although Canada, the UK and mainland Europe remain key targets
Top investment destinations for regional real estate investors (in US$)*
TOP LOCATIONS FOR INVESTMENT FROM NORTH AMERICA |
FROM EUROPE |
|
FROM ASIA-PACIFIC |
OTHER |
|
||||
US |
|
|
|
GERMANY |
UK |
CHINA |
JAPAN |
US |
|
362bn |
|
|
|
49bn |
41bn |
25bn |
23bn |
13bn |
|
|
|
|
|
|
|
AUSTRALIA |
US |
UK |
|
|
|
|
|
|
|
8bn |
|
||
|
|
|
|
|
|
20bn |
20bn |
|
|
|
|
|
|
FRANCE |
US |
NETH |
|
HK |
|
|
|
|
|
35bn |
19bn |
14bn |
|
5bn |
|
|
|
|
|
|
|
||||
|
|
|
|
|
|
HONG KONG |
|
GER |
5bn |
|
|
|
|
|
|
|
|
|
|
CANADA |
17bn |
UK |
11bn SPAIN |
10bn GERMANY 9bn |
|
20bn |
|
CHINA |
3bn |
 WHERE IS MOST CAPITAL BEING INVESTED?
Local and cross-border invested volumes (in US$)*
GERMANY
69bn
UK
76bn
US |
|
414bn |
31bn |
|
NETHERLANDS
21bn
HONG KONG
28bn
 US$1 BILLION
 US$10 BILLION US$50 BILLION
US$100 BILLION
27bn
 WHAT ARE THE MOST POPULAR INVESTMENTS?
Investment |
|
|
|
|
|
|
SENIOR |
volumes by sector |
|
|
|
|
|
|
HOUSING |
(US$)* |
OFFICE |
APARTMENT |
RETAIL |
INDUSTRIAL |
|
HOTEL |
& CARE |
330bn |
202bn |
153bn |
140bn |
|
62bn |
20bn |
|
|
|
||||||
|
|
|
|
|
|
|
*12 months to Q3 2018 |
 WHO'S BUYING?
Commercial property investment volumes by buyer type (US$)*
INSTITUTIONAL
385bn
PRIVATE/
UNLISTED
289bn
LISTED/REIT
174bn
USER/OTHER
38bn
UNKNOWN
22bn
PropertyGlobalmarketWeal hupdateTrends
FOCUS ON PRIVATE CAPITAL
 HOW MUCH IS INVESTED PRIVATELY?
Private investment in commercial real estate has been rising since 2010. Investors looking to diversify their investments are attracted by the secure income plus the ability to actively manage the asset to drive further performance
Volume of private capital investments (US$)* |
Q3 2018 |
$289 BILLION
$300 billion 250 200 150 100 50
0
|
2010 |
2012 |
2014 |
2016 |
2018 |
WHAT DOES PRIVATE CAPITAL INVEST IN?
Volume of private capital investments*
APARTMENT |
OFFICE |
RETAIL |
INDUSTRIAL & LOGISTICS |
HOTEL |
SENIOR |
|
35% |
29% |
15% |
11% |
8% |
HOUSING & CARE |
|
2% |
||||||
|
|
|
|
|
 WHERE IS PRIVATE CAPITAL INVESTED?
Top 10 cross-border and domestic investment locations by volume (US$)*
US |
UK |
HONG KONG |
GERMANY |
FRANCE |
|
178bn |
13bn |
12bn |
11bn |
9bn |
|
|
|||||
DOMESTIC SHARE: 96% |
38% |
92% |
|
65% |
96% |
CANADA |
AUSTRALIA |
NETHERLANDS |
JAPAN |
SOUTH KOREA |
|
7bn |
6bn |
6bn |
4bn |
3bn |
|
88% |
51% |
81% |
|
97% |
100% |
WHAT’S NEXT? |
|
|
|
|
|
OF UHNWIS PLAN TO INVEST IN PROPERTY |
|
|
OF RESPONDENTS SAID THEIR |
||
IN THEIR HOME COUNTRY IN 2019 AND 27% |
|
|
CLIENTS INCREASED THEIR |
||
23% PLAN TO INVEST IN ANOTHER COUNTRY |
|
|
34% ALLOCATION TO PROPERTY IN 2018 |
||
Source: The Wealth Report Attitudes Survey 2019
Source: Unless stated, Knight Frank Research using data provided by RCA
36 | KNIGHTFRANK.COM |
37 | KNIGHTFRANK.COM |
vk.com/id446425943
CLIENT INSIGHT
Singapore king
Raj Kumar, arguably Singapore’s most successful retailer and property investor, chats candidly with The Wealth Report about real estate, family and building a legacy
Interview by Nick Holt, Head of Asia-Pacific Research, Knight Frank
Raj Kumar is the owner of Royal Holdings, which was formed when he and his brother Asok divided their Royal Brothers property
business in 2011. His son Kishin is also a successful property developer, with his own thriving enterprise, RB Capital.
ROYAL HOLDINGS:
PORTFOLIO HIGHLIGHTS
RB Capital Building, Singapore:
16-storey office building in Raffles Place, the heart of the CBD
Intercontinental Hotel Robertson
Quay, Singapore: 225-room
luxury riverfront hospitality asset
33 Jalan Sultan Ismail, Kuala
Lumpur, Malaysia: prestige office
building with HSBC as anchor tenant
Park Hotel Farrer Park, Singapore:
300-room hotel in Little India, managed by Park Hotel Group
Cuppage Terrace, Orchard Road, Singapore: Malacca-style terrace, housing popular cafés and bars
Quayside at Robertson Quay,
Singapore: a busy strip of lifestyle, food and beverage retail outlets
MOTIVATION AND DRIVE Our family has been here in Singapore for 72 years. In 1946 (the year before Partition) my dad came to Singapore from India. We travelled the world after we lost our state, with fire in our bellies and a strong need to survive.
I used to help my dad in his shop after school. I made my first million in the 1970s when I was 16 or 17 years old. I borrowed S$20,000 from my dad and gave it back within six weeks. I was in the retail business, selling jeans at my store. By the age of 21, I was opening one new store every month. Eventually I had 27 stores, and was a relatively significant jeans retailer in the country. I think people wanted to do business with me because they could see that I was honouring my word, paying everybody on time, and ultimately leading an exciting and fast-growing business.
BIGBREAKTHROUGHIn the 1980s when I was 25, the markets fell significantly and interest rates were volatile. Property was di cult to hold on to and we picked up the real estate of Emporium Holdings, a department store company, for 20 cents to the dollar, as well as more than 100 other stores including Queensway Shopping Centre. Knight Frank then brokered us the sale of the basement at Lucky Plaza, which had 60 stores. That was a huge turning point for our group. I will never forget Knight Frank. They have been a consistently loyal partner over the years.
SECRET TO SUCCESS We base our decisions on the traditional principle: location, location, location. We buy where no one else sees opportunity, and we never sell: we’re like a long-term pension fund. We bought Robertson Quay (now one of Singapore’s trendiest districts) when it was full of dilapidated warehouses and everyone thought it was old and irrelevant – but to us, it was a very exciting opportunity.
OVERSEAS OPPORTUNITIES The UK and Australia are the two markets we aim to focus on in the next few years: the UK because we believe there will be value due to the uncertainty over Brexit and the cheaper pound; and Australia as it is a market we are familiar with, having been invested there since the late 1980s.
SECOND HOME I love London, it’s been my soft spot for many years. I want to spend more time there. Brexit or no Brexit, it’s still going to be relevant.
SUCCESSION PLANNING My son Kishin, who’s now 34, has earned his own reputation within the real estate sector. He’s been accompanying me to important meetings since he was 12. He was always asking, “Why?”. He was so hungry to learn
– he still is! When he was about 21 I gifted him a penthouse, but he decided to sell it. For once it was me asking, “Why?”. He said he wanted to unlock the seed capital to start RB Capital group, which soon after acquired both 33 Jalan Sultan Ismail in Kuala Lumpur and the Singapore site where the EFG Bank Building stands today.
MENTORING AND LEGACY I’m not working for money now; I’m working for passion. I love backing emerging talent and am excited to be helping many new entrepreneurs to grow. This is my vision for the next five years. My plan is to spend a couple of days a week finding and spotting talent – people who understand business, but don’t have the financial support. There is so much talent out there, which is really positive. This is my life’s calling.
Global wealth trends
38 | KNIGHTFRANK.COM |
39 | KNIGHTFRANK.COM |

vk.com/id446425943
FAMILY OFFICES
TAKINGBACK
CONTROL
HOWTOCREATE
EFFECTIVEPROPERTY INVESTMENTSTRATEGIES
Words: Rory Penn and
Thomas van Straubenzee,
Knight Frank Private Office
More and more UHNWIs and their families are choosing to cut out the middleman when it comes to their investment portfolios by setting up a dedicated family office: and property is no exception.
Our roles in the Knight Frank Private Office bring us into daily contact with a growing number of private investors looking to take greater control of their property assets. Based on those conversations, here are some of the key factors those looking to create a property investment strategy should consider.
Be patient
Real estate markets are cyclical and linked to many factors, including the strength of the economy. Private investors and family offices can afford to wait for the right point in the cycle to invest, unlike institutional investors who can be under constant pressure to deploy capital. Private investors should wait for the right opportunities to maximise returns, avoiding unnecessary market and asset risk.
Don’t chase yield at any cost
With capital appreciation hard to underwrite in any investment sector at the moment,
Expert advice from left to right: Thomas van Straubenzee, Paddy Dring and Rory Penn of the Knight Frank Private Office
yield is often the main target. But this may be found in secondary markets that could be more vulnerable to any financial downturn, so don’t chase yield at any cost.
Private investors need to have a clear strategy – and to accept that it may not be possible to achieve the same level of diversification as is offered by managed funds. They must also recognise that there will probably need to be trade-offs between yield and growth.
Taking control doesn’t mean going it alone
We have seen an increase in the number of private investors and family offices looking to get involved in co -investments or joint ventures with other private investors or families. This can help spread risk, create diversification, open up new sectors and provide access to larger deals, while still retaining a level of control.
Your best advisers could be your children
Many emerging property sectors, such as last-mile logistics hubs, are being driven by new trends in technology, consumption and demographic changes. The younger
generation is often more in tune with the “next big thing”, so getting children involved as early as possible in the management of property portfolios is not just part of any sensible succession plan; it could well prove to be commercially astute. We have seen examples of where this has been done well, and not so well. Relinquishing some control and sharing responsibility generally creates the strongest family partnerships.
Finally, keep it simple
Increasingly, governments around the world are clamping down on investment structures that, while often perfectly legal, are deemed to be designed to avoid the payment of tax. Such structures are often complex and expensive to set up and may well affect portfolio liquidity. Tax planning is of course important, but when it comes to property it is very often the case that simple is best.
To find out more, email: privateoffice@knightfrank.com
Investment outlook
Global real estate opportunities this year and beyond
Changing tack |
The new world |
The key themes shaping |
Knight Frank’s prime residential |
investment opportunities |
forecasts for 2019 |
– page 42 |
– page 54 |
Portfolio management |
Next neighbourhoods |
Commercial property sectors |
The residential locations |
and locations to consider |
set to outperform |
– page 46 |
– page 58 |
40 | KNIGHTFRANK.COM

vk.com/id446425943
INVESTOR OPPORTUNITIES
Changing tack
The one thing investors can be sure of is that the next ten years won’t be anything like the past ten. As a decade of experimental monetary policy draws to a close, The Wealth Report identifies five key trends to help inform your future investment decisions*
Words: Tom Bill, Knight Frank Research
On the move above: The European Central Bank was at the forefront of the trend for looser monetary policy top right: India is set to become the world’s most populous country by 2022
01
Central banks and supercomputers |
spoon-feeding investors, they are no longer |
|||
should do less of the heavy lifting |
singing from the same hymn sheet,” he says. |
|||
|
|
“Asset allocation will need to become more |
||
The last decade has seen unprecedented |
tactical and currency analysis will become |
|||
levels of central bank intervention as |
more important as central banks diverge. |
|||
countries have attempted to fend off the |
The way for investors to play this is to be |
|||
effects of the global financial crisis. Despite |
active rather than passive.” |
|||
speculation that another global recession |
Passive investments such as exchange- |
|||
may be on the horizon, asset purchase pro- |
traded funds have surged in popularity |
|||
grammes in the US, UK, Europe and Japan |
over the last decade, largely because they |
|||
have largely served their purpose. |
are cheaper than active managers, some of |
|||
However, the withdrawal of quantitative |
whom have been underperforming in |
|||
easing (QE) will require investors to adopt |
choppy markets. |
|
||
new approaches, say fund managers. |
Artificial intelligence programmes for- |
|||
“What worked for investors in the era of QE |
mulate trading strategies based on historical |
|||
probably won’t work for them in the era of |
patterns, but some predict that their role will |
|||
quantitative tightening,” says Alex Gunz, |
diminish as QE unwinds. The big problem |
|||
managerofHeptagonCapital’sFutureTrends |
with passive investing, says James Beck, |
|||
Global Equity Fund. “QE |
|
|
a portfolio manager at |
|
keptmanycompaniesafloat |
OPPORTUNITY 01 |
James Hambro & Partners, |
||
that may otherwise have |
isthat“investorsownevery |
|||
A catastrophe bond is |
||||
gone bankrupt.” |
company in an index, |
|||
But while the Fed and |
one way to diversify |
good and bad”. |
||
in the face of stock |
||||
Bank of England were |
“Investors will increas- |
|||
market volatility. In |
||||
tighteningmonetarypolicy |
ingly need to do more than |
|||
return for sharing |
||||
at the end of 2018, China |
just ‘buy the index’,” says |
|||
the risk of loss from |
||||
|
|
|||
and the European Central |
events such as |
Maurice Gravier, chief |
||
|
|
|||
Bank were still continu- |
hurricanes, holders |
investmentofficerforwealth |
||
ing to do the opposite; a |
receive an annual |
management at Emirates |
||
divergence that Thanos |
insurance premium. |
NBD. “Your competitive |
||
Papasavvas, founder and |
“The key point is that |
advantage will come from |
||
chief investment officer at |
these risk events |
a combination of active |
||
ABP Invest, believes will |
are unlikely to occur |
management and adopt- |
||
benefit investors who are |
at the same time |
ing contrarian positions. |
||
well prepared. |
as stock market |
Volatility can become your |
||
“It’s not simply that |
crashes,” says |
friend – provided you do |
||
Andrew Milligan, |
||||
central banks are no longer |
your homework.” |
|||
head of global |
||||
|
|
|||
strategy at Aberdeen Standard.
02
The hunt for higher returns will produce more winners and losers
A hunt for yield that began in an era of low interest rates will continue as central banks hike rates cautiously and asset prices risemore slowly as QE is withdrawn.
Given how far the US is along the path towards rate normalisation, holding US debt and dollars will become more attractive, says James Beck. “Cash is becoming an asset class in its own right again and US treasuries have become a real return asset again for the first time in a decade.”
However, the pitfalls for yield-hungry investors could multiply, Mr Beck warns. “A lot of discipline has been lost since QE began as people desperately sought yield. The result could be a car crash somewhere, possiblylinkedtoemergingmarketorcorporate bonds. A lot of people were just happy to get a return without understanding what was under the bonnet.”
Investorsmustavoidputting all emerging markets intoonebasket,saysDavid Storm, head of multi-asset portfolio strategy at RBC Wealth Management, who believes good value can be found following stock market declines in emerging markets at the end of 2018. “The yield spread between emerging market debt issued in dollars and US corporate debt looks attractive,” he says.ThomasBecket,chief investment officer at Psigma, agrees. “Asian equities look attractive on a long-term view. Val-
uations have reset and complacency in those markets has reversed to quite a degree.”
Investment outlook
Infrastructure is another areaofinterest,saysMrStorm. “A 6% yield for a global infrastructure fund is compelling. Demand will be underpinnedbythetrendfor urbanisation as countries upgrade roads, power grids and switch to solar.”
“Thehuntforhigheryields will take investors outside the mainstream,” says Andrew Milligan, who sees diversification as crucial. He believes that tighter banking regulations post-crisis have created opportunities to replace banks. Examples of higher-yielding income streams include litigation
finance, commercial real estate debt, healthcare royalties and asset-backed securities.
PLAYING IT SAFE |
|
LESS RISK AVERSE |
|
||
Changing UHNWI attitudes to investment risk* |
|
NO CHANGE |
|
MORE RISK AVERSE
40% |
26% |
22% |
23% |
21% |
29% |
42% |
30% |
|
|
20% |
|
37% |
|
|
|
|
32% |
|
38% |
32% |
|
|
|
20% |
|
|
19% |
36% |
|||
|
|
|
|
||||
|
|
|
|
|
|
||
40% |
41% |
57% |
38% |
42% |
39% |
39% |
34% |
LATIN |
NORTH |
AFRICA |
EUROPE |
RUSSIA |
MIDDLE |
ASIA |
AUSTRALASIA |
AMERICA |
AMERICA |
|
|
& CIS |
EAST |
|
|
*Respondents were asked how their clients’ attitude to risk had changed over the past 12 months |
Source: The Wealth Report Attitudes Survey 2019 |
*Based on interviews conducted in November and December 2018
42 | KNIGHTFRANK.COM |
43 | KNIGHTFRANK.COM |

vk.com/id446425943 |
|
|
|
|
|
|
|
INVESTOR OPPORTUNITIES |
|
|
|
|
|||
|
|
OPPORTUNITY 03 |
|
|
04 |
||
|
|
There will |
|
relations. “Who will prevail? |
|
||
|
|
|
|
||||
|
|
be some |
|
Is it worth a longer-term switch |
|
||
|
|
beneficiaries if |
from the US to China? How |
|
|||
|
|
trade tensions |
|
||||
|
|
hawkish are the speeches from |
|
||||
|
|
between the US and |
|
||||
|
|
the US establishment, and how |
|
||||
|
|
China persist. The |
higharedefencespendinglevels? |
|
Ethical investing will give you |
||
|
|
countries where |
|
||||
|
|
|
|
|
|||
|
|
exporters to the |
These are questions investors |
|
more than a warm glow |
||
|
|
US stand to benefit |
need to ask before allocating |
|
|
||
|
|
include Mexico, |
their money.” |
|
The ethical arguments around carbon, |
||
|
|
Canada, Vietnam, |
For Maurice Gravier, the most |
|
tobacco, plastics and the sustainability |
||
|
|
Bangladesh and |
serious geopolitical risk is the |
|
of natural resources have grown louder |
||
03 |
|
Germany |
|
rise of populism. “The level of |
|
in recent years. While this has heaped |
|
|
|
|
|
public debt in Europe means |
|
regulatory pressures on some industries, |
|
|
|
|
|
governments don’t have the |
|
it has also driven the rise of so-called |
|
|
|
|
leeway to find a response to middle-class |
|
environmental, social and governance |
||
|
|
|
anger,” he says. |
|
(ESG) investing. |
||
|
|
|
Mr Papasavvas believes that if govern- |
|
“Nine out of ten of our younger investors |
||
|
|
|
ments do loosen the purse strings, it will |
|
want to know where they are invested, |
||
Geopolitics will become even |
|
create inflationary pressures, which make |
|
which didn’t happen with the previous |
|||
more important |
|
|
consumer-facing stocks and real estate good |
|
generation,” says James Beck. “The good |
||
|
|
|
|
bets for investors. But the bigger concern is |
|
news is that this desire has coincided |
|
Investors should be firmly focused on China, |
|
the departure of Angela Merkel because of |
|
with a period when ESG investing has |
|||
according to Savvas Savouri, chief economist |
|
her role in holding the EU together, he says. |
|
become more profitable. There has been |
|||
at Toscafund. “China only began to develop |
|
“Political uncertainty means government |
|
a convergence of conscience and wallet |
|||
properly in 2002, so it turns 17 this year,” he |
|
bond yields could rise. Where? In a less |
|
over the last decade.” |
|||
says. “What do teenagers need? Education. |
|
closely-knit Europe, investors will need to |
|
Social media has helped to drive |
|||
It’s almost as if they can’t build the student |
|
look at the component parts and perform a |
|
the trend, says Ben Goldsmith, CEO of |
|||
accommodation quickly enough in the UK |
|
credit analysis on each country.” |
|
|
|||
to cope with demand. |
|
|
Elsewhere in the world, Mr Savouri believes |
|
|
||
“Australia, Canada and New Zealand are |
|
Chinese self-interest will lead to a détente be- |
|
|
|||
three other economies set to benefit from |
|
tween North and South Korea, which he says |
|
OPPORTUNITY 04 |
|||
China’s economic growth and the associat- |
|
may give South Korean stocks a competitive |
|
||||
|
|
The percentage |
|||||
ed demand for commodities. They are first |
|
advantage over their Japanese counterparts. |
|
||||
world countries with no problems around |
|
|
|
|
of people with |
||
ownership of natural resources.” |
|
|
|
|
diabetes rose to |
||
Trade tensions have produced a battle of |
|
|
|
|
8.5% in 2014 from |
||
|
|
|
|
4.7% in 1980. As |
|||
wills between the US and China, one which |
|
|
|
|
|||
|
|
|
|
the global economic |
|||
Thanos Papasavvas believes China would |
|
|
|
|
|||
|
|
|
|
burden of the |
|||
win – although economic pragmatism |
|
|
|
|
|||
|
|
|
|
disease continues |
|||
|
|
|
|
|
|
|
|
should keep any escalation in check, he says. |
|
|
|
|
to escalate, demand |
||
|
|
|
|
|
|
|
|
“President Trump needs to ensure trade |
|
|
|
|
for medication will |
||
frictions are not too aggressive ahead of the |
|
|
|
|
grow. Regulation |
||
2020election.TheChineseadministrationcan |
|
|
|
|
may tighten as |
||
think longer term and there are many levers |
|
|
|
|
governments take |
||
they can pull to control their own economy.” |
|
|
|
|
preventive measures, |
||
Andrew Milligan agrees that investors |
|
|
|
|
such as promoting |
||
will need to keep a close eye on US-China |
|
Net gains Vietnam could benefit from US/China trade tensions |
|
exercise and |
|||
|
|
|
|
|
|
|
discouraging the |
|
|
|
|
|
|
|
consumption |
|
|
|
|
|
|
|
of sugary and |
|
|
|
|
|
|
|
fatty foods |
Investment outlook
FINANCIAL PLANNING
Is the world better prepared for the next financial crisis?*
MORE
PREPARED
69%
LESS
PREPARED
12%
SAME
19%
*Respondents were asked if they felt central banks and governments were better prepared for a financial crisis than ten years ago
Source: The Wealth Report Attitudes Survey 2019
Menhaden Capital, an investment company with an ESG focus. “The world has become a much more transparent place. It’s not just consumer-facing companies that are exposed to this risk but also their suppliers,” he says.
George Latham is chief executive of WHEB, an equity investor focused on “opportunities created by the transition to a low carbon and sustainable global economy”. “The point for investors is not to look at companies that are less bad than their competitors,” he says. “Focusing on the subset of companies actively contributing to solutions is how you protect yourself. Resource efficiency is one particularly attractive area. In the energy, material, industrial and IT sectors, there is a whole range of different ways to improve and cut waste.”
The potential danger for investors is that they find themselves jumping on a bandwagon, he says. “There is a risk around company valuations when you
are exposed to growth markets and it’s an area we need to be disciplined about.” However, Savvas Savouri believes moves towards ethical investing, such as scrutiny of payday lenders, could inadvertently push capital into legally grey areas such as predatory lending, as the returns on offer prove too tempting to resist. Others believe the rise of ESG investing could boost demand for what in future will become fringe activities, for example petrol-fuelled cars once the switchtoelectricbecomesmorewidespread. Demographic changes as well as regulation will also present opportunities for investors, says David Tosh, a director at RBC Wealth Management International. “The ageing global population is good news for companies invested in healthcare and medical devices such as hearing aids and orthopaedics. And those medical
devices are getting smarter.”
05
Opportunities and risks for tech investors will become starker
The tech-heavy NASDAQ composite index grew 76% in the four years to September 2018. In the final quarter of the year it fell by 17% as investors became jitter y that a decade-old bull market may have been coming to an end. The initial rise was exacerbated by “the herd mentality” of passive investing, says Alex Gunz.
“Beware of acronyms,” says Sav va s Savou r i, referring to the so-called
FAANG group of stocks that comprises Facebook, Amazon, Apple, Netf lix and Google. “These stocks are not homogeneous. The key question investors need to ask when looking at the tech sector is whether something is supplantable. Amazon has spent 25 years developing its footprint so it can’t be supplanted by a rival. Google has an algorithm. Whereas I can guarantee you that kids born today won’t be using certain social media sites when they grow up.”
Thomas Becket says that a reversion in stock valuations that became detached from reality may continue as investors refine their thinking. “The days of buying any tech company with AI or blockchain in its name are now largely behind us.”
“The theory is that people overestimate the impact of tech in the short term but underestimate it in the long term,” says Mr Gunz. “Investors need to think clearly about the long-term opportunities. Will the amount of data produced and consumed grow in the next ten years? Yes. Will there be more automation in factories? Yes. Will there be changes to the way DNA is analysed and illnesses diagnosed from new tech? Yes.”
Investors also need to be aware of the disintermediation threat posed by tech, says William van Straubenzee, deputy cha i r ma n at Ja me s Hambro & Partners.
“We are invested in DS Smith, the box-maker for Amazon, travel food experts SSP and property company Shaftesbury, a major beneficiary of Crossrail footfall. These arecompaniesthataren’t going to get a knock on the door from a tech giant. How is Amazon going to kill a bug better than Rentokil?”
44 | KNIGHTFRANK.COM |
45 | KNIGHTFRANK.COM |

vk.com/id446425943
COMMERCIAL PROPERTY INSIGHTS
Portfolio management
The Wealth Report looks at the continued allure of real estate investment and highlights some global opportunities for private individuals and family offices to consider
Words: William Matthews, Head of Commercial Research, Knight Frank
However one cuts the data, it is clear that commercial real estate continues to enjoy a very healthy level of investor demand. In 2018, global transactions amounted to more than US$900 billion, very much
in line with the level of activity seen over the past few years.
So what is behind the continued allure of this asset class, and why is it receiving greater attention from private capital in particular? As the panel to the right shows, there are two types of force – macro and micro – at work. These general drivers apply almost regardless of timing within the market cycle. However, there are a number of specific considerations relevant to any investor considering a move into commercial real estate in the immediate future.
WHAT’S DRIVING DEMAND FOR COMMERCIAL REAL ESTATE?
MACRO DRIVERS
Low interest rates. Yields on traditional incomeproviding assets such as bonds have fallen as central banks have maintained low interest rates, causing investors to look elsewhere.
The rise and rise of global savings. This capital must be invested in assets such as commercial real estate in order to provide long-term returns. Increasingly, too, it needs to find a home abroad as a means of providing a level of diversification.
The growth of real estate mega funds. Private equity funds have generated attractive returns from commercial real estate in recent years, establishing a strong track record that has made it easier to raise further capital.
Cuttingthroughtheredtape.Bar some notable
exceptions, the trend is towards reduced capital controls and regulatory hurdles, unlocking large pools of money for cross-border investment.
MICRO DRIVERS
A performance advantage. In many markets,
the total return performance of commercial real estate over the long run compares favourably with other key asset classes – and is less volatile.
The chance to enhance. Unlike equities and
gilts, real estate offers the opportunity to enhance income returns through asset management.
Deep liquidity – if required. The liquidity of
commercial real estate varies heavily between markets and countries, enabling investors to buy assets that suit their investment horizon.
Non-fungible. Ownership cannot be unilaterally diluted, unlike equities and gilts. Physical real estate is the polar opposite of the synthetic exchange-traded funds that are gaining an ever larger share of investment globally.
AT A GLANCE
Competition is intensifying, and investors should be prepared to move up the risk curve
For one, competition for certain types of commercial real estate will become more intense. This is especially true of markets for which there is a very well understood investment rationale. Does this mean such markets will be off limits for all but the most determined investors? Not necessarily, but with this in mind, we expect that investors of all descriptions will need to think creatively about the most appropriate way to access these markets and, where possible, to avoid overpaying for assets.
It may also be the case that some investors will need to move up the risk curve in search of returns. One way of tackling the issue of competition is to consider a broader range of assets, including those which are not classified as prime. Indeed, this could become a necessity for those with defined return targets, as strong pricing has gradually reduced returns for any given level of risk. However, this is not without its challenges. Maximising the potential of such real estate typically means taking a more hands-on approach. This may involve re-letting, redevelopment, or some other type of active management where a level of sector expertise is helpful.
The greatest challenge, as always, is to identify those markets that allow investors to sidestep the strongest competition, but which can still offer up compelling opportunities. We believe that the best chance of doing so involves taking a global perspective. To that end, we have selected a range of themes and markets that we believe are worthy of consideration by any private investor targeting commercial real estate.
Investment outlook
BRICKS & MORTAR
UHNWI property investment trends*
UHNWIS WITH PROPERTY INVESTMENTS
... in their country of residence
... outside their country of residence
UHNWIS WHO INVESTED IN PROPERTY
... in their country of residence in 2018
... outside their country of residence in 2018
UHNWIS PLANNING TO INVEST IN PROPERTY
... in their country of residence in 2019/20
... outside their country of residence in 2019/20
NORTH AMERICA |
EUROPE |
RUSSIA & CIS |
ASIA |
LATIN AMERICA |
AFRICA |
MIDDLE EAST |
AUSTRALASIA |
UHNWIS WITH PROPERTY INVESTMENTS
... in their country of residence
... outside their country of residence
UHNWIS WHO INVESTED IN PROPERTY
... in their country of residence in 2018
... outside their country of residence in 2018
UHNWIS PLANNING TO INVEST IN PROPERTY
... in their country of residence in 2019/20
... outside their country of residence in 2019/20
*Excludes first and second homes |
Source: The Wealth Report Attitudes Survey 2019 |
46 | KNIGHTFRANK.COM |
47 | KNIGHTFRANK.COM |

vk.com/id446425943
COMMERCIAL PROPERTY INSIGHTS
THE US: (STILL) THE LAND OF OPPORTUNITY
Finding a way into the world’s largest commercial real estate market
Given the strength and depth of the US commercial real estate market, private investors need to be creative in order to avoid competition with the highly capitalised real estate investment trust market. One approach is to seek out investments in suburban or secondary office locations within gateway markets. These can provide alternative options for investors searching for higher yielding investments that still benefit from strong underlying economic fundamentals.
However, if core office locations are a prerequisite, opportunities still lie in cities such as Denver, Phoenix and Austin, where occupier markets have been slower to hit the expansion phase. Outside the office sector, the industrial and multifamily sectors remain buoyant across the country. Competition in gateway cities for multifamily assets has pushed investors to less established markets, where there is still some strong growth potential.
Pricing in the industrial sector remains strong as investor demand persists. Nevertheless, opportunities exist for private investors within smaller industrial trial niche sectors such as data centres, which should continue to benefit from the strong underlying longterm fundamentals driving the subsector.
Competitive advantage
above left: opportunities await in US cities such as Denver; above right: high-end stores such as Galeries Lafayette are part of the ongoing transformation of Berlin’s historic Friedrichstrasse
GERMANY: BUY IT AND THEY WILL COME
Understanding the nuances is key to finding value in the retail sector
Given the strength of demand from both domestic and cross-border investors for German core real estate assets, private investors will need to look further up the risk curve in order to gain exposure to this market. The retail sector may not be the natural first choice, given the current challenges it faces in some countries, and it is true that investor demand has been subdued.
However, the headwinds caused by the growth of e-commerce do not apply to all retail sub-sectors in equal measure. For example, supermarkets have long provided consistent, inflation-linked income for investors with limited downside, thanks to the non-discretionary nature of food spending. In addition, Germany’s population growth is running at above long-term average rates, and this, combined with improved economic momentum, provides a good driver for growth in non-discretionary spending.
The blanket anti-retail approach adopted by some could represent a good opportununity for private investors to acquire long-leased, defensive assets with strong covenants, possibly at a significant discount compared with equivalent office or industrial assets.
Investment outlook
AUSTRALIA: GETTING DOWN TO BUSINESS
Two ways to gain exposure to a growth market
Among developed economies, Australia stands out for its remarkable track record of robust and sustained growth, having escaped the financial crisis largely unscathed and avoided recession for the past 27 years. This is clearly a supportive backdrop for investment and, indeed, recent years have seen a strong run of growth in the Australian commercial sector. Looking ahead, the outlook remains favourable, with healthy population and employment growth continuing to create investment opportunities in the country’s office markets.
The question, then, is how best to tap into this potential, particularly given that many markets have already enjoyed significant growth.
We believe that there is still substantial opportunity, although at this stage in the cycle a more selective approach is needed. In Sydney, for example, the market is experiencing very low vacancy rates and strong rental growth which is creating opportunity in emerging urban fringes such as Pyrmont, Surry Hills and Alexandria as tenants increasingly seek an alternative to escalating rents in the CBD. Many of these markets already offer cutting-edge amenities and, in time, will benefit from public infrastructure improvements.
At the other end of the spectrum, both geographically and in terms of recent performance, is Perth, where the market has been subdued for several years due to a prolonged downturn in mining investment. However, recent months have seen sentiment improve, with an upturn in tenant demand and prime vacancy now dropping fast. At close to 7%, prime yields are attractive and for investors seeking value with strong upside potential, Perth is now firmly in play.
Added value above left: Perth’s commercial sector offers strong upside potential; above right:
Rotterdam combines high yields and potential for income growth
MAINLAND EUROPE: GOING DUTCH
Seeking opportunities for growth beyond the Netherlands’ capital
EconomicmomentuminmainlandEuropeisthestrongest it has been for a number of years and investor interest has increased as a result. Germany is the standout performer, with strong economic fundamentals fuelling buoyant occupier markets across the country. However, given strong pricing levels, investors are having to reach to secure assets, and some will need to look further afield for stock.
The Netherlands is a market currently in the crosshairs of many institutional investors due to its strong occupier market. Competition for core Amsterdam assets is increasing and investors have to price in strong future rental growth levels in order to secure assets.
Opportunities do, however, lie in neighbouring Dutch cities such as The Hague and Rotterdam, which are also feeling the knock-on effects of favourable economic conditions but which have not as yet seen pricing reach the levels of Amsterdam. This gives private investors an opportunity to secure higher yielding assets that still have the potential to see income growth in a reflationary environment.
48 | KNIGHTFRANK.COM |
49 | KNIGHTFRANK.COM |

vk.com/id446425943
COMMERCIAL PROPERTY INSIGHTS
THE UK: PLAYING THE LONG GAME
Locking in stability with long-leased assets
As investment horizons lengthen and investors seek ways to diversify their long-term income streams, some (both private and institutional) have taken defensive positions by investing in blue-chip tenanted long-leased real estate assets.
The benefits of long-leased assets are that they traditionally have index-linked, upwards-only rental reviews, often for 20 years or longer. This provides investors with sustainable and predictable income growth during a period where significant further yield compression is looking less likely.
Accessing the market is not always straightforward, however. Private investors have sometimes found it difficult to acquire such assets given the weight of capital (largely institutional) targeting the same product. In addition, strong pricing on long-leased core office, retail and logistics buildings has made it harder for private investors to achieve the desired returns.
Nevertheless, opportunities do exist in non-core office and industrial markets, including those assets with lease covenants that are robust, albeit perhaps not quite strong enough for the stringent institutional investor. Equally, less traditional real estate asset classes such as service stations, healthcare facilities or hotels can provide an attractive income return for private investors and a strong lease covenant that might not otherwise be attainable with an office, retail or logistics asset.
Happy returns below: London’s Adelphi Building, one of the capital’s flagship office spaces; above: the rise in e-commerce is boosting the logistics market
EUROPEANLOGISTICS:DELIVERINGTHEGOODS
Tapping into demand for last-mile logistics
Due to a combination of investment market momentum and strong underlying fundamentals, the European logistics market has gone from strength to strength since 2010. Mainland transaction volumes in the sector have increased by a compound annual growth rate of almost 15% since 2010, and the industrial sector now accounts for over 15% of commercial real estate transactions. Gaining exposure to the growth in e-commerce and the resultant demand for different types of logistics facilities is very much on investors’ radars.
Given the high levels of institutional interest in the sector across mainland Europe, private investors have found it difficult to attain prime assets at prices that allow them to achieve the required rate of return. One alternative investment strategy is to target higheryielding secondary assets in good locations (preferably urban edge) and with strong residual land values, with the long-term plan to convert them into prime “last-mile” logistics facilities.
This presents two investment opportunities: either undertake an intensive asset management strategy to maintain occupancy and generate rental growth; or manage existing tenancies in the short to medium term with a view to developing the site into a more modern facility.
Doubling up above:
new co-working, co-event and co-living spaces are mixing business with pleasure in Hong Kong
Investment outlook
HONG KONG: FROM CO-WORKING TO CO-LIVING
Evolving opportunities in the territory’s real estate landscape
Co-working has taken root in Hong Kong and is already having a noticeable impact on the territory’s office sector. Private investors need to understand this new environment, says Paul Hart, Head of Commercial Property at Knight Frank Greater China.
For example, international operators such as WeWork and Regus along with new players including the Beijing-based Ucommune have all expanded. The latter took 15,000 sq ft of space near Central and 20,000 sq ft in Kowloon during 2018.
In response, a number of property developers and office landlords have converted traditional offices and, in some cases, retail areas, into co-working and co-event spaces. The Mustard Seed, owned by the Emperor Group, is a case in point. This trend coincides with the findings in Knight Frank’s
(Y)our Space report, which finds that even traditional firms are embracing co-working concepts in their real estate planning.
We have also seen Hong Kong-based hotel operator Eaton (part of the Langham Hotels group) create a co-working hybrid, combining a private members’ lounge with workspace. Meanwhile, Kafnu, an operator newly arrived from India with an extensive South-East Asian footprint, has an enhanced offer that also seeks to incorporate a short-term stay element.
Co-living, meanwhile, is still at a nascent stage. Gaw Capital was one of the first Hong Kong players to experiment with co-living projects including Campus Hong Kong in Tsuen Wan. Pamfleet recently launched the Nate studio apartments with value-added services in Tsim Sha Tsui. Local operator Campfire is also establishing itself in the co-working and entertainment space with the opening of an 80-bed Campfire Home at Garden Hill in Sham Shui Po.
50 | KNIGHTFRANK.COM |
51 | KNIGHTFRANK.COM |

vk.com/id446425943
COMMERCIAL PROPERTY INSIGHTS
GLOBAL PERSPECTIVE: MULTIPLE CHOICE
Harnessing worldwide demand for residential rental
The global multihousing – or private rental – sector has continued to grow over the past few years, with both private and institutional investors increasingly attracted to its stable income profile and strong demographic drivers.
While multihousing real estate represented just over 10% of global commercial real estate transactions in the year to Q3 2018, in the US that share was over 30%, according to Real Capital Analytics. This demonstrates a clear roadmap for the evolution of the sector in other markets.
So what is behind the growing tenant demand for rental housing globally? Clearly, there important nuances from country to country,
but two common themes emerge: home ownership is less affordable for younger generations; but these generations also place a greater value on the flexibility that renting, as opposed to buying, can offer.
From an investor’s perspective, exposure tothesectoroffersanumberofopportunities: to diversify their existing income-producing
real estate portfolio; to make a cycle-appropriate entry into income-producing real estate; and leverage any existing residential development skills.
Mighty Madrid Spain’s rapidly maturing multihousing market is increasingly attracting the attention of institutional investors
For those investors seeking to gain access to established multihousing markets, the US is home to the most mature and liquid institutional investment market, and has attracted more than twothirds of global multihousing investment since 2010. Elsewhere, the European multihousing market is becoming increasingly diversified and mature, and now accounts for 18% of all real estate t r a n s a c t i o n vo lu m e s a c r o s s t h e continent. While Germany remains the
most established European market, the UK, Dutch, Swedish and Spanish markets are becoming increasingly institutionalised as global investors seek to take advantage of their
Investment outlook
|
that are not otherwise available within their respective markets. |
||
|
Given that a number of institutional investors remain under- |
||
|
weight in terms of their exposure to both real estate and |
||
|
|
the multihousing sector, investor demand is |
|
|
|
expected to persist in the long term. The |
|
|
|
global demographic trends driving |
|
AT |
A GLANCE |
the evolution of the sector should |
|
ensure that there is sufficient |
|||
|
|
||
Multihousing offers |
development of investment-grade |
||
stock to meet growing demand from |
|||
both insulation from |
institutional investors wanting |
||
market volatility and |
exposure to the sector. |
||
|
|
||
growth potential |
A portfolio of benefits |
||
|
|
||
|
|
So how can private investors ben- |
|
|
|
efit from exposure to this market? The |
|
|
|
single strongest argument in favour of adding |
|
|
multihousing to a real estate portfolio is the |
||
|
defensive and countercyclical characteristics of its income stream. |
||
|
These characteristics are underpinned by the intrinsic secular and |
||
|
structural changes currently under way across global residential |
||
|
markets: home ownership is falling as affordability constraints rise |
||
|
in many markets. These trends are only expected to continue, as a |
||
|
young generation continues to seek dynamic living arrangements |
||
|
and affordability issues remain for first-time buyers. |
||
|
The countercyclical nature of the multihousing income stream |
||
|
is a consequence of debt market frailties during economic |
||
|
downturns making it difficult for prospective buyers to purchase |
||
|
a home, which ultimately limits new supply in the market. This |
||
|
creates an imbalance between supply and demand drivers |
||
|
within the rental market and helps spur rental growth in the |
||
|
multihousing sector. This runs counter to the trend in core real |
||
|
estate sectors, where income streams typically have a strong |
||
growth potential. Indeed, almost 50% of European apartment |
correlation with economic growth, and subsequently tend to |
||
investment was from cross-border sources in 2018. |
suffer during a downturn. |
||
Beyond the comparatively established markets of North |
An additional feature of multihousing income streams is that |
||
America and Europe, Asia-Pacific is the only region with a |
they are also partly non-cyclical, providing insulation from |
||
developed multihousing sector, with over US$54.4 billion in |
market volatility while still offering plenty of scope for growth. |
||
transaction volumes since 2012. However, the bulk of activity in |
The closest comparison would be retail assets anchored by |
||
this market is concentrated within Japan. Although expanding, |
tenants that cater to needs linked to non-discretionary spending, |
||
the sector is in its relative infancy in Australia, where institu- |
such as supermarkets. |
||
tional and private investors are currently seeding the first multi- |
These low correlation characteristics make multihousing |
||
housing projects across the major eastern seaboard cities. |
an attractive investment prospect within a diversified real |
||
Foreign capital (both private and institutional) has been a key |
estate portfolio due to its ability to mitigate the downside risk |
||
driver of investment demand across established gateway multi- |
associated with the cyclical nature of real estate markets. This |
||
housing markets. And, as investors seek to gain the portfolio |
provides private investors with an ideal investment platform to |
||
benefits of these assets, a multitude of global investors will continue |
support wealth preservation and maintain cash flow during all |
||
to target both forward funded or stabilised multihousing assets |
stages of the economic cycle. |
||
52 | KNIGHTFRANK.COM |
53 | KNIGHTFRANK.COM |

vk.com/id446425943
RESIDENTIAL FORECAST
The new world
The Wealth Report forecasts how key prime residential markets are set to perform in 2019, and looks back
at how its predictions for 2018 panned out
Words: Liam Bailey, Global Head of Research, Knight Frank
Scaling new heights Cape Town is forecast to be one of our top performers in 2019
See page 30 for the full PIRI 100 results
The next 12 months will see a shift in the performance of global property markets, as purchasers and investors
respond to greater uncertainty in the global economy, a proliferation of market regulation and the rising cost of debt.
Trade tensions, political events and an increasing debt burden, alongside rising interest rates, will conspire to ensure that there is a slowdown in economic growth across the world in 2019.
This change in the economic landscape will be reflected in lower price growth in global residential markets. This more muted growth will in turn result in changing real estate investment strategies, as investors focus on income, asset management and development opportunities in order to secure outperformance as debt costs rise.
Investment outlook
Fluctuating fortunes
Ofthecitiesthatweforecast,weexpectthat five (Buenos Aires, Dubai, Hong Kong, Mumbai andShanghai)willseepricesfallthisyear,two (New York and Singapore) will see prices remain static and that the remainder will see prices rise – albeit modestly.
Key European cities, along with Cape Town lead with the highest growth. These are increasingly popular investment hubs for European and global investors, with a growing presence from Chinese buyers.
Healthy tenant demand, relative good value and an attractive lifestyle will ensure that price growth in markets such as Paris, Berlin and Madrid comfortably exceeds 5% in 2019. Growth at this level is still positive, and well above wage inflation, a traditional benchmark for long-term price appreciation, but is marginally down on the level seen in 2018.
FUTURE VIEW
Knight Frank's prime residential forecast 2019
#1 |
#2 |
#3 |
#4 |
#5 |
#6 |
#7 |
#8 |
#9 |
#10 |
MADRID |
BERLIN |
PARIS |
CAPE TOWN |
MIAMI |
MONACO |
VANCOUVER |
SYDNEY |
LOS ANGELES |
GENEVA |
6% |
6% |
6% |
6% |
5% |
4% |
3% |
2% |
2% |
1% |
#11 |
#12 |
#13 |
#14 |
#15 |
#16 |
#17 |
#18 |
#19 |
#20 |
MELBOURNE |
LONDON |
AUCKLAND |
SINGAPORE |
NEW YORK |
DUBAI |
SHANGHAI |
MUMBAI |
BUENOS AIRES |
HONG KONG |
1% |
1% |
1% |
0% |
0% |
-2% |
-3% |
-5% |
-5% |
-10% |
Source: Knight Frank Research
54 | KNIGHTFRANK.COM |
55 | KNIGHTFRANK.COM |

vk.com/id446425943
RESIDENTIAL FORECAST
Despite the end to quantitative easing in the euro zone, a weaker economic outlook and a fragile political landscape, relative value in Europe will support growth.
Tax and regulation will continue to drive market performance in 2019. Those markets that have led innovation in these areas, especially Hong Kong and Singapore, will see lower growth as buyers adjust to new taxes and restrictions.
Prices are falling in Hong Kong and will continue to do so in 2019. Concerns about higher borrowing costs and a new vacancy tax, which prompted a rush by developers to sell empty properties, have contributed to the slide. Activism from regulators will likely see price falls of up to 10% this year. Interest rate rises in the US will also add pressure on this dollar-pegged market.
W hile purcha se rest rict ions a nd additional costs placed on foreign buyers have weakened the mainstream housing market in Sydney, the prime market has held up due to a lack of new supply supporting the city’s prime market.
Cooling measures implemented unexpectedly in July, including higher stamp duties and tougher loan-to-value rules, worked to stop the incipient house price recovery in Singapore. While we expect the market to see some improvements in 2019, prices are unlikely to rise this year.
Vancouver, which has seen significant new taxes and regulations implemented in recent years, compounded most recently by hikes to foreign buyer tax and stamp duty in the early part of last year, was unsurprisingly our weakest prime market in 2018. We expect to see prime prices stabilise in 2019 as recent price falls mean local buyers will identify buying opportunities.
After four years of falling prices, an adjustment that reflected higher stamp duty, prices in London are now between 10% and 20% below their 2014 peak. With higher taxes priced in, we believe activity will strengthen once political uncertainty in relation to Brexit starts to recede and pent-up demand is released.
French fancy Major European cities such as Paris will remain key hubs for global investors
HOUSE HUNTERS
% of UHNWIs planning to buy a new home in 2019
|
IN COUNTRY |
OUTSIDE COUNTRY |
|
OF RESIDENCE |
OF RESIDENCE |
AFRICA |
17% |
11% |
|
||
ASIA |
26% |
25% |
|
||
AUSTRALASIA |
15% |
4% |
|
||
EUROPE |
15% |
21% |
|
||
LATIN AMERICA |
23% |
56% |
|
||
MIDDLE EAST |
13% |
27% |
|
||
NORTH AMERICA |
14% |
11% |
|
||
RUSSIA & CIS |
16% |
23% |
|
||
GLOBAL AVERAGE |
18% |
22% |
|
Our 1% forecast for growth in 2019 could well prove to be pessimistic.
In New York, economic growth and wealth creation are starting to cancel out the high completion rates
ob ser ved in t he prime market over the last few years. While we don’t expect any growth in 2019, sales volumes should increase.
AT A GLANCE
Madrid, Berlin, Paris and Cape Town top our 2019 forecasts at 6%
Source: Knight Frank Research
Investment outlook
HOW DID WE DO LAST YEAR?
In the spirit of full disclosure and transparency, we set out in the table below our forecasts for prime residential price growth in 2018 against the actual result for the year. Our forecasts were published at the beginning of 2018 and have not been subject to any revisions part way through the year.
Clearly, we could not have been expected to hit our forecast 7.6% rise absolutely spot on – rather, it is the direction of travel
we are attempting to predict. On this basis, eight out of our 14 forecasts for 2018 were correct. However, I would argue that two more were nearly correct, meaning that our predictions were reasonably accurate either 57% or 70% of the time, depending on the generosity of the interpretation. For those forecasts where we were slightly wide of the mark, our defence is outlined below.
FORECAST AND ACTUAL PRIME RESIDENTIAL PRICE GROWTH IN 2018
We were close with…
Berlin |
|
Singapore |
|
Madrid |
|
Paris |
|
We said |
Actual change* |
|
|
|
|
|
|
7.0% |
10.5% |
5.0% |
9.1% |
5.0% |
8.1% |
9.0% |
5.3% |
LA |
|
Miami |
|
Sydney |
|
Mumbai |
|
3.0% |
5.0% |
0.0% |
3.3% |
7.0% |
3.1% |
2.0% |
0.3% |
|
|
|
|
|
|
|
|
There were extenuating circumstances with…
Vancouver |
|
We said |
Actual change* |
-2.5% |
-11.5% |
London |
|
0.5% |
-4.4% |
Dubai |
|
1.0% |
-3.4% |
New York |
|
0.0% |
-2.5% |
Geneva |
|
3.0% |
-2.0% |
Hong Kong |
|
7.0% |
1.8% |
Mea culpa
We got the direction correct, if not the severity of the decline. Government moves on taxation and restrictions are almost impossible to anticipate
Tortuous Brexit negotiations sapped the enthusiasm of even the most willing buyers, although 2018's loss could well be 2019's gain
A stuttering oil market, four US rate rises which bolstered the dollar (and in turn the dirham due to its currency peg) plus high supply volumes knocked our forecast off course
The number of rate rises negatively surprised, curtailing domestic demand and stemming the tide of foreign buyers who were deterred by the strong dollar, pushing inventory levels upwards
The prime market took time to adapt to the strong currency. The anticipated corporation tax was delayed and mortgage rules were tightened
New regulations and higher interest rates pushed the market lower and the Hang Seng Index recorded its steepest decline in seven years
*Source: The PIRI 100 (page 30)
56 | KNIGHTFRANK.COM |
57 | KNIGHTFRANK.COM |
vk.com/id446425943
RESIDENTIAL PROPERTY HOTSPOTS
Next neighbourhoods
When it comes to identifying tomorrow’s prime residential hotspots, nobody is better placed than Knight Frank’s global team of local insiders. They share the lowdown
on the neighbourhoods set to outperform the rest
Compiled by Kate Everett-Allen,
Head of International Residential Research, Knight Frank
Once again we have challenged our global residential property experts to demonstrate the depth of their local knowledge by hand-picking those districts and neighbourhoods that they believe are the “ones to watch”. The 18 neighbourhoods that follow include thought-provoking options
in traditional wealth hubs, such as London and Hong Kong, where Knight Frank has operated for many years, as well as contenders in more recent additions to our global network, such as New Zealand and the Philippines.
The line-up ranges from emerging tech hubs to new cultural quarters, taking in transformational factors from development projects to new transport links. Take Boston’s Seaport District: a stone’s throw from the city’s Financial District, it has a blossoming residential community with the Institute of Contemporary Art at its heart. By contrast, it is scholastic credentials that bring Perth’s Applecross to the fore, with good connectivity to three world-class universities and top private schools. Each selection tells a unique story, showing that there really is no substitute for a bit of insider intelligence.
Wynyard Quarter, Auckland
Ian Little, Bayleys Realty Group
Home to the 2021 America’s Cup, Wynyard Quarter is changing – fast. Over the past decade, this waterfront precinct, once the heart of Auckland’smarineandpetrochemicalindustries, has emerged as a major hub for national and international corporates, including Fonterra, Datacom, Microsoft and ASB Bank, as well as for the city’s innovation and co-working scenes.
As the local business community has grown, so too have the entertainment and hospitality options on offer. In 2016, the NZ$36 million ASB theatre – the new home of the Auckland Theatre company – opened immediately adjacent to the waterfront restaurant, bar and café strip.
Withallthisactivitycomesagrowingresidential population and, inevitably, a sweep of new residential development projects. Apartments at 132 Halsey are attracting some of the city’s highest values. Other new developments offerawiderrangeofpurchaseprices:forexample, the 91-unit 30 Madden St project includes maisonettes and penthouses from NZ$600,000 toNZ$6million.Planshavealsobeenannounced for a 435-apartment and retail complex.
Alabang, Metro Manila
Jan Custodio, Knight Frank Philippines
Alabang is poised to be the next hotspot in Metro Manila, with a series of major infrastructure and development projects set to enhance the area’s accessibility and appeal.
The biggest road project, Skyway Stage 3, is due for completion in mid-2020, and will provide a seamless connection between the north and south of the metropolis through an elevated link road that connects the North and South Luzon Expressway systems.
Among the ambitious developments is Alabang Town Center, an open-air shopping centre that combines nature with retail, and Filinvest City, a multi-use residential, business and wellness hub that prioritises green landscapes in an urban environment.
Meanwhile, a new project by Megaworld, Alabang West, aspires to bring California’s Beverly Hills to Manila. The 10 billion peso project will have a 1.3 km commercial and retail row, inspired by Hollywood’s Rodeo Drive, while the exclusive Alabang West Village will provide 788 residential lots ranging from 250 sq m to 800 sq m.
Rising tide left: Auckland’s shimmering Wynyard Quarter below: Hong Kong’s increasingly connected Hung Hom
Yangpu Riverside, Shanghai
Regina Yang, Knight Frank Greater China
Known as the cradle of modern industry in Shanghai, Yangpu Riverside is the site of China’s first power plant, gasworks, water plant and textile mill. Nearly 70 industrial heritage sites in the area, all ripe for conservationandrenovation,contributetothearea’s unique character and atmosphere.
Redevelopment has been under way for some 15 years, and Yangpu Riverside is now positioned as a mixed-use cluster with businesspremisesofferinginnovativerecreational facilities alongside metropolitan residences.
Due to its longstanding status as an industrial zone, residential prices in the area used to be among the lowest in the city. However, recent projects by such renowned developers astheYangoGroup,PolyGroupandGreenland Group, targeted particularly at middle-class familiesandyoungprofessionalcouples,have set new records for prices in the area. Threebedroom apartments (120 sq m to 150 sq m) range from 10 million to 14 million yuan, and four-bedroom apartments (150 sq m to 250 sqm)rangefrom15millionto26millionyuan.
Investment outlook
Hung Hom, Hong Kong
David Ji, Knight Frank Greater China
Once the site of the old Hong Kong Whampoa Dockyard, the neighbourhood of Hung Hom has traditionally been home to a mix of blueand white-collar workers and still boasts a distinct identity and strong sense of community. Local landmarks include the Hong Kong Coliseum, the region’s second largest indoor arena and the Senso Italiano gallery. Hung Hom is also the place to go for some of the city’s best and most authentic southern Chinese food.
Now,withtheadventofanewmetrostation, the area – hitherto connected to Hong Kong Island only by ferry or road – will be able to add excellent transport links to its list of attractions. The station is part of the ongoing HK$90 billion Shatin to Central Link project, which is scheduled to open in 2021, and its impact is already being felt in the property market. Prices in the area are rising steadily, with most twoand three-bedroom flats now priced between HK$180,000 to HK$200,000 per sq m.
58 | KNIGHTFRANK.COM |
59 | KNIGHTFRANK.COM |

vk.com/id446425943
RESIDENTIAL PROPERTY HOTSPOTS
Image: courtesy @wheresshelly
Applecross, Perth
Michelle Ciesielski, Knight Frank Australia
Picturesque jacaranda trees line the streets of the affluent suburb of Applecross on the southern banks of the Swan River, less than nine kilometres, or one train stop, from Perth’s CBD. With good connectivity to three of Western Australia’s world-class universities, the state’s top private schools and the soon-to-be-expanded Garden City shopping centre, Applecross attracts both local and international families, drawn to its combination of proximity to Perth’s urban action and quiet suburban allure.
Located within the Canning Bridge Precinct, Applecross’s town square is transforming to provide a unique, vibrant and creative community hub with a mix of residential, commercial, recreational and cultural uses. This ongoing regeneration will introduce more high-density living, with well-appointed apartments starting from A$600,000. Houses in Applecross start from A$1.5 million, putting it among the ten highest-priced suburbs in Perth.
St Kilda Road Precinct, Melbourne
Sarah Harding, Knight Frank Australia
Leaving Melbourne’s business district and strolling down St Kilda Road towards the beach, you could be forgiven for thinking you were on a wide tree-lined boulevard in a European city. At the northern end, multiple tram stops provide access to such attractions as the Royal Botanic Gardens, the National GalleryofVictoriaandtheArtsCentre,whileto thesouth,FawknerPark,TheAlfredHospital, Albert Park Lake and some of Melbourne’s top private schools are in walking distance.
The precinct has a well-established office market, popular with advertising agencies and tech companies who prefer to be outside the traditional CBD. A thriving co-working scene is fuelled by popular cafés and restaurants, such as seafood stalwart Bacash and hip newcomer Matilda 159. Several secondary office buildings are earmarked for high-end residential conversion, encapsulating the area’s live/work ethos. Expect to pay in the region of A$1.8 million for a prestigious St Kilda Road apartment.
Delray Beach, Florida
Nick Malinosky, Douglas Elliman
Tucked neatly between Palm Beach and Fort Lauderdale, Delray Beach offers relative value and a more relaxed feel than its coastal neighbours. Atlantic Avenue and A1A Ocean Drive are the town’s prime destinations, with beachfront plots significantly deeper than elsewhere along the coast. Key buyer groups include New Yorkers, Canadians and Europeans who find the low tax rates, climate and accessibilityappealing. BothPalm Beach and Fort Lauderdale airports are located less than a 25-minute drive away.
The new US$1 billion Brightline train has significantlycutjourneytimesalongthecoast, whilethetown’sPineappleGroveArtsDistrict, MorikamiMuseumandCornellArtsMuseum attractacreativecrowdwhichiscateredforby anincreasinglyhiprestaurantscene.Housing in Delray Beach consists of luxury detached family homes circa 3,500 sq ft in size with a privategardenandpool,whichstartatUS$3.5 million, and townhouses of approximately 3,000 sq ft, starting at around US$2 million.
Fresh growth clockwise from top left: Blooming Applecross, quiet, yet close to Perth’s urban action; Barbados’s “Platinum Coast”, back on track; and St Kilda Road, a Melbourne gem
Pasadena, Los Angeles
Tim Durkovic, Douglas Elliman
Home to the Rose Bowl stadium, NASA’s Jet Propulsion Laboratory and the California Institute of Technology, Pasadena offers an attractive combination of relative value compared with neighbouring communities in Beverly Hills and West Hollywood, and the desirable lifestyle and privacy that residents of Los Angeles seek. The neighbourhood has a population of around 145,000 and is easily accessible, with a light rail line that puts it within 15-20 minutes of Downtown Los Angeles.
The picturesque Spanish Colonial Revivalstyle buildings found in Old Pasadena appeal to upmarket shoppers and the area is widely recognised as one of the area’s most popular retail and entertainment destinations.
With the San Gabriel Mountains as a backdrop, Pasadena offers a plethora of home types, from craftsman-style properties to mid-century post-and-beam dwellings, as well as the famed “La Miniatura” by Frank Lloyd Wright. The average property value isapproximatelyUS$825,000,butitremainsa highlyaccessiblemarketwithlistingsstarting at US$450,000 and rising to US$28 million.
Investment outlook
The West Coast, Barbados
Edward de Mallet Morgan,
Knight Frank International
Following fiveyearsofweakmarketsentiment, duringwhichpricesforsomeprimeproperties fell to levels not seen since 2008, the west coast of Barbados is arguably at its most affordableforadecade.Asaresult,itisstarting to see a resurgence in activity. Extending across the parishes of St Peter and St James, with the famous Sandy Lane Hotel at its heart, the “Platinum Coast” has been the first on the island to see sales volumes start to increase.Anewgovernmentandaradicaldebt restructuringplanisbeingreceivedpositively by investors and second home buyers alike.
Buyers can choose from Caribbean villas andcolonial-stylepropertieswithverandahs, many with stunning beach views. Aside from five PGA-standard golf courses, the area is home to luxurious eateries – Lonestar and Cin Cin are bywords for the freshest seafood,whilenewcomerNikkiBeachbringsa dose of Ibiza-style glamour to the island. The average price of a condominium has slipped byaround20%overthepast fiveyears,putting the area firmly on the radar of those seeking a buying opportunity.
60 | KNIGHTFRANK.COM |
61 | KNIGHTFRANK.COM |

vk.com/id446425943
RESIDENTIAL PROPERTY HOTSPOTS
Friedrichshain, Berlin
Claire Locke, Knight Frank International
Friedrichshain may now offer a plethora of entertainment,shoppingandlifestyleoptions, but it has not always been this way. The area was once part of communist East Berlin and remains packed with relics from the German DemocraticRepublicera,suchastheSoviet-era buildings that line the monumental socialist boulevard of Karl-Marx-Allee and the longest surviving stretch of the Berlin Wall.
Now famed for its art scene, Friedrichshain is home to the East Side Gallery, the longest open-air gallery in the world, as well as Urban Spree, an independent contemporary art space that features urban artists and champions a grassroots approach. This willingness to embrace the city’s history, while adding a unique futuristic edge, has attracted many large corporations including Coca-Cola, BASF, Universal Music and Mercedes.
With these businesses come jobs – some 30,000atthelastcount–andwithjobscomes growing demand for property. The 2018 report from Knight Frank’s German partner, international property consultants Ziegert, lists Freidrichshain-Kreuzberg as one of its top three districts in Berlin. A typical twobedroom apartment starts at €430,000.
Trois Chénes, Geneva
Alex Koch de Gooreynd,
Knight Frank International
Trois Chénes, to the east of Geneva city centre, is emerging as a new transport hub. A new fast rail link between Geneva and the French Alps will enable commuters to travel by train between Switzerland and France rather than driving, while a new three-kilometre pedestrian corridor and cycle path will make it easier to commute into the city centre.
With echoes of New York’s High Line, the area above ground will be an elevated greenway, while below ground the Leman Express will connect the city with Evian, Thonon, Annemasse and Annecy. Due to open in December 2019, the new link will also put Chéne-Bourg station within 25 minutes of Geneva International Airport. Moreover, at Eaux Vives, the next stop on the line, a spectacular new station complex will house Geneva’s new opera house, as well as offices, shops and apartments.
A contemporary two-bedroom freehold apartment in Trois Chénes starts at SFr800,000, while a four-bedroom detached home starts at SFr1.5 million.
The Seaport District, Boston
George Jedlin, Douglas Elliman
Successive waves of development, beginning in the late 1990s, have transformed this historical part of South Boston. The warehouses and railway yards of the city’s former shipping port have been repurposed and replaced by industrial-chic conversions and state-of-the-art glass skyscrapers.
The Seaport District’s 11,000 residents now share the waterfront with a marina and such attractions as the Institute of Contemporary Art and Icon, a state-of-the-art cinema featuring far-reaching views of the city’s skyline. They are also spoiled for choice when it comes to restaurants, from local oysters and craft ale at Row 34 to tacos and tequila at Lolita Cocina.
Aten-minutewalkfromthecity’sFinancial District, Seaport is popular with young professionals, yet also appeals to older residents seeking a city base for part of the year. Buyers originate from elsewhere in Massachusetts, the East Coast of the US, and even Europe. A typical two-bedroom contemporary apartment starts at US$1,800 per sq ft, with the most desirable projects with the best views commanding close to US$3,000 per sq ft.
Investment outlook
11th arrondissement, Paris
Roddy Aris, Knight Frank International
Located on the edge of the historic Marais district, the 11th arrondissement is a young, vibrantneighbourhood.Foodiesandfashionistas flock to the chic eateries and boutiques in and around the Place de la République and Place de la Nation – try Septime for a fresh twist on the bistrot tradition, or Le Clown Bar, in the old Cirque d’Hiver, for a taste of the city’s lively natural wine scene.
Home to around 150,000 residents, the 11th is benefiting from the ripple effect emanating from the bohemian buyers that have already helped push up property values in the neighbouring 10th arrondissement. Young single professionals gravitate towards the Oberkampf district to the north, while families veer further eastwards to take advantage of the parks and squares.
Properties range from large Haussmann apartments on wide boulevards, such as Avenue Voltaire, to lofts and ateliers in the more commercial districts.
A three-bedroom apartment on one of the main boulevards starts at €850,000, while the same property in the 4th arrondissement would be closer to €1.2 million.
Downtown Extension: DIFC,
World Trade Centre and
Za’abeel, Dubai
Taimur Khan, Knight Frank Middle East
ThedevelopmentoftheDowntownneighbourhood has really boosted Dubai’s standing as a propertymarketwithtrulyglobalappeal.With itsluxuryapartmentsandtop-flightamenities, such as the Dubai Mall, the world’s biggest shopping and entertainment centre, plus its proximity to the city’s key business hub, the Dubai International Financial Centre (DIFC), Downtown Dubai has become a magnet for young professionals and families alike.
Now the popularity of this live-work- play hotspot is spreading to surrounding areas, including DIFC itself, the Dubai World Trade Centre (DWTC) and the prestigious neighbourhood of Za’abeel. With a range of new developments under way, the so-called “Downtown Extension” looks set to become a sought-after mixed-use neighbourhood.
Key projects include DIFC’s Gate Avenue, which offers nearly a kilometre of high-end retail and dining concepts linked by an outdoor promenade, as well as a landmark mosque and the flagship tower Brookfield Place. DWTC’s One Central development is set to revitalise the city’s CBD, while One Za’abeel by Ithra Dubai is an iconic mixeduse development featuring the world’s first One&Only Urban Resort.
See page 46 for commercial investment opportunities
Sailing ahead clockwise from top left: Boston’s Seaport, a wharf transformed; the nouvelle chic 11th, Paris; Chelsea, ripe for reassessment; and Berlin’s arty Friedrichshain
Chelsea, London
Liam Bailey, Knight Frank Research
Few London neighbourhoods have a global brand as strong as Chelsea’s, and to name it as an up-and-coming area might on the face of it seem slightly odd. However, Chelsea is the perfect example of an area that has been underperforming and which is now ripe for reassessment.
Prices here have fallen 19% since late 2014, compared with a 10% fall across the wider prime London market. While new-build propertyinthiscategoryachievesapremium, establishedpropertytradesatbetween£1,200 and £1,800 per sq ft. With many properties now edging below £1,000 per sq ft, Chelsea is back in the spotlight and cheaper than some less central and glamorous neighbourhoods.
Yes, the area still lacks the connectivity of other prime neighbourhoods. However, with easyaccesstotheriver,unrivalledshoppingon the King’s Road and Fulham Road and some of London’s best schools within walking distance – including the Lycée Charles de Gaulle and the London Oratory School – and the promise (or maybe hope) of a station on the future Crossrail 2 underground railway, Chelsea is all set for rediscovery.
62 | KNIGHTFRANK.COM |
63 | KNIGHTFRANK.COM |

vk.com/id446425943
RESIDENTIAL PROPERTY HOTSPOTS
Lucca, Italy
Amy Redfern-Woods,
Knight Frank International
Lucca, one of Tuscany’s most scenic cities, dates back to the Roman Empire. Cobbled streets, piazzas, galleries, museums and over 100 churches all lie within the Renaissance walls that encircle its historic centre.
The city boasts a lavish selection of upmarket restaurants. For something new, try Il Punto or, for a more traditional taste, Buca diSant’Antonio, whichhasbeen serving local cuisine since 1782. Home to a mix of wealthy locals and musicians, Lucca offers a good quality of life alongside a strong sense of community and an array of events and festivals, including the Lucca Summer Music Festival, that also appeal to overseas buyers.
Located within an hour’s drive of Pisa and Florence airports, and only a 30-minute drive from the Mediterranean coast, Lucca offers a peaceful alternative to some of Italy’s more tourist-led markets. A three-bedroom, recentlyrestoredapartmentwithliftaverages around €800,000, while a larger fouror five-bedroom apartment with a garden and a lift can be acquired for around €1.5 million.
St Jean District, Côte d’Azur
Jack Harris, Knight Frank International
Renowned as the capital of France’s illustrious perfume industry, the region to the east of Grasse, known as the St Jean District, is punctuated by grand Provençal estates with traditional features such as exposed beams, wooden shutters and landscaped gardens. Just 25 minutes from the glamour and buzz of Cannes, it’s an area that appeals to those looking for easy access to the coast combined with a slower, more traditional way of life. It’s also within easy reach of beautiful historic villages, such as Valbonne and Mougins, home to the eponymous international school.
St Jean’s popularity is growing once again among international buyers looking to capitalise on its relative value. Prices for the area’s grand manor-style houses and medieval bastides have dipped by around 20% over the last five years, and a four-bedroom residence with 5,000 sq m of gardens starts at around €1.4 million.
Castellana Norte, Madrid
Rosa Uriol, Knight Frank Spain
Currently under construction, Castellana Norte is a new area to the north of Madrid straddling the prime districts of Chamartín and Fuencarral. The project involves the remodelling of Madrid Chamartín railway station and aims to create 2.6 million sq m of mixed-useddevelopment. That total includes 1.5 million sq m of office space and more than 10,000 homes, as well as new public spaces and employment opportunities, effectively shiftingthecity’scentreofgravitynorthward.
Chamartín is already one of the Spanish capital’s most exclusive neighbourhoods, with average new-build prices of more than €6,000 per sq m and very limited new supply. The desirability of the whole area can only increase as a result of this substantial investment. Indeed, Castellana Norte is expected to become one of the most sought-after areas in the whole of Madrid, attracting international students, young professionals and families with high purchasing power.
Investments of passion
Luxury spending and philanthropy
Born to rewild |
Blockbuster |
The wealthy conservationists |
How blockchain is changing |
making a difference |
the market for luxury collectables |
– page 66 |
– page 76 |
Record breakers |
Casks of gold |
Our Luxury Investment Index |
The rise and rise of rare |
performance in 2018 |
whisky as an investment |
– page 72 |
– page 78 |
64 | KNIGHTFRANK.COM

vk.com/id446425943
BORN TO
R E W I L D
Words: Andrew Shirley,
Editor, The Wealth Report
Inspired by a visit to a client’s rewilding project in South Africa, The Wealth Report meets the wealthy conservationists using their resources to protect and restore some of the world’s most precious habitats – the ultimate investment of passion
Image: Etienne Oosthuizen
Driving across Samara, a 70,000-acre private game reserve in South Africa’s Karoo region, surrounded by huge vistas, towering mountain ranges and hordes of wildlife, it’s easy to believe you’re exploring a pristine
African wilderness. But looks can be deceiving.
Every so often, there’s a clue that gives the game away: an old watering trough here, the remains of a fence there, or the ruins of an abandoned building. Barely 20 years ago the only animals here were sheep, cattle and Angora goats bred for their mohair fleece, the ochre-red soil was blowing away and alien plants such as South American agave – the source of the sap used in tequila production
– were taking over.
It has taken two decades of painstaking rewilding work by the Tompkins family – South African-born Sarah, her British husband Mark, and their eldest child Isabelle – to undo the years of over-grazing and environmental neglect. Although Sarah has the great African outdoors in her soul
– school holidays were often spent on safari at a concession in Kruger National Park leased by her grandfather and Sir Percy Fitzpatrick, author of Jock of the Bushveld – she and Mark joined the ranks of the region’s leading conservationists purely by chance.
“When I met Mark he’d never been to Africa before,” recounts Sarah. “So I put together a trip to show him what it was all about and he eventually said that it would be wonderful to have a property there. A great friend suggested that we buy land in the Karoo but we ending up buying a house at Hermanus on the coast.
Then fate intervened during a visit to Rorke’s Drift battlefield, where we met a farmer turned land agent who had a farm for sale in the Graaff-Reinet district of the Karoo.
“I almost got cold feet because I suddenly remembered the Karoo from my childhood as a vast empty place, but Mark said it would be churlish not to at least have a look. The agent packed a picnic, bundled us into their vehicle, took us to the farm and that was it. We fell in love with the spectacular and varied landscapes.” It proved to be a love affair so profound that in the space of just four years, the Tompkins ended up acquiring not just one but 11 farms, which subsequently formed the Samara Game Reserve. “I got land fever,” says Mark. “We just bought, and bought.”
Despite the detrimental impact of agriculture, the land at Samara was full of potential. Before the Karoo was settled by
Investments of passion
farmers moving up from the Cape in the late 18th century, the reserve was on the annual migration route of millions of grazing animals, witnessing movement on the same scale as that seen in the Serengeti and the Masai Mara.
It is ecologically unique, with three river systems that include four of South Africa’s nine vegetation biomes, ranging from lowland savannah to areas of upland grassland perched thousands of feet higher, valley bushveld and Nama Karoo, an arid region dominated by low shrubland and rocks. And it is also one of the world’s 36 biodiversity hotspots, making it among the richest in plant life but also the most at risk.
“Having fallen in love with the area, we began to realise that we were part of something much bigger,” explains Sarah. “Mark commissioned experts at what is now Nelson Mandela University to do lots of scientific studies, to map the vegetation and to work out what game historically occurred there, what we could put
back and what the stocking rates should be. We’re still working with them 21 years later.”
To begin with, the land was rested to allow vegetation and grasslands to rejuvenate. White and black rhinos, giraffes,elephants,cheetahsandmany species of antelope, all of which can be tracked on foot by visitors, were then gradually reintroduced. Others, such as leopards and endangered Cape vultures, followed of their own accord. Lions have also just arrived.
Although the Tompkins never envisaged opening a lodge, several old farmhouses were turned into luxury accommodation. These not only help fund conservation work
at Samara, but provide much-needed employment. “You can’t be a big landowner and just preserve biodiversity without it benefiting your local community,” points out Sarah. “After taking advice we finally decided to go down the tourism route. This is a Presidential Poverty Node – an underdeveloped area, with high levels of poverty and deprivation – and tourism is an excellent way to employ and upskill people, at the same time as promoting awareness of a little-known region.”
Visitors also help to spread the message of what the family is trying to achieve here, adds Isabelle Tompkins, who manages strategic projects at the reserve. “Our visitors don’t just enjoy a luxury holiday, they can get involved with our projects,” she says. “Seeing is believing – but doing is even better. Our guests become part and parcel of our journey.”
67 | KNIGHTFRANK.COM
vk.com/id446425943
THE WILD PHILANTHROPISTS
DookImage:
The most exciting thing about Samara, enthuses Isabelle, is that it forms just a small, albeit crucial, part of a much larger rewilding jigsaw that could span generations of the family. “These days, because of the environmental challenges that we’re facing, you can’t just think about conservation in terms of individual species or small areas. You’ve got to think big, you’ve got to think about it on a landscape scale.”
The Tompkins’ land is now part of an ambitious plan – alongside stakeholders including South African National Parks – which involves doing just that. The idea is that Samara will act as a stepping stone connecting other private reserves and national parks in the region, with the aim of eventually creating a 3 million acre wildlife corridor that would be the second-largest conservation area in South Africa, after the Kruger National Park.
“It’s a long-term goal, but hopefully I’ll see some of it through by the end of my life – or maybe I’ll have to leave that to my kids or even my grandkids,” Isabelle laughs.
Without borders
Although projects on such a large scale inevitably require the involvement of governments and national authorities, the impetus provided by private individuals is often the catalyst. One of the world’s biggest rewilding initiatives is being driven by South African-based NGO Peace Parks Foundation, co-founded in 1997 by Nelson Mandela, businessman and philanthropist Dr Anton Rupert, and Prince Bernhard of the Netherlands.
The organisation has facilitated the establishment of transfrontier conservation areas (TFCAs) throughout southern Africa covering
Investments of passion
Thinking big previous page and above: the 70,000-acre Samara reserve in South Africa, where the Tompkins family is working to restore habitats and reintroduce wildlife – including cheetahs
a staggering 250 million acres – an area the size of Spain and France combined. As part of a holistic approach to further develop and ensure sustainability for these critical cross-border ecosystems, Peace Parks has initiated various projects to rewild and provide management support for 25 million acres of key conservation areas within the TFCAs over the next decade.
The Rupert family is still actively involved with the Foundation, with Dr Rupert’s son Johann serving as the current chairman and granddaughter Caroline sitting on the board of directors. “Rewilding is an increasingly important part of the Foundation’s work and is particularly vital in some of the more remote conservation areas where wildlife numbers have been depleted,” explains Caroline.
“Here, restoration of ecosystems is required to enable viable tourism development, which will benefit communities – such as the
work going on in Zinave National Park in Mozambique to translocate thousands of animals as part of a multi-year programme.”
Meanwhile, on the other side of the world, another project is rewilding and protecting millions of acres across Argentina and Chile, in particular the Patagonia region. Like Samara it began by chance, says Kristine Tompkins – no relation to Sarah and Mark, but a mentor and keen supporter of their work. “Sarah is going to be one of South Africa’s greatest conservationists,” she tells me.
Kristine founded Tompkins Conservation, an umbrella organisation for various foundations and activist groups, with her late husband Douglas, who started the North Face outdoor brand and Esprit fashion house. “In the 1960s Doug was spending a lot of time in Patagonia and just fell in love. Then the same thing happened to me,” she explains. “There was no game plan, but when we retired
68 | KNIGHTFRANK.COM |
69 | KNIGHTFRANK.COM |
vk.com/id446425943
THE WILD PHILANTHROPISTS
Image: Antonio Vizcaíno, courtesy Tompkins Conservation
Image: Meridith Kohut
Wild things left: the wetlands of the Great Iberá Park, Patagonia; below left: Kristine Tompkins and her step-grandchildren
look out over land donated by the Tompkins Foundation to the Chilean government; opposite: the Corrour Estate
from the world of business and were looking for a new challenge, this suited our priorities. In a way, we had no choice because the loss of biodiversity and extinction of species is the biggest threat facing the world. And, sadly, things are heading in the wrong direction. There’s no question that the danger is even greater now.”
So far, Tompkins Conservation has spent over US$350 million acquiring and restoring land in Latin America. In monetary terms it’s a huge amount, but the areas of land involved are equally staggering. Pumalín Park in Chile, for example, was the Tompkins’ first major project and began with the purchase of a 42,000-acre cattle ranch in 1991.
This was added to over the years, and in 2017 their Fundación Pumalín donated 1 million acres of land to the Chilean government to help form an 11 million acre national park, the largest in Latin
America. In Argentina, 370,000 acres of former farmland acquired by the Tompkins Conservation Land Trust was donated in 2015 as part of the creation of the 1.7 million acre Great Iberá Park, the biggest in the country and the second largest wetlands in South America.
Team effort
The work of Tompkins Conservation has attracted the support of other philanthropists and foundations including the Arcadia Fund, co-founded by Swedish ecologist Dr Lisbet Rausing and her husband, historian Professor Peter Baldwin. Arcadia has donated around US$500 million since its inception in 1991, with a significant proportion going to rewilding projects.
Of this, US$9 million to date has gone to support rewilding projects run by the Tompkins, who Lisbet Rausing describes as “the greatest conservationists of our, or indeed any, era”. These include the purchase and restoration of nearly 29,000 acres of degraded commercial grazing lands which are now part of the
Investments of passion
Image: simonjauncey.com
Great Iberá Park reserve. “Iberá is one of the world’s great freshwater wetlands,” says Dr Rausing. “It’s a paradise covering more than three million acres of grasslands and marsh that were, until very recently, threatened by conversion to huge commercial rice farms.” As well as funding the projects of others, the couple – whose Endangered Landscapes programme in partnership with the Cambridge Conservation Initiative at Cambridge University will invest US$30 million in eight community-led and expert-guided rewilding projects across Europe over the next five years – have instigated their own extensive project at one of their own homes. When they purchased the 57,000 acre Corrour Estate in the Scottish Highlands in 1995, it had been overgrazed and planted with exotic
conifers. Fewer than 100 acres of natural woods remained. Although rewilding works best at scale – “do not manage for
individual species, you are a landscape guardian” – rewilders also need to think small, urges Dr Rausing. “The missing pieces of the ecological puzzle can be tiny, yet essential. The near-extinction of wood ants in Britain is a big problem for woodland ecology.” Freshwater ecologies and marine landscapes are also often overlooked and infamously poorly managed, she laments.
That is an omission Jasper Smith, a tech entrepreneur turned venture capitalist turned yacht builder, wants to help redress.
“If you look at our planet, the ocean covers two-thirds of it and only 10% of the seabed has been mapped. Given its size, very little research has been done,” he says.
One of his companies, Arksen, is building a new range of environmentally friendly superyachts aimed at sea-lovers who want their boats to be used for more than sunbathing and partying. “Inside they are very comfortable, but they have been designed with research in mind,” explains Jasper. “They are super strong so can go anywhere, and include on-board labs, monitoring systems and large rear decks for all the equipment you need on an expedition. They’re the aquatic version of a cross between a Tesla and a Land Rover.”
Perhaps more importantly, though, says Jasper, every purchaser has to agree that their yacht can be used for research for 20% to 40% of the year. In addition, 20% of the purchase cost will be put into the Arksen Foundation to help fund its projects. “My aim is to have a fleet of at least 20 vessels engaged in research across the oceans,” he says.
But whether it’s the oceans or the land that you want to help preserve, there is a community of like-minded people waiting to help and encourage you, says Dr Rausing. “I have lost count of the new friends I have made, as we help each other to retrieve and repair what earlier generations have destroyed.”
70 | KNIGHTFRANK.COM |
71 | KNIGHTFRANK.COM |
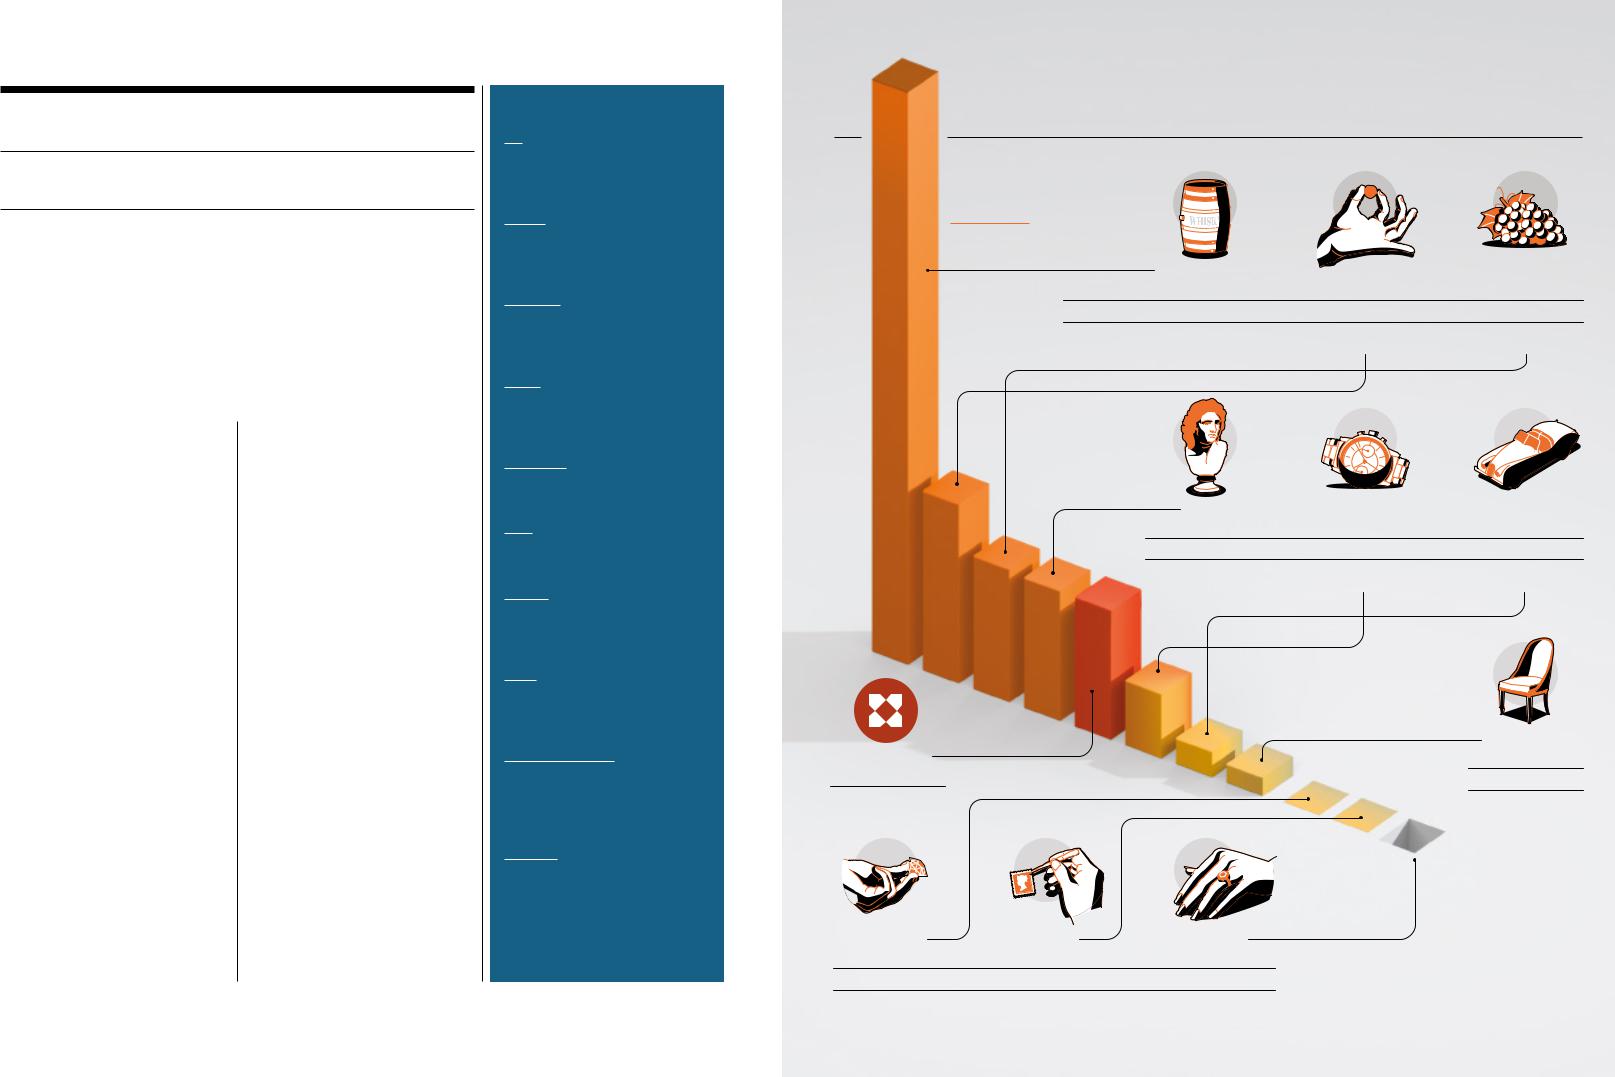
vk.com/id446425943
INVESTMENTS OF PASSION
Record breakers
The data providers for the Knight Frank Luxury Investment Index share their thoughts on the past and future performance of some of the most popular asset classes in the Index. We also include details of the standout auction sales of the past 12 months for each category
CLASSIC CARS
Dietrich Hatlapa, HAGI
The HAGI Top Index for rare classic cars, which includes 50 models from 19 marques, rose almost 2.5% in 2018. However, not every marque recorded an increase. Porsche, for example, fell on average by 6.5%.
Highlights of the year included the sale of two 1960s Ferrari 250 GTOs for US$48 million (an auction record) and US$70 million (privately). A 1935 Duesenberg Model J, once owned by actor Gary Cooper, was auctioned for US$22 million, a record for a pre-war car.
But records aside, the real story of 2018 is the return to moderate market turnover after the classic car bull run of 2012-15, as well as a shift from agency sales to private networks. A survey of HAGI members revealed that more than 70% of recent transactions were agreed among “friends”.
The most influential group in the market remains knowledgeable collectors, and their asset allocation preferences have changed. No new money was allocated to portfolio expansion in 2018, only to upgrading or replacing existing holdings.
In addition, many new entrants who joined the market five years ago have now exited. As a result, there are a lot of opportunities for buyers in the current market.
The sell-through rate at the first major auctions of 2019 at Scottsdale, Arizona, showed demand remains strong. But pricing is clearly key, with many lots failing to make their mid-estimates.
COLOURED DIAMONDS
Oren Schneider, Fancy Color Research Foundation advisory board member
Last year was a fairly positive year for fancy coloured diamonds and we continue to see pricing stability. Prices across most colours and sizes rose slightly on average, even though the Chinese economic slowdown caused a decline in the number of fancy colour diamond retail transactions.
At the top price points, where supply is permanently short, values were practically unaffected. Traders are holding firm, projecting an improved trading environment in the second half of 2019.
In terms of colour, blue diamonds were the top performers in 2018, with yellow values weakening slightly and pinks remaining stable. Fancy intense blues performed particularly strongly, with some sizes rising in value by almost 12%.
TOP SALES 2018
Art Portrait of an Artist (Pool with Two Figures) by David Hockney. Sold by Christie’s for US$90 million. Most expensive work by a living artist.
Whisky A bottle of The Macallan 1926, hand painted by Michael Dillon. Sold by Christies for US$1.5 million. Most expensive bottle of whisky.
Jewellery The Marie Antoinette pearl pendant. Sold by Sotheby’s for US$36 million. Most expensive piece of pearl jewellery sold at auction.
Watch 1970 Rolex Daytona “Unicorn”. Sold by Phillips with Bacs & Russo for US$5.9 million. Most expensive watch sold at auction in 2018.
Classic car 1962 Ferrari 250 GTO. Sold by RM Sotheby’s for US$48.4 million. Most expensive car sold at auction.
Wine Bottle of 1945 Romanée-Conti.
Sold by Sotheby’s for $US558,000. Most expensive bottle of wine sold at auction.
Stamps 1918 Jenny Invert 24 cent. Sold by Robert A. Siegel Auction Galleries for US$1.6 million. Most expensive US stamp sold at auction.
Coins 1621 Polish gold 100 ducat.
Sold by the Classical Numismatic Group for US$2.2 million. Most expensive Polish coin.
Coloured diamonds The Winston Pink Legacy, 19-carat fancy vivid pink diamond. Sold by Christie’s for US$50 million. Most expensive pink diamond per carat.
Furniture 1766 Chippendale commode with ivory inlays sold previously in 1991 for £935,000, a record price for a piece of English furniture. Offered for auction by Christie’s with the inlays removed due to new legislation and an upper estimate of £5 million. Failed to sell.
Luxury investment outlook
OBJECTS OF DESIRE The results of the Knight Frank Luxury Investment Index (to Q4 2018)
12-MONTH CHANGE IN ASSET VALUE
|
RARE WHISKY |
COINS |
WINE |
12-MONTH |
40% |
12% |
9% |
10-YEAR |
582% |
193% |
147% |
2018 |
1926 |
1621 Polish gold |
1945 |
TOP SELLER |
The Macallan |
100 ducat (Polish) |
Romanée-Conti |
ART |
WATCHES |
CARS |
9% |
5% |
2% |
158% |
73% |
258% |
David Hockney |
1970 Rolex Daytona |
1962 Ferrari |
Portrait of an Artist |
“The Unicorn” |
250 GTO |
KFLII INDEX |
FURNITURE |
1% |
|
9% |
-32% |
161% |
Chippendale commode |
|
(failed to sell) |
COLOURED |
STAMPS |
JEWELLERY |
|
|
DIAMONDS |
Notes: All data to Q4 2018 except stamps (Q4 2017) and watches (Q2 2018). Reflecting demand |
|||
0% |
0% |
-5% |
||
we have replaced Chinese ceramics with rare whisky. Following the decision of Stanley Gibbons |
||||
122% |
189% |
112% |
to cease its coin and stamp indices this data is now provided by Art Market Research. |
|
Art is now based on the Art Market Research All Art Index, which tracks 10,000 painters |
||||
Pink Legacy |
1918 Jenny |
The Marie Antoinette |
Sources: Compiled by Knight Frank Research using data from Art Market Research (art, jewellery, |
|
watches, stamps, coins, furniture), the Fancy Color Research Foundation (coloured diamonds), |
||||
(pink diamond) |
Invert 24c |
pearl pendant |
HAGI (classic cars), Rare Whisky 101 (whisky) and Wine Owners (wine) |
72 | KNIGHTFRANK.COM |
73 | KNIGHTFRANK.COM |

vk.com/id446425943
LUXURY COLLECTING
WINE
Nick Martin, Wine Owners
Just when we thought the limits at the top of themarketwerebeingtested,2018sawfurther rapidpriceescalationforBurgundies, notably top Grands Crus from the “Rs” (Raveneau, Romanée-Conti, Roumier and Rousseau), driving our Burgundy index up 33%.
Sotheby’s October sale saw a single bottle of La Romanée-Conti 1945 fetch US$558,000
– somewhat higher than its upper estimate of US$32,000! The sale highlighted the potential premium the market is prepared to payforimpeccableprovenance.Thematuring Asian fine wine market places a heavy emphasis on history and cosmetic condition.
It’s hard to predict where the top end of the market will go from here, but it’s likely this pattern of polarisation favouring blue chip wine from top producers will continue, with prices accelerating, in particular as the wines approach their drinking windows.
On a longer-term view, collectors will want to continue to buy into those young and upcoming Burgundy and Piedmont producers who have the best-located vineyards.
Outside France, our Californian index (up 17.5% in 2018) continues to push ahead, driven by a mix of scarcity, local demand, direct-to-consumer models and, of course, intrinsic quality. It’s also nice to see that undervalued, accessible Spanish Riojas are enjoying a resurgence, with the great estates of Tondonia and CVNE setting the pace.
WHISKY
Andy Simpson, Rare Whisky 101
Last year was a transformational one for rare single malt Scotch whisky. One bottle set a new world record of £700,000 in October, only to be beaten a month later by one that soldfor£1millionbeforethebuyer’spremium.
Both were bottles of The Macallan distilled in 1926. Values for certain old vintage rarities soared past previous records, achieving almost unimaginable new auction highs.
The Knight Frank Rare Whisky 100 Index (KFRW100), which contains 100 bottles of the world’s most desirable rare Scotch whisky and tracks UK auction prices, increased by almost 40% through 2018.
However, 21 bottles in the KFRW100 did lose value last year. The bottom ten would have cost £25,410 at the end of 2017; by the end of 2018, that figure had shrunk by 27%
Values for certain old vintage rarities of single malt Scotch whisky soared past previous records, achieving almost unimaginable new auction highs
to £18,670. As with all investments, the potential for punishing losses is very real.
Looking to 2019, we see prices continuing to harden for the right bottles from the right distilleries, as well as increased interest in more affordable bottles from the second tier. But certain pockets could see a correction.
To some extent we saw that with The Macallan 18-year-old index, which fell by 2.9% in 2018. This followed a 142% increase in 2016 and a further 35% increase in 2017, so perhaps an adjustment was to be expected.
From a risk perspective, we believe the incidence of fakes can only increase while prices are so high and demand so robust.
ART
Veronika Lukasova-Duthy, Art Market Research
Record-breaking sales at Sotheby’s and Christie’s last November capped another impressive year for the big auction houses. In New York, Christie’s US$833 million spring sale of 1,500 objects belonging to the Rockefeller estate was the highest auction total ever for a single collection.
The sale produced individual artist records for Henri Matisse and Diego Rivera, but may be remembered more for the huge media attention it gained worldwide. Social media marketing is vital to auction houses at a time when profits for big ticket sales are increasingly split with third-party guarantors.
The US$90 million sale in November of David Hockney’s iconic work Portrait of an Artist was also surrounded by huge media attention and produced another record, this time for a living artist.
Sotheby’s also set its fair share of records. InLondoninOctober,JennySaville’sPropped sold for US$12.5 million, more than doubling its estimate and breaking the record for a womanartist.AmonthlaterTheBusinessmen by Jacob Lawrence tripled its estimate, selling for US$6.2 million in New York.
Works by African-American and women artists have long been considered undervalued but this level of interest may have taken even the experts by surprise. I expect the trend to continue.
Crème de la crème Achieving US$36 million, the Marie Antoinette pendant set a new record as the most expensive piece of pearl jewellery sold at auction
Investments of passion
74 | KNIGHTFRANK.COM |
75 | KNIGHTFRANK.COM |

vk.com/id446425943
ART AND THE BLOCKCHAIN
Blockbuster
Last year The Wealth Report investigated the impact of blockchain on property markets. The verdict? No significant disruption – so far. In this edition, we shift focus to an area that could offer a clue as to what’s coming next: the world of art and luxury investments
Words: Sophia King, Knight Frank
Despite a name laden with structural possibilities, you can’t create a building from blockchain. But when it comes
to investments of passion, the so-called distributed ledger is already breaking new ground as a medium for art in its own right.
Conceptual artist Kevin Abosch grabbed headlines last year with his IAMA Coin project, comprising 100 physical and 10 million virtual artworks. Mr Abosch – who sold a photograph of a potato for €1 million in 2015 – stamped the physical work with the Ethereum blockchain addresses of the virtual pieces in his own blood to proclaim himself “a coin”.
A few months later, he was at it again, sellingYellowLambo –42neonalphanumeric figures representing the blockchain contract address for crypto token YLAMBO – for US$400,000. That’s approximately double the price tag of an actual Lamborghini.
If that doesn’t sound abstract enough, members of CryptoKitties, one of the world’s first blockchain games, breed and trade unique digital cats while monitoring their value as you would a traditional collectable. One kitty with rare “cattributes” reportedly sold for approximately US$170,000 and, to date, the game has received US$27.9 million in funding, with Samsung Next and Google Ventures among its backers.
While this may prompt eye-rolling, such work offers an interesting insight into how blockchain could redefine our perception of value – and highlights that it’s certainly catching the attention of some very wealthy
individuals. However, for most collectors, the technology will offer more prosaic uses.
The luxury goods market is worth more than US$2 trillion, yet it is fraught with challenges. As any collector will know all too well, value is inextricably linked with authenticity – which can be incredibly hard to prove. But its proponents believe blockchain could help change that.
Last year, Deloitte dedicated its Art & Financeconference to innovativetechnology,
Blockchain provides an easily consultable public record for unique collectables. From an investment perspective, that’s really interesting
while Christie’s Art+Tech Summit in summer 2018 explored blockchain’s potential applications within the art market. In November, Christie’s recorded the most valuable art auction ever on a blockchain: the recordbreaking sale of the Barney A. Ebsworth Collection for close to US$318 million was described by the auction house’s Chief Information Officer Richard Entrup as reflecting a “growing interest within our industry to explore the benefits of secure digital registry via blockchain technology.”
“We have public registries for assets such as our homes and cars, but there’s nothing like that for most art collectables,” explains JessHoulgrave,co-founderofCodexProtocol, aregistryforuniquecollectables.“Blockchain provides an easily consultable public record. From an investment and finance perspective, that’s really interesting.”
Promisingto“simplifyownershipofawhole world of different assets”, Codex Protocol
enables members to record details such as provenance, ownership and appraisal notes on the blockchain and ultimately contribute to a more efficient market. Importantly, too, given the significance of privacy to many of the world’s wealthy, each member of the Codex network has a unique digital signature that ensures authenticity without compromising anonymity.
But uploading information to blockchain is not without its challenges. Sourcing the relevant documentation for collectables that in some cases will have provenance reaching back thousands of years could be an insurmountable task – but for new assets, the opportunities are significant.
Following a successful pilot at the start of last year, diamond producer De Beers announced plans to launch the first diamond blockchain. By tracking the journey from miner to retailer to end-user, the blockchain can guarantee diamond purity, making the whole process more efficient – and a lot more transparent.
The public and immutable nature of blockchain also creates a viable process for fractional ownership. Last year, bidders on blockchain-based art investment platform Maecenas used cryptocurrency to purchase 31.5% – equivalent to US$1.7 million – of Andy Warhol’s 14 Small Electric Chairs.
TEND, a blockchain-powered investment platform founded in 2017, tokenises high-end assets to enable its clients – mostly affluent 30-somethings – to co-own and experience aspirational items. A fine wine portfolio might include tasting sessions at French vineyards; a Porsche can be taken for a spin at weekends; and a thoroughbred horse can be cheered on from the VIP lounges of world-famous racecourses.
Image: courtesy Kevin Abosch studio
Investments of passion
In a world where most masterpieces are accessible only to the few, fractional ownership lowers barriers to entry and opens up a traditionallyexclusiveworldtoamorediverse audience. “Blockchain enables us to open up an entirely new market and offer access to exciting things,” says founder Marco Abele. “It’s amazing to see people’s faces light up when we show them what we can do.”
But whether you’re a collector of traditional Old Masters, a technophile keen to embrace the new digital world, or somewhere in between, one thing is clear: blockchain has the potential to solve many of the challenges faced by the art and luxury collectables market. Only time will tell just how sizeable its impact will be.
High concept The 42 alphanumeric figures in Kevin Abosch’s Yellow Lambo represent the blockchain contract address
for crypto token YLAMBO
76 | KNIGHTFRANK.COM |
77 | KNIGHTFRANK.COM |
vk.com/id446425943
Single malt whisky is increasingly seen as an investment of passion by high-net-worth collectors, particularly in Asia. The Wealth Report heads to Scotland to get the lowdown for would-be investors
Words: Andrew Shirley, Editor, The Wealth Report
New traditions above: Made in traditional cooperages near Jerez de la Frontera, The Macallan’s barrels are imbued with the flavours and aromas of sherry opposite: Lindores Abbey – the spiritual home of Scotch whisky – is one of the new generation of craft distillers
Image: Steve McCurry, courtesy The Macallan
Pop stars and actors might have groupies, but whisky experts? Seriously? I wouldn’t have believed it either until I witnessed first-hand the adoration reserved for Charles Maclean, the “godfather” of whisky and author
of numerous books on the subject.
I’m with Mr Maclean and Charlie Beamish, a former investment banker who now runs a private client business that brings together high-end single malt brand owners and wealthy collectors, on a private tour of the Glenfiddich distillery in Speyside when two other visitors run up excitedly. They chat animatedly to Charles for a few minutes before, visibly star-struck, continuing with their tour.
It turns out they are visiting from Asia where Mr Maclean frequently does speaking tours. When I ask if this is a common occurrence he demurs modestly – but I later find out that there is a chain of whisky-themed bars named after him being developed in China.
Perhaps I shouldn’t have been so surprised. After all, the value of the new Knight Frank Rare Whisky 100 Index, compiled for us by consultancy Rare Whisky 101 and featured for the first time in the latest Knight Frank Luxury Investment Index (see page 73 for more details), has risen by almost 600% over the past ten years.
Investments of passion
Some of the world’s wealthiest people, including Amazon’s Jeff Bezos, are reportedly big collectors. But it’s in Asia where the trend seems to be accelerating fastest. Chinese tech entrepreneur Jack Ma’s private jet has been spotted at Aberdeen airport, while whisky tourism was apparently one of the drivers behind the launch of a new non-stop flight from Edinburgh to Beijing in 2018. Sales of Scotch whisky to India, China and Singapore rose by 44%, 35% and 24% respectively in the first half of 2018 according to the Scotch Whisky Association, with single malts totalling almost 30% of total exports.
“It seems single malts have taken over from wine,” confirms Sami Robertson, a Knight Frank
global property ambassador who works closely with clients based in Singapore. “People are spending huge amounts on their cellars. I was talking to one of my contacts recently who paid well over £100,000 for a single bottle.”
But even that sum looks like pocket money compared with the record £1.2 million paid for a unique bottle of The Macallan 1926, hand painted by Irish artist Michael Dillon and sold by Christie’s at its November 2018 whisky sale in London.
The Macallan 1926 enjoys legendary status among collectors. Only 40 bottles of the record-breaking whisky, 60 years old at the time of bottling, were produced, the mostfamousbeingtheeditions
–12 of each – illustrated by artists Peter Blake and Valerio Adami. Sukhinder Singh, who started his career working in his family’s
west London off-licence, probably knows more than anybody about rare whiskies and has amassed one of the world’s largest collections
– 10,000, he tells me – as well as creating The Whisky Exchange, an online trading platform and chain of shops. We meet at his newly opened store on Great Portland Street, surrounded by thousands of different types of whisky from all over the world. It’s not just Scotch that is in demand, he points out: a bottle of 50-year-old Japanese Yamakazi fetched US$343,318 at Bonhams in Hong Kong in August 2018.
Mr Singh has just returned from the Christie’s sale and recounts how he sold a bottle of The Macallan 1926 for “just” £5,000 about 20 years ago. He must wish he’d hung on to it, I sympathise. “I don’t
feel too bad; I’ve still got a few bottles. We’re not in a hurry to sell. It’s important to us that they’re placed in the hands of customers who will appreciate them. It’s amazing how quickly prices and demand have risen over the last few years in particular.”
This explains why distilleries like Glenfiddich and The Macallan are investing heavily to boost production and why a select band of advisers such as Mr Beamish are increasingly criss-crossing the world helping collectors to source hard-to-find whiskies.
For some collectors, however, tracking down individual bottles is not enough. They want their own casks, and are prepared to pay sixor even seven-figure sums to get them. “Putting your own whisky into customised decanters created for you by a premium crystal-maker and giving them to your friends in a stunning presentation box really is the ultimate gift,”
points out Mr Beamish.
But even for those with the deepest pockets that’s easier said than done. Given the rising value of rare whisky, selling older casks is now viewed by most distilleries as a bit like selling the family silver. “If you know the right people it is possible to track down casks, but distilleries are generally very reluctant to sell,” says Mr Beamish. “You can’t just turn up on the doorstepwavingyourchequebook.”
Diageo, which owns 28 single malt whisky distilleries in Scotland, is unusual in that it runs a formal programme called
Casks of Distinction. But this is open only to selected private clients and involves a very limited number of casks, emphasises James Mackay, Head of Rare and Collectable Spirits. “It offers our most passionate customers a very special opportunity to share a stake in some of our most iconic brands such as Brora, a ‘silent distillery’ that shut in 1983, but which we’re reopening next year,” he says.
“We are often approached, but our response is always a polite ‘no’,” Stuart Cassells, Prestige Channel Development Manager at The Macallan, tells me during a visit to the company’s recently opened £140 million distillery and visitor experience.
The Macallan does, however, “sell” a limited number of casks of newly-distilledspiritthroughitsnewEnPrimeurprogramme.Legally,
78 | KNIGHTFRANK.COM |
79 | KNIGHTFRANK.COM |

vk.com/id446425943
RARE WHISKY
Image: Paolo Pellegrin, courtesy The Macallan
Where the magic happens The relatively small size of The Macallan’s stills helps to create a robust, heavy whisky with huge ageing potential
all Scotch whisky must be matured for a minimum of three years, but the En Primeur casks must be matured for a minimum of 12 years.
Costs start at £35,000 for the invitation-only programme, which is available only to selected clients. “The programme was created to encourage enjoyment of The Macallan Single Malt, rather than as an investment or speculation opportunity,” explains Mr Cassells. “At the end of maturation, clients have the rights to the spirit in the cask and will also be offered the opportunity to collaborate with us on a customised design for their unique collection of The Macallan that they can enjoy, share and give away.”
A more cost-effective option for investors or aficionados unable to get their hands on a cask of aged whisky or new spirit from a brand like The Macallan is to head to one of the new generation of craft distilleries opening across Scotland and hope that one day their whisky becomes collectable.
The distillery, for example, set up in 2017 by the McKenzie-Smith family on the site of Lindores Abbey, which some historians believe to be the spiritual home of Scotch whisky, sells a small number of casks of new spirit each year, starting from around £1,100 for a 50-litre firkin to almost £10,000 for a 500-litre butt.
“It helps to maintain cash flow and build brand awareness until we can begin bottling our whisky in a few years’ time,” explains Drew McKenzie-Smith as he proudly shows off his new stills.
“We get a lot of visitors and have sold casks to people from all over the world. Although it’s still early days, we’re confident our whisky is going to taste pretty good.”
There is also a secondary market for casks sold off by distilleries before the value of single malt whisky started to rocket, but buyers should exercise caution, says Andy Simpson of Rare Whisky 101. “We’ve helped people to acquire some amazing casks, but there is no guarantee that just because a barrel is old or from a well-known maker that the whisky will taste amazing or even be drinkable.”
For pure investors it’s the age and rarity of a bottle, rather than the contents, that counts. But most collectors are also passionate about drinking whisky, says Cecily Chappel, Commercial Director of the Last Drop, a company that over the past ten years has been doing the hard work for collectors by scouring distilleries for old casks that are then bottled and sold as limited releases for upwards of £2,400 per bottle. “The youngest whisky we’ve bottled was 45 years, but it’s not just about age – it has to taste delicious,” she enthuses.
But as I’m fast discovering, gaining access to the rarest whiskies is not easy. “Our smallest release was just 32 bottles and was offered to only our most loyal buyers,” confides Mrs Chappel. Clearly, it’s not what you know, it’s who you know that matters in this rarefied world
– which explains why experts like Charles Maclean are so revered by their fans around the world.
COLLECTING
with the ANGELS
Thinking of starting a whisky collection, whether for passion, investment or a bit of both? The Wealth Report brings together some leading industry experts to point you in the right direction
Raise your glass Canny whisky collectors are blending serious investment with pure pleasure
Investments of passion
For some, investing in whisky rather than drinking it might be considered a cardinal sin. But with prices rising rapidly, many collectors are choosing to combine their passion for the
spirit with a spot of speculation.
Charlie Beamish of Beamish International, a private client business focused on alternative investments and specialising in whisky, offers some suggestions on how to hunt out the best prospects.
Genuine enthusiasts are more likely to be offered a rare bottle by a specialist retailer or distiller, he says. “Go to tastings and auctions, attend shows and get to know as many people as possible. If you’re really lucky you might even get the opportunity to purchase a cask.
“These very rarely come up for sale, but when they do, they are highly sought after. Having access to rare casks directly from brand owners with the option of an originalbottlingistheultimateinrarewhiskycollecting.” Therearearound 120maltwhiskydistilleriesoperating in Scotland and 40 or so “ghost” or “silent” distilleries that have shut, but whose aged whisky is still being released as it matures. “The romance and rarity factor makes bottles from these distilleries highly sought
after,” says Mr Beamish.
When it comes to tracking the market, auction data, such as the Knight Frank Rare Whisky 100 index compiled by Rare Whisky 101, is important as it provides a benchmark for future bidding, privately or at auction
– and can also help to identify the next emerging trend. However, data can only tell part of the story, explains Mr Beamish. “The most crucial intelligence we gather is from the private marketplace. For example, knowing how many bottles of a very limited edition whisky have been drunk gives us a good idea of the potential value
of the bottles that remain.”
Finally, it’s time to solve the mystery: what’s the link between angels and whisky? “The alcohol that evaporates while the whisky is in the cask
is called the angel’s share,” says Mr Beamish. “If the alcohol by volume of a cask drops below 40% it can no longer be sold as whisky. So if the angels take too much, it’s pretty serious.”
80 | KNIGHTFRANK.COM |
81 | KNIGHTFRANK.COM |

vk.com/id446425943
RARE WHISKY
Charles Maclean
How to enjoy whisky and know what you’re drinking
Author of 17 books on the topic, Charles Maclean is often referred to as the godfather of Scotch whisky. He took a break from his busy schedule of tasting and touring to share his tips on where to start your whisky journey with The Wealth Report.
There are so many whiskies and styles to choose from. How do you find out what suits your palate?
The best thing to do is find a bar with a good selection of malt whiskies and a knowledgeable bartender and go there when it’s not too busy. Ask the bartender to choose three whiskies of different styles – I’d suggest a sweet Speyside, a smoky Islay and a sherried-style Highland – and see which you like best. Then ask for three different types of your favourite to narrow it down further. Drink and repeat! (To get you started see Sukhinder Singh’s ten picks, opposite.) It’s all about becoming aware that each malt is different.
What’s the best way to taste whisky?
If you’re drinking purely for pleasure, particularly a blended whisky, anything that you enjoy goes – ice, water, even mixers – although I wouldn’t advise
adding a mixer to an expensive single malt. However,
if you really want to appreciate a whisky there are a few things to bear in mind. The first is that flavour is a combination of three things – smell, taste and texture – so using the right sort of glass is important. A tumbler is great for drinking, but no good for tasting. A whisky nosing glass such as a Glencairn glass has a decent bowl that narrows and tapers towards the rim, allowing you to swirl the whisky and catch the vapours. A white wine glass or small brandy snifter will also work. Always take time to smell before you taste and don’t be afraid to add a little water. This will open up the aroma and make it easier to hold the whisky in your mouth so you can appreciate all the different flavours.
What part of the manufacturing process has the biggest impact on taste?
The type of water, barley and still used, plus the intricacies of the distillation process, will all have an impact, but I’d say as much as 85% of a malt whisky’s flavour comes from the time it spends being matured in its cask. The type of oak, European or American, used to make the cask, what was in the barrel before (generally sherry or bourbon – malt whisky is rarely matured in new barrels), whether the cask has already been used to mature whisky (first fill or refill), and how long the whisky has spent in the cask will all have an impact
on taste, texture and colour.
How important is age? Is older always better?
This is a tricky one. Long-aged whiskies are generally more expensive and can taste more interesting and complex, but age is no guarantee of quality. You can produce a very good whisky in 12 years, but I’d say at
18 years you’re getting a good balance between taste and price. If the bottle bears an age statement, it relates to the youngest component. The received wisdom is that whisky stops maturing once it’s bottled but I’d say that once you’re halfway down a bottle you should finish it within four months as it will change when exposed to air.
Does the true connoisseur only drink single malt whisky from Scotland?
Absolutely not. Although malt whisky is universally recognised as being the most complex spirit, I drink blended whisky for pleasure and there are some amazing whiskies being produced all around the world. They may be quite different to Scotch, but they are different by design.
Sukhinder Singh
How to start building a collection
With literally thousands of bottles for the budding whisky enthusiast to choose from, it would be easy to start a collection by going for the famous names.
But to help burnish your credentials as a connoisseur, The Wealth Report asked leading collector, retailer and educator Sukhinder Singh to share his top tips and choose ten lesser known options, all priced at about £50, from the regions of Scotland and the rest of the world.
Sukhinder’s top tips
 Don’t restrict yourself to one whisky. Whisky is all about emotion and feeling, so you’ll need at least five to suit your different moods.
 Bear in mind that whisky is produced in batches, so even the same brand can vary in taste over time. You may find yourself falling in and out of love, even with your favourites.
 Learn to read labels, as they are very often a mine of information. This is particularly the case for those bottles produced by independent bottlers.
 Keep educating yourself. Go to whisky shows and seek out specialist retailers. The best will want you to learn as well as buy.
 Don’t assume that all special editions are actually special. Some are great, but some are just cashing in on the surge in demand.
Investments of passion
SUKHINDER’S STARTERS FOR 10
CAOL ILA 12-YEAR ISLAY SINGLE MALT
This is a good entry level Islay whisky. Not too peaty, but lots of punch and fruity flavours.
TALISKER 10-YEAR SINGLE MALT FROM SKYE
This is a step up from Speyside malts with a smokier, more coastal salty character and notes of seaweed.
THE ARRAN 14-YEAR SINGLE MALT
Lovingly made by a family-owned distillery, it has a distinct coastal flavour, balanced by the sweetness of vanilla and peaches.
THE BALVENIE 14-YEAR CARIBBEAN CASK SINGLE MALT
A Speyside whisky that has been finished in rum casks for around six months to give lovely vanilla and toffee notes.
GLENFARCLAS 15-YEAR HIGHLAND SINGLE MALT
Christmas cake in a glass. Matured in well-chosen sherry casks by a family-owned distillery, this is great value for money.
CLYNELISH 14-YEAR COASTAL HIGHLAND SINGLE MALT
Produced opposite the legendary “silent” Brora distillery in the far north of Scotland, this is a rich, honeyed, waxy dram.
REDBREAST 12-YEAR SINGLE POT STILL IRISH WHISKEY
Made with both malted and unmalted grain this offers something slightly different from a typical single malt and has elements of tropical fruit. I love it.
KAVALAN CLASSIC TAIWANESE SINGLE MALT
Very young but equivalent to a much older Scotch as it matures more quickly in the hotter Asian climate. Light, sweet and oaky; how some Scottish single malts used to taste.
HIBIKI JAPANESE HARMONY BLENDED MALT AND GRAIN WHISKY
This is a lovely, easy drinking Japanese whisky with soft notes of orange peel and white chocolate.
MICHTERS SOUR MASH AMERICAN WHISKEY
The epitome of American whiskey with cinnamon, butter and nutty notes. This is our 2019 whisky of the year.
82 | KNIGHTFRANK.COM |
83 | KNIGHTFRANK.COM |

vk.com/id446425943
LUXURY ASSET MANAGEMENT
Keeping a cool head
Five top tips for getting the most out of investments of the heart
Words: Nic Arnold, Private Client Director and Head of Luxury Asset Advisory, PwC
 01 02 03
04  05
05
Read the full list of ten tips at knightfrank.com/wealthreport
The decision to buy a yacht or invest in art is often driven by the heart, rather than the head. And it is fair to say that the heart is unlikely to be thinking of tax reporting or penalties for inadvertently failing to understand tax rules when experiencing the joy of a favourite painting or using a private jet. But investors
would do well to put the same level of tax consideration into the purchase of a luxury asset as they do into investing in a business or investment portfolio. Below are five issues for investors to consider.*
Corporate jets
Since UK income tax changes in April 2017 the private use of corporate jets has become increasingly complex, with individuals finding themselves subject to high “benefit in kind” income tax charges – even, in some circumstances, where they have paid for use of the aircraft. As a result, individuals owning their own jets need to review how they own and use their aircraft, and company directors using corporate jets should ensure that company policies are updated to ensure compliance and prevent unexpected tax bills.
Enjoying art worldwide
While many yacht owners wish to enjoy valuable artwork by bringing it on board, this has hidden risks when sailing to multiple destinations. It is important to know the tax status of both the yacht and the art – and how this will be treated by different tax authorities.
The business of art
Most art collections evolve over time and, despite the large values often involved, planning and governance around a collection can be minimal, leading to unexpected tax charges or missed tax reliefs. In some cases, the level of turnover in an art collection may mean it is considered for tax purposes as an art trade. This has different VAT implications and may mean that VAT can be reclaimed and tax deductions obtained, but along with this will come other potential tax implications together with increased reporting and compliance requirements.
Moving to the UK
Those moving to the UK to live there temporarily may qualify for the so-called “nondom” tax regime. Designed to recognise the international lives of individuals visiting and investing, the tax regime seeks only to tax non-UK wealth to the extent that it is brought to the UK (taking into account certain exemptions). However, non-dom clients should always take tax advice before bringing assets such as cars, yachts, aircraft, art and antiques into the UK as tax may be payable on these assets.
Visiting the EU
Those living outside the EU may not be required to pay tax when sailing yachts and flying aircraft into the region. “Temporary admission” relief enables owners resident in non-EU countries to “just visit” the EU without being charged VAT on the import of their asset. However, strict conditions apply, and there are many nuances within the rules, so care must be taken.
*Individual advice should always be sought
Databank
The numbers behind
The Wealth Report
Global wealth distribution
High-net-worth populations at regional, country/territory and city level
The Attitudes Survey
The hopes, fears, aspirations and investment plans of UHNWIs around the world
84 | KNIGHTFRANK.COM

vk.com/id446425943 |
|
|
|
|
|
|
|
|
|
|
|
|
|
|
|
|
|
|
|
|
|
|
|
|
|
|
||
WHERE THE WEALTHY LIVE |
|
|
|
|
|
|
|
|
|
|
|
|
|
|
|
|
|
|
|
|
|
|
|
|
Databank |
|
||
Global, regional and country/territory wealth distribution |
|
|
|
|
|
|
|
|
|
|
|
|
|
|
|
|
City-level wealth distribution |
|
|
|
||||||||
|
|
MILLIONAIRES |
|
|
%CHANGE |
|
|
UHNWIS(US$30M+) |
|
|
%CHANGE |
|
|
|
BILLIONAIRES |
|
|
%CHANGE |
|
|
|
UHNWIS |
|
%CHANGE |
|
|||
|
|
|
|
|
|
|
|
|
|
|
|
|
|
|
|
|
|
|||||||||||
|
|
|
|
|
|
|
|
|
|
|
|
|
|
|
|
|
|
|
|
|
|
|
|
|
|
|
|
|
TERRITORY |
2013 |
2017 |
2018 |
2023 |
2013–2018 |
2017–2018 |
2018–2023 |
2013 |
2017 |
2018 |
2023 |
2013–2018 |
2017–2018 |
2018–2023 |
|
2013 |
2017 |
2018 |
2023 |
2013–2018 |
2017–2018 |
2018–2023 |
COUNTRY |
CITY |
2018 |
2023 |
2018–2023 |
|
WORLD |
17,330,650 |
18,985,606 |
19,603,681 |
23,404,810 |
13% |
3% |
19% |
167,669 |
191,251 |
198,342 |
241,053 |
18% |
4% |
22% |
|
1,440 |
2,057 |
2,229 |
2,696 |
55% |
8% |
21% |
ARGENTINA |
BUENOS AIRES |
281 |
334 |
19% |
|
|
|
|
|
|
|
|
|
|
|
|
|
|
|
|
|
|
|
|
|
|
|
|
AUSTRALIA |
MELBOURNE |
519 |
626 |
21% |
|
AFRICA |
164,000 |
172,694 |
177,265 |
208,713 |
8% |
3% |
18% |
1,868 |
1,991 |
2,050 |
2,450 |
10% |
3% |
20% |
|
20 |
28 |
23 |
29 |
15% |
-18% |
26% |
AUSTRALIA |
PERTH |
318 |
385 |
21% |
|
ASIA |
4,933,277 |
5,475,383 |
5,645,171 |
6,806,689 |
14% |
3% |
21% |
40,853 |
46,661 |
48,245 |
59,116 |
18% |
3% |
23% |
|
363 |
694 |
787 |
1,003 |
117% |
13% |
27% |
AUSTRALIA |
SYDNEY |
875 |
1,054 |
20% |
|
AUSTRALASIA |
350,500 |
376,230 |
389,529 |
463,076 |
11% |
4% |
19% |
3,828 |
4,230 |
4,400 |
5,360 |
15% |
4% |
22% |
|
25 |
35 |
45 |
52 |
80% |
29% |
16% |
AUSTRIA |
VIENNA |
440 |
539 |
23% |
|
EUROPE |
5,027,747 |
5,524,792 |
5,716,306 |
6,980,398 |
14% |
3% |
22% |
58,731 |
67,867 |
70,627 |
87,400 |
20% |
4% |
24% |
|
255 |
427 |
452 |
533 |
77% |
6% |
18% |
BAHRAIN |
MANAMA |
101 |
116 |
15% |
|
LATIN AMERICA |
580,700 |
590,306 |
610,123 |
727,683 |
5% |
3% |
19% |
9,677 |
10,077 |
10,457 |
12,676 |
8% |
4% |
21% |
|
98 |
87 |
89 |
108 |
-9% |
2% |
21% |
BRAZIL |
SÃO PAULO |
1,352 |
1,426 |
5% |
|
MIDDLE EAST |
426,100 |
446,384 |
459,937 |
541,311 |
8% |
3% |
18% |
7,052 |
8,019 |
8,301 |
9,997 |
18% |
4% |
20% |
|
83 |
75 |
89 |
99 |
7% |
19% |
11% |
CANADA |
MONTREAL |
582 |
689 |
18% |
|
NORTH AMERICA |
5,653,100 |
6,208,369 |
6,403,326 |
7,430,812 |
13% |
3% |
16% |
43,626 |
50,184 |
51,912 |
61,119 |
19% |
3% |
18% |
|
471 |
604 |
631 |
736 |
34% |
4% |
17% |
CANADA |
TORONTO |
1,328 |
1,570 |
18% |
|
RUSSIA & CIS |
195,226 |
191,448 |
202,024 |
246,128 |
3% |
6% |
22% |
2,034 |
2,222 |
2,350 |
2,935 |
16% |
6% |
25% |
|
125 |
107 |
113 |
136 |
-10% |
6% |
20% |
CANADA |
VANCOUVER |
293 |
347 |
18% |
|
|
|
|
|
|
|
|
|
|
|
|
|
|
|
|
|
|
|
|
|
|
|
|
CHINA |
BEIJING |
1,673 |
2,247 |
34% |
|
ARGENTINA |
35,000 |
31,868 |
32,547 |
37,903 |
-7% |
2% |
16% |
483 |
434 |
444 |
525 |
-8% |
2% |
18% |
|
5 |
7 |
9 |
9 |
80% |
29% |
0% |
CHINA |
GUANGZHOU |
394 |
529 |
34% |
|
AUSTRALIA |
302,000 |
318,737 |
329,643 |
389,303 |
9% |
3% |
18% |
2,740 |
2,951 |
3,062 |
3,675 |
12% |
4% |
20% |
|
22 |
33 |
43 |
49 |
95% |
30% |
14% |
CHINA |
SHANGHAI |
1,263 |
1,690 |
34% |
|
AUSTRIA |
108,900 |
120,443 |
125,043 |
153,181 |
15% |
4% |
23% |
1,429 |
1,653 |
1,722 |
2,150 |
21% |
4% |
25% |
|
8 |
8 |
8 |
8 |
0% |
0% |
0% |
CHINA |
SHENZHEN |
527 |
708 |
34% |
|
BRAZIL |
194,300 |
180,531 |
179,628 |
188,674 |
-8% |
-1% |
5% |
4,122 |
3,775 |
3,754 |
3,962 |
-9% |
-1% |
6% |
|
46 |
31 |
31 |
37 |
-33% |
0% |
19% |
EGYPT |
CAIRO |
160 |
195 |
22% |
|
CANADA |
422,000 |
447,046 |
459,319 |
528,249 |
9% |
3% |
15% |
4,248 |
4,645 |
4,785 |
5,580 |
13% |
3% |
17% |
|
29 |
39 |
46 |
56 |
59% |
18% |
22% |
FRANCE |
PARIS |
1,667 |
2,031 |
22% |
|
CHINESE MAINLAND |
1,279,800 |
1,469,846 |
1,535,473 |
2,017,514 |
20% |
4% |
31% |
7,905 |
9,487 |
9,953 |
13,429 |
26% |
5% |
35% |
|
122 |
319 |
373 |
481 |
206% |
17% |
29% |
GERMANY |
BERLIN |
531 |
658 |
24% |
|
FRANCE |
555,000 |
587,977 |
610,831 |
745,324 |
10% |
4% |
22% |
3,800 |
4,320 |
4,505 |
5,605 |
19% |
4% |
24% |
|
24 |
38 |
40 |
49 |
67% |
5% |
23% |
GERMANY |
HAMBURG |
963 |
1,180 |
23% |
|
GERMANY |
1,326,200 |
1,466,121 |
1,530,348 |
1,904,069 |
15% |
4% |
24% |
11,392 |
13,401 |
14,047 |
17,854 |
23% |
5% |
27% |
|
58 |
114 |
123 |
148 |
112% |
8% |
20% |
GERMANY |
MUNICH |
1,290 |
1,607 |
25% |
|
GREECE |
66,100 |
65,757 |
65,821 |
69,869 |
0% |
0% |
6% |
721 |
703 |
704 |
751 |
-2% |
0% |
7% |
|
3 |
3 |
4 |
4 |
33% |
33% |
0% |
GREECE |
ATHENS |
292 |
313 |
7% |
|
HONG KONG |
189,234 |
213,504 |
223,223 |
280,374 |
18% |
5% |
26% |
2,469 |
2,880 |
3,010 |
3,821 |
22% |
5% |
27% |
|
40 |
72 |
64 |
77 |
60% |
-11% |
20% |
INDIA |
DELHI |
211 |
291 |
38% |
|
INDIA |
251,000 |
307,700 |
326,052 |
438,779 |
30% |
6% |
35% |
1,576 |
1,827 |
1,947 |
2,697 |
24% |
7% |
39% |
|
55 |
101 |
119 |
163 |
116% |
18% |
37% |
INDIA |
MUMBAI |
797 |
1,101 |
38% |
|
INDONESIA |
37,000 |
41,205 |
43,118 |
55,353 |
17% |
5% |
28% |
626 |
719 |
756 |
995 |
21% |
5% |
32% |
|
25 |
20 |
20 |
25 |
-20% |
0% |
25% |
INDONESIA |
JAKARTA |
401 |
529 |
32% |
|
IRELAND |
59,100 |
75,042 |
77,984 |
95,817 |
32% |
4% |
23% |
811 |
986 |
1,029 |
1,289 |
27% |
4% |
25% |
|
5 |
8 |
9 |
9 |
80% |
13% |
0% |
IRELAND |
DUBLIN |
444 |
549 |
24% |
|
ITALY |
259,000 |
273,020 |
282,580 |
337,863 |
9% |
4% |
20% |
3,650 |
3,932 |
4,083 |
4,968 |
12% |
4% |
22% |
|
23 |
42 |
43 |
53 |
87% |
2% |
23% |
ISRAEL |
TEL AVIV |
585 |
682 |
17% |
|
JAPAN |
2,150,000 |
2,292,204 |
2,326,522 |
2,558,032 |
8% |
1% |
10% |
16,450 |
18,234 |
18,534 |
20,570 |
13% |
2% |
11% |
|
22 |
33 |
35 |
40 |
59% |
6% |
14% |
ITALY |
MILAN |
253 |
302 |
19% |
|
KENYA |
8,400 |
9,176 |
9,482 |
11,584 |
13% |
3% |
22% |
110 |
121 |
125 |
155 |
14% |
3% |
24% |
|
0 |
0 |
0 |
0 |
N/A |
N/A |
N/A |
ITALY |
ROME |
1,015 |
1,198 |
18% |
|
MALAYSIA |
26,000 |
28,210 |
29,272 |
37,315 |
13% |
4% |
27% |
557 |
611 |
636 |
830 |
14% |
4% |
31% |
|
10 |
12 |
14 |
19 |
40% |
17% |
36% |
JAPAN |
TOKYO |
3,732 |
4,125 |
11% |
|
MEXICO |
145,000 |
154,409 |
158,901 |
192,393 |
10% |
3% |
21% |
2,540 |
2,692 |
2,778 |
3,427 |
9% |
3% |
23% |
|
15 |
15 |
16 |
20 |
7% |
7% |
25% |
KENYA |
NAIROBI |
82 |
102 |
24% |
|
MONACO |
10,975 |
12,069 |
12,261 |
13,494 |
12% |
2% |
10% |
200 |
219 |
223 |
247 |
12% |
2% |
11% |
|
14 |
12 |
12 |
14 |
-14% |
0% |
16% |
MALAYSIA |
KUALA LUMPUR |
376 |
496 |
32% |
|
NEW ZEALAND |
45,000 |
53,539 |
55,792 |
68,907 |
24% |
4% |
24% |
1,050 |
1,235 |
1,292 |
1,629 |
23% |
5% |
26% |
|
3 |
2 |
2 |
3 |
-33% |
0% |
50% |
MEXICO |
MEXICO CITY |
1,256 |
1,519 |
21% |
|
PHILIPPINES |
21,000 |
23,059 |
24,162 |
32,363 |
15% |
5% |
34% |
171 |
204 |
215 |
296 |
26% |
5% |
38% |
|
11 |
14 |
12 |
17 |
9% |
-14% |
42% |
NEW ZEALAND |
AUCKLAND |
669 |
839 |
25% |
|
POLAND |
28,400 |
31,848 |
33,205 |
41,760 |
17% |
4% |
26% |
487 |
563 |
589 |
757 |
21% |
5% |
29% |
|
4 |
4 |
6 |
6 |
50% |
50% |
0% |
PHILIPPINES |
MANILA |
115 |
157 |
37% |
|
ROMANIA |
19,800 |
22,639 |
23,713 |
29,935 |
20% |
5% |
26% |
172 |
204 |
215 |
278 |
25% |
5% |
29% |
|
1 |
1 |
1 |
1 |
0% |
0% |
0% |
RUSSIA |
MOSCOW |
1,021 |
1,242 |
22% |
|
RUSSIA |
159,600 |
153,959 |
163,176 |
198,524 |
2% |
6% |
22% |
1,292 |
1,407 |
1,500 |
1,861 |
16% |
7% |
24% |
|
110 |
96 |
101 |
124 |
-8% |
5% |
23% |
SAUDI ARABIA |
RIYADH |
622 |
709 |
14% |
|
SAUDI ARABIA |
48,000 |
50,348 |
51,360 |
58,510 |
7% |
2% |
14% |
851 |
929 |
950 |
1,097 |
12% |
2% |
15% |
|
8 |
10 |
10 |
10 |
25% |
0% |
0% |
SINGAPORE |
SINGAPORE |
3,598 |
4,393 |
22% |
|
SINGAPORE |
149,446 |
164,230 |
171,559 |
206,782 |
15% |
4% |
21% |
3,124 |
3,458 |
3,598 |
4,393 |
15% |
4% |
22% |
|
15 |
28 |
33 |
39 |
120% |
18% |
18% |
SOUTH AFRICA |
CAPE TOWN |
131 |
151 |
15% |
|
SOUTH AFRICA |
48,800 |
51,110 |
52,926 |
61,474 |
8% |
4% |
16% |
594 |
636 |
661 |
780 |
11% |
4% |
18% |
|
6 |
8 |
7 |
8 |
17% |
-13% |
14% |
SOUTH AFRICA |
JOHANNESBURG |
339 |
391 |
15% |
|
SOUTH KOREA |
157,000 |
177,254 |
185,257 |
234,825 |
18% |
5% |
27% |
1,565 |
1,803 |
1,893 |
2,456 |
21% |
5% |
30% |
|
24 |
38 |
44 |
56 |
83% |
16% |
27% |
SOUTH KOREA |
SEOUL |
1,594 |
2,020 |
27% |
|
SPAIN |
225,000 |
250,691 |
261,435 |
323,920 |
16% |
4% |
24% |
3,475 |
3,926 |
4,111 |
5,202 |
18% |
5% |
27% |
|
20 |
25 |
29 |
34 |
45% |
16% |
17% |
SPAIN |
MADRID |
613 |
764 |
25% |
|
SWEDEN |
170,900 |
193,094 |
200,530 |
245,127 |
17% |
4% |
22% |
3,147 |
3,669 |
3,824 |
4,767 |
22% |
4% |
25% |
|
14 |
31 |
32 |
37 |
129% |
3% |
16% |
SWEDEN |
STOCKHOLM |
559 |
689 |
23% |
|
SWITZERLAND |
297,000 |
322,245 |
331,686 |
392,959 |
12% |
3% |
18% |
4,137 |
4,619 |
4,768 |
5,743 |
15% |
3% |
20% |
|
13 |
36 |
36 |
41 |
177% |
0% |
14% |
SWITZERLAND |
GENEVA |
1,344 |
1,599 |
19% |
|
TAIWAN |
118,000 |
130,868 |
135,689 |
166,771 |
15% |
4% |
23% |
1,503 |
1,712 |
1,781 |
2,233 |
18% |
4% |
25% |
|
26 |
31 |
35 |
44 |
35% |
13% |
26% |
SWITZERLAND |
ZURICH |
1,507 |
1,796 |
19% |
|
TANZANIA |
5,700 |
6,216 |
6,429 |
7,616 |
13% |
3% |
18% |
75 |
85 |
88 |
107 |
17% |
4% |
22% |
|
0 |
1 |
1 |
2 |
N/A |
0% |
100% |
TAIWAN |
TAIPEI |
1,519 |
1,864 |
23% |
|
THAILAND |
56,000 |
61,247 |
64,131 |
80,875 |
15% |
5% |
26% |
527 |
600 |
631 |
814 |
20% |
5% |
29% |
|
10 |
20 |
30 |
34 |
200% |
50% |
13% |
TURKEY |
ISTANBUL |
991 |
1,011 |
2% |
|
TURKEY |
94,100 |
85,225 |
83,947 |
86,467 |
-11% |
-1% |
3% |
1,923 |
1,723 |
1,695 |
1,752 |
-12% |
-2% |
3% |
|
43 |
29 |
29 |
29 |
-33% |
0% |
0% |
UAE |
ABU DHABI |
192 |
223 |
16% |
|
UAE |
48,300 |
52,344 |
53,798 |
61,292 |
11% |
3% |
14% |
625 |
672 |
693 |
799 |
11% |
3% |
15% |
|
4 |
5 |
7 |
7 |
75% |
40% |
0% |
UAE |
DUBAI |
440 |
511 |
16% |
|
UGANDA |
1,500 |
1,606 |
1,639 |
1,904 |
9% |
2% |
16% |
20 |
22 |
22 |
27 |
10% |
0% |
23% |
|
0 |
0 |
0 |
0 |
N/A |
N/A |
N/A |
UK |
EDINBURGH |
125 |
150 |
20% |
|
UK |
675,100 |
735,420 |
759,354 |
905,227 |
12% |
3% |
19% |
10,149 |
12,125 |
12,559 |
15,233 |
24% |
4% |
21% |
|
37 |
54 |
54 |
67 |
46% |
0% |
24% |
UK |
LONDON |
4,944 |
6,015 |
22% |
|
US |
5,231,100 |
5,761,323 |
5,944,007 |
6,902,563 |
14% |
3% |
16% |
39,378 |
45,539 |
47,127 |
55,539 |
20% |
3% |
18% |
|
442 |
565 |
585 |
680 |
32% |
4% |
16% |
US |
LOS ANGELES |
1,075 |
1,239 |
15% |
|
VIETNAM |
10,000 |
11,786 |
12,327 |
15,776 |
23% |
5% |
28% |
110 |
135 |
142 |
186 |
29% |
5% |
31% |
|
1 |
2 |
4 |
4 |
300% |
100% |
0% |
US |
MIAMI |
253 |
296 |
17% |
|
ZAMBIA |
900 |
938 |
974 |
1,106 |
8% |
4% |
14% |
15 |
16 |
17 |
17 |
13% |
6% |
0% |
|
0 |
0 |
0 |
0 |
N/A |
N/A |
N/A |
US |
NEW YORK |
3,378 |
3,891 |
15% |
|
Data for further countries, cities and years available. Please contact siobhan.leahy@knightfrank.com |
|
|
|
|
|
|
|
|
|
|
|
|
|
|
|
|
|
Source: GlobalData WealthInsight |
|
|
|
|
||||||
|
|
|
|
|
|
|
|
|
|
|
|
|
|
|
|
|
|
|
|
|
|
|
For more information please |
|
|
|
|
|
contact info@wealthinsight.com
86 | KNIGHTFRANK.COM |
87 | KNIGHTFRANK.COM |

vk.com/id446425943
INVESTING, SPENDING AND GIVING TRENDS
The Attitudes Survey 2019
Wealth creation
ON BALANCE, HOW DID THE WEALTH OF YOUR CLIENTS CHANGE IN 2018?
% WHO CHOSE EACH OPTION |
AFRICA |
ASIA |
AUSTRALASIA |
EUROPE |
LATINAMERICA |
MIDDLEEAST |
NORTHAMERICA |
RUSSIA&CIS |
GLOBAL |
|
AVERAGE |
||||||||||
|
|
|
|
|
|
|
|
|
||
|
|
|
|
|
|
|
|
|
|
|
INCREASED |
54% |
58% |
93% |
76% |
45% |
47% |
92% |
40% |
63% |
|
NO CHANGE |
12% |
18% |
6% |
20% |
27% |
33% |
8% |
40% |
21% |
|
DECREASED |
34% |
23% |
1% |
3% |
27% |
20% |
0% |
20% |
16% |
|
ON BALANCE, HOW DO YOU THINK YOUR CLIENTS’ WEALTH IS LIKELY TO CHANGE IN 2019? |
|
|
|
|
|
|
||||
|
|
|
|
|
|
|
|
|
|
|
% WHO CHOSE EACH OPTION |
AFRICA |
ASIA |
AUSTRALASIA |
EUROPE |
LATINAMERICA |
MIDDLEEAST |
NORTHAMERICA |
RUSSIA&CIS |
GLOBAL |
|
AVERAGE |
||||||||||
|
|
|
|
|
|
|
|
|
||
|
|
|
|
|
|
|
|
|
|
|
INCREASE |
68% |
64% |
72% |
64% |
45% |
50% |
81% |
65% |
64% |
|
NO CHANGE |
15% |
18% |
24% |
25% |
55% |
33% |
5% |
20% |
25% |
|
DECREASE |
17% |
18% |
4% |
11% |
0% |
17% |
14% |
15% |
12% |
|
DID THE POLITICAL AND ECONOMIC ENVIRONMENT WITHIN THEIR COUNTRY OF RESIDENCE AND GLOBALLY MAKE IT MORE DIFFICULT FOR YOUR CLIENTS TO CREATE AND PROTECT WEALTH IN 2018 COMPARED WITH 2017? |
||||||||||
|
|
|
|
|
|
|
|
|
|
|
% OF RESPONDENTS |
AFRICA |
ASIA |
AUSTRALASIA |
EUROPE |
LATINAMERICA |
MIDDLEEAST |
NORTHAMERICA |
RUSSIA&CIS |
GLOBAL |
|
WHO SAID YES |
AVERAGE |
|||||||||
|
|
|
|
|
|
|
|
|||
|
|
|
|
|
|
|
|
|
|
|
WITHIN THEIR COUNTRY |
92% |
71% |
63% |
64% |
64% |
66% |
62% |
80% |
70% |
|
OF RESIDENCE |
||||||||||
GLOBALLY |
66% |
69% |
51% |
48% |
45% |
59% |
59% |
70% |
58% |
|
DO YOU THINK THE POLITICAL AND ECONOMIC ENVIRONMENT WITHIN THEIR COUNTRY OF RESIDENCE AND GLOBALLY WILL MAKE IT MORE DIFFICULT FOR YOUR CLIENTS TO CREATE AND PROTECT WEALTH IN 2019?
% OF RESPONDENTS AFRICA ASIA AUSTRALASIA EUROPE LATINAMERICA MIDDLEEAST NORTHAMERICA RUSSIA&CIS
WHO SAID YES
WITHIN THEIR COUNTRY |
66% |
65% |
76% |
65% |
64% |
72% |
59% |
80% |
68% |
OF RESIDENCE |
|||||||||
GLOBALLY |
58% |
69% |
70% |
56% |
55% |
59% |
62% |
65% |
62% |
Investment trends
ON BALANCE, HOW HAS YOUR CLIENTS’ ATTITUDE TO INVESTMENT RISK CHANGED OVER THE PAST 12 MONTHS?
|
AFRICA |
ASIA |
AUSTRALASIA |
EUROPE |
LATINAMERICA |
MIDDLEEAST |
NORTHAMERICA |
RUSSIA&CIS |
GLOBAL |
|
AVERAGE |
||||||||
|
|
|
|
|
|
|
|
|
|
|
|
|
|
|
|
|
|
|
|
BECOME LESS RISK AVERSE |
22% |
42% |
30% |
23% |
40% |
29% |
26% |
21% |
29% |
NO CHANGE |
20% |
19% |
36% |
38% |
20% |
32% |
32% |
37% |
29% |
BECOME MORE RISK AVERSE |
57% |
39% |
34% |
38% |
40% |
39% |
41% |
42% |
42% |
|
|
|
|
|
|||||
HOW PREPARED ARE GOVERNMENTS AND CENTRAL BANKS AROUND THE WORLD FOR A FINANCIAL CRISIS COMPARED WITH 10 YEARS AGO? |
|
|
|
|
|||||
|
|
|
|
|
|
|
|
|
|
|
AFRICA |
ASIA |
AUSTRALASIA |
EUROPE |
LATINAMERICA |
MIDDLEEAST |
NORTHAMERICA |
RUSSIA&CIS |
GLOBAL |
|
AVERAGE |
||||||||
|
|
|
|
|
|
|
|
|
|
|
|
|
|
|
|
|
|
|
|
MORE PREPARED |
67% |
70% |
81% |
67% |
60% |
78% |
68% |
63% |
69% |
NO CHANGE |
7% |
15% |
6% |
21% |
30% |
11% |
26% |
32% |
19% |
LESS PREPARED |
26% |
15% |
13% |
12% |
10% |
11% |
6% |
5% |
12% |
|
|
|
|
|
|||||
ON AVERAGE, WHAT % OF YOUR CLIENTS’ INVESTMENT PORTFOLIOS IS ALLOCATED TO THE FOLLOWING ASSET CLASSES? |
|
|
|
|
|||||
|
|
|
|
|
|
|
|
|
|
|
AFRICA |
ASIA |
AUSTRALASIA |
EUROPE |
LATINAMERICA |
MIDDLEEAST |
NORTHAMERICA |
RUSSIA&CIS |
GLOBAL |
|
AVERAGE |
||||||||
|
|
|
|
|
|
|
|
|
|
|
|
|
|
|
|
|
|
|
|
EQUITIES |
30% |
25% |
35% |
28% |
12% |
25% |
40% |
16% |
27% |
PROPERTY |
22% |
23% |
22% |
27% |
17% |
22% |
17% |
20% |
21% |
(OWNED AS AN INVESTMENT) |
|||||||||
BONDS |
14% |
24% |
19% |
14% |
22% |
19% |
18% |
27% |
20% |
CASH |
24% |
18% |
16% |
12% |
16% |
14% |
9% |
26% |
17% |
PRIVATE EQUITY |
4% |
4% |
4% |
10% |
9% |
10% |
12% |
7% |
7% |
LUXURY INVESTMENTS |
3% |
2% |
2% |
5% |
11% |
3% |
1% |
3% |
4% |
(ART, WINE, CARS, ETC) |
|||||||||
GOLD |
1% |
3% |
1% |
2% |
8% |
1% |
1% |
1% |
2% |
OTHER |
2% |
1% |
1% |
2% |
6% |
3% |
0% |
1% |
2% |
The Attitudes Survey is based on responses from 600 private bankers and wealth advisers managing over US$3 trillion of wealth for UHNWI clients. The survey was taken during October and November 2018
Databank
ON BALANCE, HOW DID YOUR CLIENTS’ ALLOCATION TO THE FOLLOWING ASSET CLASSES CHANGE IN 2018?*
|
|
AFRICA |
ASIA |
AUSTRALASIA |
EUROPE |
LATINAMERICA |
MIDDLEEAST |
NORTHAMERICA |
RUSSIA&CIS |
GLOBAL |
|
|
AVERAGE |
||||||||
|
|
|
|
|
|
|
|
|
|
|
|
|
|
|
|
|
|
|
|
|
|
CASH |
52% |
56% |
59% |
39% |
50% |
50% |
44% |
12% |
45% |
|
PROPERTY |
4% |
14% |
0% |
19% |
50% |
21% |
31% |
29% |
21% |
|
(OWNED AS AN INVESTMENT) |
||||||||||
PRIVATE EQUITY |
-7% |
4% |
30% |
21% |
-13% |
29% |
31% |
12% |
14% |
|
LUXURY INVESTMENTS |
-9% |
1% |
0% |
17% |
13% |
4% |
6% |
6% |
5% |
|
(ART, WINE, CARS, ETC) |
|
|
|
|
|
|
|
|
|
|
GOLD |
-11% |
12% |
3% |
-1% |
0% |
13% |
3% |
6% |
3% |
|
BONDS |
28% |
-8% |
-11% |
-23% |
-25% |
-16% |
-19% |
41% |
-4% |
|
EQUITIES |
-35% |
-25% |
8% |
5% |
-13% |
4% |
-9% |
6% |
-7% |
|
*= Difference between those reporting an increase and those reporting a decrease |
|
|
|
|
|
|
|
|||
|
|
|
|
|
|
|||||
HOW DO YOU EXPECT YOUR CLIENTS’ ALLOCATION TO THE FOLLOWING ASSET CLASSES TO CHANGE IN 2019?* |
|
|
|
|
|
|||||
|
|
|
|
|
|
|
|
|
|
|
|
|
AFRICA |
ASIA |
AUSTRALASIA |
EUROPE |
LATINAMERICA |
MIDDLEEAST |
NORTHAMERICA |
RUSSIA&CIS |
GLOBAL |
|
|
AVERAGE |
||||||||
|
|
|
|
|
|
|
|
|
|
|
|
|
|
|
|
|
|
|
|
|
|
CASH |
28% |
36% |
37% |
25% |
38% |
13% |
41% |
0% |
27% |
|
PROPERTY |
35% |
8% |
-14% |
13% |
38% |
38% |
25% |
24% |
21% |
|
(OWNED AS AN INVESTMENT) |
||||||||||
PRIVATE EQUITY |
22% |
14% |
30% |
28% |
13% |
24% |
22% |
6% |
20% |
|
BONDS |
41% |
16% |
35% |
-8% |
-38% |
21% |
28% |
41% |
17% |
|
GOLD |
7% |
20% |
19% |
13% |
25% |
8% |
13% |
12% |
15% |
|
LUXURY INVESTMENTS |
2% |
5% |
-3% |
21% |
13% |
0% |
6% |
-12% |
4% |
|
(ART, WINE, CARS, ETC) |
|
|
|
|
|
|
|
|
|
|
EQUITIES |
22% |
4% |
-37% |
-19% |
-25% |
-21% |
-50% |
47% |
-10% |
|
*= Difference between those reporting an increase and those reporting a decrease |
|
|
|
|
|
|
|
|||
WHAT % OF YOUR CLIENTS HAVE A ROBUST SUCCESSION PLAN IN PLACE TO PASS THEIR WEALTH TO THE NEXT GENERATION? |
|
|
|
|
||||||
|
|
|
|
|
|
|
|
|
|
|
|
|
AFRICA |
ASIA |
AUSTRALASIA |
EUROPE |
LATINAMERICA |
MIDDLEEAST |
NORTHAMERICA |
RUSSIA&CIS |
GLOBAL |
|
|
AVERAGE |
||||||||
|
|
|
|
|
|
|
|
|
|
|
|
|
|
|
|
|
|
|
|
|
|
|
|
52% |
46% |
51% |
57% |
55% |
55% |
56% |
32% |
51% |
UHNWI mobility |
|
|
|
|
|
|
|
|
|
|
WHAT % OF YOUR CLIENTS HAVE A SECOND PASSPORT OR DUAL NATIONALITY? |
|
|
|
|
|
|
|
|||
|
|
|
|
|
|
|
|
|
|
|
|
|
AFRICA |
ASIA |
AUSTRALASIA |
EUROPE |
LATINAMERICA |
MIDDLEEAST |
NORTHAMERICA |
RUSSIA&CIS |
GLOBAL |
|
|
|
|
|
|
|
|
|
|
AVERAGE |
|
|
|
|
|
|
|
|
|
|
|
|
|
29% |
26% |
24% |
32% |
71% |
41% |
30% |
39% |
36% |
WHAT % OF YOUR CLIENTS ARE CONSIDERING ACQUIRING A SECOND PASSPORT/DUAL NATIONALITY? |
|
|
|
|
|
|
||||
|
|
|
|
|
|
|
|
|
|
|
|
|
AFRICA |
ASIA |
AUSTRALASIA |
EUROPE |
LATINAMERICA |
MIDDLEEAST |
NORTHAMERICA |
RUSSIA&CIS |
GLOBAL |
|
|
|
|
|
|
|
|
|
|
AVERAGE |
|
|
|
|
|
|
|
|
|
|
|
|
|
32% |
27% |
8% |
21% |
54% |
29% |
22% |
42% |
29% |
WHAT % OF YOUR CLIENTS ARE CONSIDERING EMIGRATING PERMANENTLY TO ANOTHER COUNTRY? |
|
|
|
|
|
|
||||
|
|
|
|
|
|
|
|
|
|
|
|
|
AFRICA |
ASIA |
AUSTRALASIA |
EUROPE |
LATINAMERICA |
MIDDLEEAST |
NORTHAMERICA |
RUSSIA&CIS |
GLOBAL |
|
|
|
|
|
|
|
|
|
|
AVERAGE |
|
|
|
|
|
|
|
|
|
|
|
|
|
23% |
25% |
6% |
21% |
65% |
24% |
17% |
31% |
26% |
WHERE ARE THOSE CONSIDERING EMIGRATING MOST LIKELY TO MOVE TO? (TOP FIVE DESTINATIONS) |
|
|
|
|
|
|
||||
|
|
|
|
|
|
|
|
|
|
|
|
|
AFRICA |
ASIA |
AUSTRALASIA |
EUROPE |
LATINAMERICA |
MIDDLEEAST |
NORTHAMERICA |
RUSSIA&CIS |
GLOBAL |
|
|
AVERAGE |
||||||||
|
|
|
|
|
|
|
|
|
|
|
|
|
|
|
|
|
|
|
|
|
|
1 |
|
UK |
Australia |
Australia |
Switzerland |
Spain |
UK |
US |
US |
US |
2 |
|
Australia |
Canada |
US |
US |
US |
Canada |
Caribbean |
Spain |
UK |
3 |
|
Canada |
US |
UK |
Portugal |
Switzerland |
US |
Canada |
UK |
Canada |
4 |
|
US |
Singapore |
Singapore |
Monaco |
Caribbean |
UAE |
UK |
Switzerland |
Australia |
5 |
|
New Zealand |
UK |
New Zealand |
France |
Canada |
Switzerland |
Switzerland |
Germany |
Switzerland |
88 | KNIGHTFRANK.COM |
89 | KNIGHTFRANK.COM |

vk.com/id446425943 |
|
|
|
|
|
|
|
|
|||
INVESTING, SPENDING AND GIVING TRENDS |
|
|
|
|
|
|
|
||||
Residential property |
|
|
|
|
|
|
|
|
|
||
|
WHAT % OF YOUR CLIENTS’ TOTAL WEALTH IS ALLOCATED TO THE PROPERTIES THEY LIVE IN (FIRST AND SECOND HOMES)? |
|
|
|
|
||||||
|
|
|
|
|
|
|
|
|
|
|
|
|
|
|
AFRICA |
ASIA |
AUSTRALASIA |
EUROPE |
LATINAMERICA |
MIDDLEEAST |
NORTHAMERICA |
RUSSIA&CIS |
GLOBAL |
|
|
|
|
|
|
|
|
|
|
|
AVERAGE |
|
|
|
|
|
|
|
|
|
|
|
|
|
|
|
41% |
39% |
37% |
27% |
38% |
21% |
31% |
23% |
32% |
|
HOW MANY RESIDENCES (INCLUDING THEIR PRIMARY RESIDENCE) DO THEY HAVE ON AVERAGE? |
|
|
|
|
|
|
||||
|
|
|
|
|
|
|
|
|
|
|
|
|
|
|
AFRICA |
ASIA |
AUSTRALASIA |
EUROPE |
LATINAMERICA |
MIDDLEEAST |
NORTHAMERICA |
RUSSIA&CIS |
GLOBAL |
|
|
|
|
|
|
|
|
|
|
|
AVERAGE |
|
|
|
|
|
|
|
|
|
|
|
|
|
|
|
3.40 |
3.92 |
2.71 |
3.35 |
4.71 |
4.63 |
3.17 |
3.13 |
3.63 |
|
WHAT % HAVE SECOND HOMES OUTSIDE THEIR MAIN COUNTRY OF RESIDENCE? |
|
|
|
|
|
|
||||
|
|
|
|
|
|
|
|
|
|
|
|
|
|
|
AFRICA |
ASIA |
AUSTRALASIA |
EUROPE |
LATINAMERICA |
MIDDLEEAST |
NORTHAMERICA |
RUSSIA&CIS |
GLOBAL |
|
|
|
|
|
|
|
|
|
|
|
AVERAGE |
|
|
|
|
|
|
|
|
|
|
|
|
|
|
|
17% |
35% |
15% |
49% |
65% |
74% |
35% |
46% |
42% |
|
WHAT % OF YOUR CLIENTS BOUGHT A NEW HOME IN THEIR COUNTRY OF RESIDENCE IN 2018? |
|
|
|
|
|
|
||||
|
|
|
|
|
|
|
|
|
|
|
|
|
|
|
AFRICA |
ASIA |
AUSTRALASIA |
EUROPE |
LATINAMERICA |
MIDDLEEAST |
NORTHAMERICA |
RUSSIA&CIS |
GLOBAL |
|
|
|
|
|
|
|
|
|
|
|
AVERAGE |
|
|
|
|
|
|
|
|
|
|
|
|
|
|
|
15% |
27% |
16% |
15% |
38% |
15% |
14% |
16% |
19% |
|
WHAT % OF YOUR CLIENTS BOUGHT A NEW HOME OUTSIDE THEIR COUNTRY OF RESIDENCE IN 2018? |
|
|
|
|
|
|
||||
|
|
|
|
|
|
|
|
|
|
|
|
|
|
|
AFRICA |
ASIA |
AUSTRALASIA |
EUROPE |
LATINAMERICA |
MIDDLEEAST |
NORTHAMERICA |
RUSSIA&CIS |
GLOBAL |
|
|
|
|
|
|
|
|
|
|
|
AVERAGE |
|
|
|
|
|
|
|
|
|
|
|
|
|
|
|
10% |
23% |
6% |
20% |
62% |
27% |
12% |
19% |
22% |
|
WHAT % OF YOUR CLIENTS ARE PLANNING TO BUY A NEW HOME IN THEIR COUNTRY OF RESIDENCE IN 2019/20? |
|
|
|
|
|
|||||
|
|
|
|
|
|
|
|
|
|
|
|
|
|
|
AFRICA |
ASIA |
AUSTRALASIA |
EUROPE |
LATINAMERICA |
MIDDLEEAST |
NORTHAMERICA |
RUSSIA&CIS |
GLOBAL |
|
|
|
|
|
|
|
|
|
|
|
AVERAGE |
|
|
|
|
|
|
|
|
|
|
|
|
|
|
|
17% |
26% |
15% |
15% |
23% |
13% |
14% |
16% |
18% |
|
WHAT % OF YOUR CLIENTS ARE PLANNING TO BUY A NEW HOME OUTSIDE THEIR COUNTRY OF RESIDENCE IN 2019/20? |
|
|
|
|
|
|||||
|
|
|
|
|
|
|
|
|
|
|
|
|
|
|
AFRICA |
ASIA |
AUSTRALASIA |
EUROPE |
LATINAMERICA |
MIDDLEEAST |
NORTHAMERICA |
RUSSIA&CIS |
GLOBAL |
|
|
|
|
|
|
|
|
|
|
|
AVERAGE |
|
|
|
|
|
|
|
|
|
|
|
|
|
|
|
11% |
25% |
4% |
21% |
56% |
27% |
11% |
23% |
22% |
|
IN WHICH COUNTRIES OR TERRITORIES ARE THOSE PLANNING A PURCHASE MOST LIKELY TO BUY? (TOP FIVE DESTINATIONS) |
|
|
|
|
||||||
|
|
|
|
|
|
|
|
|
|
|
|
|
|
|
AFRICA |
ASIA |
AUSTRALASIA |
EUROPE |
LATINAMERICA |
MIDDLEEAST |
NORTHAMERICA |
RUSSIA&CIS |
GLOBAL |
|
|
|
AVERAGE |
||||||||
|
|
|
|
|
|
|
|
|
|
|
|
|
|
|
|
|
|
|
|
|
|
|
|
1 |
|
UK |
Australia |
Australia |
France |
Spain |
UK |
US |
Spain |
US |
|
2 |
|
Australia |
UK |
UK |
Spain |
US |
US |
Canada |
France |
UK |
|
3 |
|
US |
Canada |
New Zealand |
US |
Caribbean |
France |
Mexico |
US |
Australia |
|
4 |
|
Canada |
US |
US |
UK |
France |
UAE |
Caribbean |
UK |
Spain |
|
5 |
|
Mauritius |
Singapore |
France |
Switzerland |
Switzerland |
Switzerland |
Spain |
Switzerland |
Canada |
|
Property investments |
|
|
|
|
|
|
|
|
|
||
|
WHAT % OF YOUR CLIENTS HAVE PROPERTY INVESTMENTS (EXCLUDING FIRST AND SECOND HOMES) IN THEIR COUNTRY OF RESIDENCE? |
|
|
|
|
||||||
|
|
|
|
|
|
|
|
|
|
|
|
|
|
|
AFRICA |
ASIA |
AUSTRALASIA |
EUROPE |
LATINAMERICA |
MIDDLEEAST |
NORTHAMERICA |
RUSSIA&CIS |
GLOBAL |
|
|
|
|
|
|
|
|
|
|
|
AVERAGE |
|
|
|
|
|
|
|
|
|
|
|
|
|
|
|
40% |
53% |
63% |
53% |
57% |
63% |
56% |
33% |
52% |
|
WHAT % OF YOUR CLIENTS HAVE PROPERTY INVESTMENTS (EXCLUDING FIRST AND SECOND HOMES) OUTSIDE THEIR COUNTRY OF RESIDENCE? |
|
|
|
|
||||||
|
|
|
|
|
|
|
|
|
|
|
|
|
|
|
AFRICA |
ASIA |
AUSTRALASIA |
EUROPE |
LATINAMERICA |
MIDDLEEAST |
NORTHAMERICA |
RUSSIA&CIS |
GLOBAL |
|
|
|
|
|
|
|
|
|
|
|
AVERAGE |
|
|
|
|
|
|
|
|
|
|
|
|
|
|
|
19% |
32% |
18% |
34% |
69% |
55% |
22% |
19% |
33% |
|
WHAT % OF YOUR CLIENTS INVESTED IN PROPERTY (EXCLUDING FIRST AND SECOND HOMES) IN THEIR COUNTRY OF RESIDENCE IN 2018? |
|
|
|
|
||||||
|
|
|
|
|
|
|
|
|
|
|
|
|
|
|
AFRICA |
ASIA |
AUSTRALASIA |
EUROPE |
LATINAMERICA |
MIDDLEEAST |
NORTHAMERICA |
RUSSIA&CIS |
GLOBAL |
|
|
|
|
|
|
|
|
|
|
|
AVERAGE |
|
|
|
|
|
|
|
|
|
|
|
|
|
|
|
20% |
34% |
27% |
25% |
30% |
20% |
25% |
13% |
24% |
|
|
|
|
|
|
|
|
|
Databank |
WHAT % OF YOUR CLIENTS INVESTED IN PROPERTY (EXCLUDING FIRST AND SECOND HOMES) OUTSIDE THEIR COUNTRY OF RESIDENCE IN 2018? |
|
|
|
|
|||||
|
|
|
|
|
|
|
|
|
|
|
AFRICA |
ASIA |
AUSTRALASIA |
EUROPE |
LATINAMERICA |
MIDDLEEAST |
NORTHAMERICA |
RUSSIA&CIS |
GLOBAL |
|
|
|
|
|
|
|
|
|
AVERAGE |
|
|
|
|
|
|
|
|
|
|
|
14% |
24% |
9% |
18% |
59% |
42% |
13% |
17% |
25% |
WHAT % OF YOUR CLIENTS ARE PLANNING TO INVEST IN PROPERTY (EXCLUDING FIRST AND SECOND HOMES) IN THEIR COUNTRY OF RESIDENCE IN 2019/20? |
|
|
|
||||||
|
|
|
|
|
|
|
|
|
|
|
AFRICA |
ASIA |
AUSTRALASIA |
EUROPE |
LATINAMERICA |
MIDDLEEAST |
NORTHAMERICA |
RUSSIA&CIS |
GLOBAL |
|
|
|
|
|
|
|
|
|
AVERAGE |
|
|
|
|
|
|
|
|
|
|
|
23% |
33% |
25% |
27% |
17% |
21% |
20% |
18% |
23% |
WHAT % OF YOUR CLIENTS ARE PLANNING TO INVEST IN PROPERTY (EXCLUDING FIRST AND SECOND HOMES) OUTSIDE THEIR COUNTRY OF RESIDENCE IN 2019/20? |
|
|
|||||||
|
|
|
|
|
|
|
|
|
|
|
AFRICA |
ASIA |
AUSTRALASIA |
EUROPE |
LATINAMERICA |
MIDDLEEAST |
NORTHAMERICA |
RUSSIA&CIS |
GLOBAL |
|
|
|
|
|
|
|
|
|
AVERAGE |
|
|
|
|
|
|
|
|
|
|
|
17% |
27% |
10% |
24% |
61% |
46% |
12% |
19% |
27% |
IN WHICH COUNTRIES ARE THEY MOST LIKELY TO INVEST? (TOP FIVE DESTINATIONS) |
|
|
|
|
|
|
|||
|
|
|
|
|
|
|
|
|
|
|
AFRICA |
ASIA |
AUSTRALASIA |
EUROPE |
LATINAMERICA |
MIDDLEEAST |
NORTHAMERICA |
RUSSIA&CIS |
GLOBAL |
|
AVERAGE |
||||||||
|
|
|
|
|
|
|
|
|
|
|
|
|
|
|
|
|
|
|
|
1 |
UK |
Australia |
Australia |
US |
US |
UK |
US |
France |
US |
2 |
Australia |
US |
UK |
France |
Spain |
US |
Canada |
US |
UK |
3 |
US |
UK |
US |
UK |
Caribbean |
UAE |
Caribbean |
UK |
Spain |
4 |
Canada |
Canada |
New Zealand |
Spain |
France |
France |
Australia |
Spain |
Australia |
5 |
Mauritius |
Singapore |
Canada |
Italy |
Italy |
Canada |
Italy |
Switzerland |
France |
Philanthropy, investments of passion and education
HOW HAVE YOUR CLIENTS’ PHILANTHROPIC ACTIVITIES CHANGED IN 2018?
|
AFRICA |
ASIA |
AUSTRALASIA |
EUROPE |
LATINAMERICA |
MIDDLEEAST |
NORTHAMERICA |
RUSSIA&CIS |
GLOBAL |
|
|
AVERAGE |
|||||||||
|
|
|
|
|
|
|
|
|
||
|
|
|
|
|
|
|
|
|
|
|
INCREASED |
12% |
28% |
53% |
29% |
20% |
33% |
44% |
14% |
29% |
|
NO CHANGE |
64% |
61% |
47% |
66% |
60% |
62% |
44% |
50% |
57% |
|
DECREASED |
24% |
11% |
0% |
5% |
20% |
5% |
12% |
36% |
14% |
|
WHAT % OF YOUR CLIENTS ACTIVELY COLLECT AN INVESTMENT OF PASSION SUCH AS ART, WINE OR CLASSIC CARS? |
|
|
|
|
|
|||||
|
|
|
|
|
|
|
|
|
|
|
|
AFRICA |
ASIA |
AUSTRALASIA |
EUROPE |
LATINAMERICA |
MIDDLEEAST |
NORTHAMERICA |
RUSSIA&CIS |
GLOBAL |
|
|
|
|
|
|
|
|
|
|
AVERAGE |
|
|
|
|
|
|
|
|
|
|
|
|
|
18% |
25% |
31% |
33% |
37% |
26% |
25% |
30% |
28% |
|
ARE MORE OF YOUR CLIENTS STARTING TO COLLECT INVESTMENTS OF PASSION? |
|
|
|
|
|
|
||||
|
|
|
|
|
|
|
|
|
|
|
|
AFRICA |
ASIA |
AUSTRALASIA |
EUROPE |
LATINAMERICA |
MIDDLEEAST |
NORTHAMERICA |
RUSSIA&CIS |
GLOBAL |
|
|
AVERAGE |
|||||||||
|
|
|
|
|
|
|
|
|
||
|
|
|
|
|
|
|
|
|
|
|
YES |
29% |
39% |
40% |
44% |
60% |
29% |
24% |
50% |
39% |
|
NO |
71% |
62% |
60% |
56% |
40% |
71% |
76% |
50% |
61% |
|
WHICH INVESTMENTS OF PASSION DO THEY MOST COMMONLY COLLECT? (TOP FIVE CHOICES) |
|
|
|
|
|
|
||||
|
|
|
|
|
|
|
|
|
|
|
|
AFRICA |
ASIA |
AUSTRALASIA |
EUROPE |
LATINAMERICA |
MIDDLEEAST |
NORTHAMERICA |
RUSSIA&CIS |
GLOBAL |
|
|
AVERAGE |
|||||||||
|
|
|
|
|
|
|
|
|
||
|
|
|
|
|
|
|
|
|
|
|
1 |
Cars |
Art |
Art |
Art |
Art |
Watches |
Art |
Art |
Art |
|
2 |
Art |
Watches |
Cars |
Cars |
Wine |
Art |
Cars |
Cars |
Cars |
|
3 |
Watches |
Cars |
Wine |
Wine |
Watches |
Cars |
Wine |
Watches |
Watches |
|
4 |
Wine |
Jewellery |
Watches |
Watches |
Cars |
Wine |
Watches |
Jewellery |
Wine |
|
5 |
Jewellery |
Wine |
Jewellery |
Jewellery |
Jewellery |
Jewellery |
Jewellery |
Wine |
Jewellery |
|
WHAT % OF YOUR CLIENTS SEND THEIR CHILDREN OVERSEAS FOR THEIR EDUCATION? |
|
|
|
|
|
|
||||
|
|
|
|
|
|
|
|
|
|
|
|
AFRICA |
ASIA |
AUSTRALASIA |
EUROPE |
LATINAMERICA |
MIDDLEEAST |
NORTHAMERICA |
RUSSIA&CIS |
GLOBAL |
|
|
AVERAGE |
|||||||||
|
|
|
|
|
|
|
|
|
||
|
|
|
|
|
|
|
|
|
|
|
SCHOOL |
34% |
46% |
8% |
20% |
48% |
49% |
13% |
31% |
31% |
|
UNIVERSITY |
50% |
64% |
17% |
31% |
85% |
74% |
17% |
47% |
48% |
|
DO YOU EXPECT THIS % TO INCREASE OVER THE NEXT FEW YEARS? |
|
|
|
|
|
|
|
|||
|
|
|
|
|
|
|
|
|
|
|
% OF RESPONDENTS |
AFRICA |
ASIA |
AUSTRALASIA |
EUROPE |
LATINAMERICA |
MIDDLEEAST |
NORTHAMERICA |
RUSSIA&CIS |
GLOBAL |
|
WHO SAID YES |
AVERAGE |
|||||||||
|
|
|
|
|
|
|
|
|||
|
|
|
|
|
|
|
|
|
|
|
SCHOOL |
86% |
84% |
13% |
40% |
80% |
70% |
28% |
86% |
61% |
|
UNIVERSITY |
95% |
84% |
32% |
51% |
60% |
80% |
28% |
79% |
64% |
|
90 | KNIGHTFRANK.COM |
91 | KNIGHTFRANK.COM |

vk.com/id446425943
LETTER FROM THE EDITOR
A wider horizon
ANDREW SHIRLEY
EDITOR, THE WEALTH REPORT
|
|
|
|
|
F |
or those of you who, like me, |
This year has been no exception. I’ve been |
ever more crucial to fill the policy vacuum |
|
|
|
|||
|
|
tend to start reading their maga- |
lucky enough to visit some amazing places |
left by governments around the world that |
|
|
zinesfromtheback,welcome.For |
and interview some incredible visionaries |
seem increasingly unable to cope with the |
|
|
those who prefer to adopt a more |
who are using their wealth to make the world |
demands of their citizens. |
|
conventionalapproach,thankyouformaking |
a better place for future generations. People |
To put things into perspective, on the same |
|
|
it through to the end. |
like Jochen Zeitz, Sir Richard Branson and |
evening (15 January 2019) as politicians in |
|
|
I won’t use this note to summarise our key |
Dr Lisbet Rausing to name just three. |
Westminster were gathering for the vote that |
|
|
findings – my colleague Liam Bailey hasdone |
But it was my visit to Samara, a conserva- |
saw Prime Minister Theresa May’s Brexit deal |
|
|
an excellent job of that on pages 4 and 5 – but |
tion reserve in South Africa owned by the |
defeated by an unpredecedented margin, |
|
|
rather to share a few thoughts that have |
Tompkins family, with my son that really |
I received confirmation that my colleagues |
|
|
come to me as we’ve been putting this edition |
emphasised the invaluable role that private |
in Nairobi were all safe following the latest |
|
|
of the report together. |
individuals and their families can play. As |
lethal terrorist attack, this time on a hotel |
|
|
Editing The Wealth Report over the past |
you can read on page 66, the family has |
close to where I spoke at a launch event for |
|
|
11 years has undoubtedly been the highlight |
worked tirelessly and passionately to rewild |
The Wealth Report last year. |
|
|
of my time at Knight Frank. First, because |
a vast swathe of the Karoo region, provide |
An uncomfortable thought, perhaps, but |
|
|
the feedback we get from our readers and |
employment for the local community and |
one that highlights the need for a glob- |
|
|
teams around the world suggests that they |
educate visitors from across the globe about |
al perspective when looking at the issues |
|
|
find it incredibly useful, which is always |
the value of the environment. |
that affect wealth creation and the impact |
|
|
gratifying. And second because, without |
As leading political risk analyst Dr Ian |
wealth has on economic outcomes for all of |
|
|
fail, the process of compiling every edition |
Bremmer points out on page 16, this role, |
us. I hope you feel that The Wealth Report |
|
|
has given me a broader perspective on the |
whether it covers the environment or any |
delivers that perspective. It would be great |
|
|
big issues facing us all. |
other issues facing society, will become |
to hear your thoughts. |
|
The Wealth Report is just one of a series of publications and reports published by Knight Frank throughout the year.
Subscribe at the URL below to receive our publications, either by email or post:
knightfrank.com/publications
For interactive data and more information on The Wealth Report, please follow us on:
@ knightfrank |
@knightfrank |
/KnightFrankLLP |
Important notice
SENIOR PARTNER AND GROUP CHAIRMAN
Alistair Elliott +44 20 7861 1141 alistair.elliott@knightfrank.com
PRIVATE OFFICE
Rory Penn +44 20 7861 1150 rory.penn@knightfrank.com
COMMERCIAL PROPERTY ENQUIRIES
Alex James +44 20 3967 7118 alex.james@knightfrank.com
GLOBAL PROPERTY SERVICES
Lord Andrew Hay Residential +44 20 7861 1071
andrew.hay@knightfrank.com
Andrew Sim Capital Markets +44 20 7861 1193
andrew.sim@knightfrank.com
William Beardmore-Gray Occupier Services & Commercial Agency +44 20 7861 1308 william.beardmore-gray@knightfrank.com
Rupert Johnson Valuation & Advisory +44 20 7861 1284
rupert.johnson@knightfrank.com
The Wealth Report (© Knight Frank LLP 2019) is produced for general interest only; it is not definitive and is not intended to give advice. It must not be relied upon in any way. Although we believe that high standards have been used in the preparation of the information, analysis and views presented in The Wealth Report, no responsibility or liability whatsoever can be accepted by Knight Frank for the contents. We make no express or implied warranty or guarantee of the accuracy of any of the contents. As far as applicable laws allow, we do not accept responsibility for errors, inaccuracies or omissions, nor for loss or damage that may result directly or indirectly from reliance on or use of its contents. The Wealth Report does not necessarily reflect the view of Knight Frank in any respect. Information may have been provided by others without verification. Readers should not take or omit to take any action as a result of information in The Wealth Report. Reproduction of this report in whole or in part is not permitted without the prior written approval of Knight Frank LLP. In preparing The Wealth Report, Knight Frank does not imply or establish any client, advisory, financial or professional relationship. Through The Wealth Report, neither Knight Frank nor any other person is providing advisory, financial or other services. In particular, Knight Frank LLP is not authorised by the Financial Services Authority to undertake regulated activities (other than limited insurance intermediation activity in connection with property management). Knight Frank LLP also trades as Knight Frank. Knight Frank LLP is a limited liability partnership registered in England with registered number OC305934. Our registered office is 55 Baker Street, London, W1U 8AN, where you may look at a list of members’ names. The Wealth Report is compiled from information contributed by various sources including Knight Frank LLP, its direct UK subsidiaries and a network of separate and independent overseas entities or practices offering property services. Together these are generally known as “the Knight Frank global network”. Each entity or practice in the Knight Frank global network is a distinct and separate legal entity. Its ownership and management is distinct from that of any other entity or practice, whether operating under the name Knight Frank or otherwise. In any event, no entity or practice operating under the name Knight Frank (including Knight Frank LLP) is liable for the acts or omissions of any other entity or practice. Nor does it act as an agent for or have any authority (whether actual, apparent, implied or otherwise) to represent, bind or oblige in any way any other entity or practice that operates under the name Knight Frank (including Knight Frank LLP). Where applicable, references to Knight Frank include the Knight Frank global network.
92 | KNIGHTFRANK.COM
vk.com/id446425943
Computer generated image for indicative purposes only
One Blackfriars, London
KNIGHT FRANK GLOBAL WEALTH ADVISORY
Helping you navigate the world’s prime property markets
Knight Frank’s Global Wealth Advisory team leverages market-leading research and best-in-class advice to provide exceptional service to our global private clients
Connecting people & property, perfectly.
knightfrank.com
vk.com/id446425943
Russia
Energy: Integrated Oil & Gas
15 March 2019
Lukoil, ord. (LKOH RX, USD)
Hold (13 Nov 2018, 06:11 UTC)
Previous: Buy (12 Jan 2018, 13:01 UTC)
Target price, 12mo: 86.00
Last price: 85.64 (07 Mar 2019, close)
Expected total return: 5%
Upside, 12mo: 0%
DY, next 12mo: 4.4%
Lukoil, ADR (LKOD LI, USD)
Hold (13 Nov 2018, 06:11 UTC)
Previous: Buy (12 Jan 2018, 13:01 UTC)
Target price, 12mo: 86.00
Last price: 85.64 (07 Mar 2019, close)
Expected total return: 5%
Upside, 12mo: 0%
DY, next 12mo: 4.4%
Share price performance, 12-mo
|
100 |
25% |
|
|
80 |
20% |
|
|
|
||
|
60 |
15% |
|
|
|
||
|
|
10% |
|
Equities |
40 |
5% |
|
|
|||
20 |
0% |
||
|
|||
0 |
-5% |
||
|
Mar May |
Jul |
Sep |
Nov |
Jan |
|
|
|
|
LKOH RX, USD, lhs |
|
|
||
|
|
|
|
|||
|
|
Relative to MOEX Index, %, rhs |
|
|||
|
|
|
||||
|
|
|
|
|
|
|
|
|
|
1M |
3M |
12M |
3Y |
Price |
|
5% |
8% |
31% |
122% |
|
Price relative |
|
6% |
6% |
21% |
71% |
|
ADTV (USD mn) |
|
101.00 |
105.59 |
110.26 |
101.49 |
|
Key financial highlights
Fiscal year end |
12/18 |
12/19F |
12/20F |
12/21F |
P/E, x |
5.2x |
8.9x |
7.6x |
7.4x |
EV/EBITDA, x |
2.9x |
4.4x |
4.0x |
3.7x |
P/B, x |
0.9x |
0.9x |
0.8x |
0.7x |
FCF yield, % |
17.2% |
6.5% |
8.0% |
7.9% |
DY (ords), % |
5.3% |
4.6% |
5.1% |
5.7% |
Net sales, USD mn |
128,218 |
103,649 |
105,701 |
108,398 |
EBITDA, USD mn |
17,787 |
14,474 |
15,601 |
16,146 |
Net income, USD mn |
9,879 |
7,202 |
8,458 |
8,731 |
Net sales, chg |
26% |
-19% |
2% |
3% |
EBITDA, chg |
25% |
-19% |
8% |
3% |
Net income, chg |
38% |
-27% |
17% |
3% |
EPS(ords), USD |
13.17 |
9.60 |
11.28 |
11.64 |
DPS (ord.), USD |
3.65 |
3.95 |
4.40 |
4.85 |
BPS(ords), USD |
78.18 |
90.30 |
103.8 |
117.2 |
EBITDA margin, % |
13.9% |
14.0% |
14.8% |
14.9% |
ROE, % |
17% |
11% |
11% |
10% |
Net Debt, USD mn |
233 |
(476) |
(2,380) |
(3,928) |
ND/EBITDA, x |
0.0x |
0.0x |
(0.2x) |
(0.2x) |
Net int. cover, x |
20.2x |
13.0x |
42.4x |
44.4x |
Multiples and yields are calculated based on period-average prices where available.
Source: Bloomberg, Company data, VTB Capital Research
Focus
Lukoil
I can see clearly now the rain is gone
Lukoil is one of the best examples of a gradual but steady improvement in corporate governance, and we think this has been appreciated by the investment community. With USD 1.7bn spent on the buyback since September, the stock is one of the best performing in the sector. We note that in some weeks, the company has accounted for more than 20% of the ADTV this year. We continue to have a relative preference for Lukoil in the oil sector in Russia. However, the upside on the stock is capped by our reserved stance on oil prices. We reiterate our 12-month Target Price of USD 86 (5% ETR) and Hold recommendation.
Steady improvement in corporate governance. Lukoil is one of the brightest examples of a multi-year corporate governance improvement, and we think the investment community has started to appreciate this of late. In 2013, the company explicitly stated its targets on this front, but real delivery came with the treasury shares issue resolution in January 2018. Since 2013, Lukoil has addressed every issue, including international M&A (limited activity), decent dividends, buybacks and the cancellation of treasuries.
Lukoil to benefit modestly from regulatory changes. Lukoil will not particularly benefit from the introduction of EPT, we think, as Filanovskogo enjoys a special tax regime, while Korchagina would be better off staying under the current regulations (thanks to the existing tax breaks). However, the company is to increase the share of high-margin barrels further thanks to HTR expansion. The risks for Lukoil stem from a potential payment under the damper mechanism that could lead to USD 0.2bn of additional taxes (1.4% of EBITDA) in 2019 in our base scenario (under the current oil price, Lukoil might get some USD 0.6bn from the state, though, we estimate).
Buyback is one of the most important stock price drivers. Lukoil has spent some USD 1.7bn since last September, or 55% of the announced USD 3bn buyback. It formed more than 20% of the ADTV in February, which we believe is probably the most important factor behind the rally in the name (Lukoil has outperformed the RTS and RTS O&G by 9% and 14% YTD).
‘Inside out’ indicates undervaluation if oil price holds. Lukoil’s tax breaks have historically formed c.65% of earnings, making the company’s profitability dependent on the oil price. Given our muted stance on the crude price (USD 57/bbl in 2019F) we estimate that Lukoil’s shares are now trading at a 73% premium to the NPV of its tax reliefs. However, the stock is trading at just a 9% premium to the NPV of the tax breaks under the current oil price, which might be a good indication of the likely shares appreciation for those investors with a more bullish view on oil prices, we think.
Dmitry Loukashov, CFA, Equities Analyst
+7 495 663 46 34 // dmitry.loukashov@vtbcapital.com
Ekaterina Rodina, Equities Analyst
+7 495 663 47 33 // ekaterina.rodina@vtbcapital.com
Alexander Donskoy, Equities Analyst
+7 495 660 67 88 // alexander.donskoy@vtbcapital.com
Artur Muradyants, Equities Analyst
+7 495 663 46 38 // artur.muradyants@vtbcapital.com
Aydar Safin, Equities Analyst
+7 495 663 46 32 // aydar.safin@vtbcapital.com
Prices cited in the body of this report are as of the last close before, or the close on, 14 Mar 2019 (except where indicated otherwise). VTB Capital analysts update their recommendations periodically as required. This research report was prepared by the analyst(s) named above who is(are) associated with JSC VTB Capital and is distributed by JSC VTB Capital and VTB Capital PLC and their non-U.S. affiliates outside the United States. This VTB Capital research report is distributed to investors located within United States by Xtellus Capital Partners, Inc. (“Xtellus”) as a “third-party research report” as defined in Rule 2241(a)(14) and Rule 2242(a)(17) of the U.S. Financial Industry Regulatory Authority. Please refer to the Disclosures section of this report for other important disclosures, including the analyst certification and information required by regulation.
vk.com/id446425943 |
|
|
Russia |
Lukoil |
|
Energy: Integrated Oil & Gas |
|
|
|
Table of contents |
|
|
Lukoil – Impressive Corporate Governance Drive................................................... |
4 |
|
Way to being the most owned stock in the Russian oil space ................................. |
6 |
|
Focus on High Margin Barrels in Upstream............................................................. |
8 |
|
Regulatory environment .................................................................................... |
10 |
|
West Qurna-2 and other potential international expansion................................ |
13 |
|
Downstream........................................................................................................... |
13 |
|
Downstream tax amendments........................................................................... |
15 |
|
Valuation................................................................................................................ |
16 |
|
‘Inside out’ approach ......................................................................................... |
17 |
|
Appendix – Korchagina field regulatory regime ..................................................... |
19 |
|
Disclosures ............................................................................................................... |
20 |
15 March 2019 |
2 |
vk.com/id446425943
Russia
Energy: Integrated Oil & Gas
VTB Capital Facts & Forecasts
Russia
Energy / Integrated Oil & Gas
Lukoil
Prices as of: 7 March 2019
Ticker |
CCY |
Current |
12mo TP |
Rating |
LKOH RX |
USD |
85.64 |
86.00 |
Hold |
Share price performance, 12-mo
100 |
25% |
80 |
20% |
|
|
60 |
15% |
|
|
|
10% |
40 |
5% |
|
|
20 |
0% |
|
|
0 |
-5% |
Mar May Jul Sep Nov Jan Mar
LKOH RX, USD, lhs
Relative to MOEX Index, %, rhs
Company description
Lukoil is Russia's largest non-state-owned integrated oil and gas company. In 2018, it produced 84.8mmt (flat YoY) of crude oil (including oil produced within international projects) which makes it the second largest oil producer in Russia. Refining occurs in Russia (in the Central region and Timano-Pechora) and abroad (Romania, Bulgaria, Italy and the Netherlands). The company's total proved reserves of crude amounted to 12bn bbl, according to SEC standards, as of the end of 2018, thus representing a robust 19 years of liquids reserves life. Total refining in 2018 was 73.9mmt (also flat YoY).
Company website
http://www.lukoil.com/
Shareholder structure
Other/Free |
Treasury |
float |
shares |
56% |
5% |
Management of the company 39%
Source: Company data, VTB Capital Research
Research team
Dmitry Loukashov, CFA / +7 495 663 46 34
Ekaterina Rodina / +7 495 663 47 33
Alexander Donskoy / +7 495 660 67 88
Aydar Safin / +7 495 663 46 32
Artur Muradyants / +7 495 663 46 38
Lukoil
Last model update on: 5 March 2019
|
IFRS |
2017 |
2018 |
2019F |
2020F |
2021F |
|
2022F |
|
|
Company data |
|
|
|
|
|
|
|
|
|
Weighted avg # shares, mn |
850.6 |
750.0 |
750.0 |
750.0 |
750.0 |
|
750.0 |
|
|
Avg market cap, USD mn |
37,177 |
48,957 |
59,685 |
59,685 |
59,685 |
|
59,685 |
|
|
EV, USD mn |
41,802 |
49,190 |
59,209 |
57,304 |
55,756 |
|
54,187 |
|
|
Ratios & analysis |
|
|
|
|
|
|
|
|
|
P/E, x |
6.2x |
5.2x |
8.9x |
7.6x |
7.4x |
|
7.3x |
|
|
EV/EBITDA, x |
3.4x |
2.9x |
4.4x |
4.0x |
3.7x |
|
3.6x |
|
|
P/B, x |
0.7x |
0.9x |
0.9x |
0.8x |
0.7x |
|
0.7x |
|
|
FCF yield, % |
9.6% |
17.2% |
6.5% |
8.0% |
7.9% |
|
8.5% |
|
|
Dividend yield (ords), % |
6.6% |
5.3% |
4.6% |
5.1% |
5.7% |
|
5.7% |
|
|
Dividend yield (prefs), % |
|
|
|
|
|
|
|
|
|
EPS(ords), USD |
8.44 |
13.17 |
9.60 |
11.28 |
11.64 |
|
11.75 |
|
|
CFPS, USD |
15.28 |
21.42 |
16.75 |
17.74 |
18.16 |
18.29 |
|
|
|
Free CFPS, USD |
5.01 |
11.91 |
5.57 |
6.83 |
6.80 |
7.28 |
|
|
|
DPS (ords), USD |
3.43 |
3.65 |
3.95 |
4.40 |
4.85 |
4.85 |
|
|
|
Payout ratio (ords), % |
34.0% |
26.2% |
38.2% |
36.2% |
38.7% |
38.3% |
|
|
|
BPS(ords), USD |
71.24 |
78.18 |
90.30 |
103.8 |
117.2 |
130.3 |
|
|
|
Revenues growth, % |
31% |
26% |
-19% |
2% |
3% |
0% |
|
|
|
EBITDA, chg |
31% |
25% |
-19% |
8% |
3% |
1% |
|
|
|
EPS growth, % |
133% |
56% |
-27% |
17% |
3% |
1% |
|
|
|
EBIT margin, % |
9% |
10% |
9% |
10% |
10% |
10% |
|
|
|
EBITDA margin, % |
14.0% |
13.9% |
14.0% |
14.8% |
14.9% |
|
15.1% |
|
|
Net margin, % |
7.1% |
7.7% |
6.9% |
8.0% |
8.1% |
8.1% |
|
|
|
ROE, % |
11.9% |
16.9% |
10.7% |
10.9% |
10.0% |
|
9.0% |
|
|
ROIC, % |
8.5% |
13.8% |
9.5% |
9.7% |
9.1% |
8.5% |
|
|
|
Capex/Revenues, % |
9% |
6% |
8% |
8% |
8% |
8% |
|
|
|
Capex/Depreciation, x |
1.6x |
1.3x |
1.7x |
1.6x |
1.7x |
|
1.6x |
|
|
Net debt/Equity, % |
8% |
0% |
-1% |
-3% |
-4% |
-6% |
|
|
|
Net debt/EBITDA, x |
0.3x |
0.0x |
0.0x |
(0.2x) |
(0.2x) |
|
(0.3x) |
|
|
Net interest cover, x |
18.5x |
20.2x |
13.0x |
42.4x |
44.4x |
|
45.2x |
|
|
Income statement summary, USD mn |
|
|
|
|
|
|
|
|
|
Revenues |
101,739 |
128,218 |
103,649 |
105,701 |
108,398 |
108,655 |
|
|
|
Cost of sales |
(84,655) |
(107,360) |
(86,249) |
(87,075) |
(89,083) |
(89,094) |
|
|
|
SG&A and other opexp. |
(2,833) |
(3,070) |
(2,926) |
(3,025) |
(3,169) |
(3,187) |
|
|
|
EBITDA |
14,251 |
17,787 |
14,474 |
15,601 |
16,146 |
16,374 |
|
|
|
Depreciation & amortization |
(5,571) |
(5,474) |
(4,994) |
(4,973) |
(5,012) |
(5,031) |
|
|
|
Operating profit |
8,680 |
12,313 |
9,480 |
10,628 |
11,134 |
11,343 |
|
|
|
Non-operating gains /(exp.) |
223 |
(83) |
(595) |
(580) |
(580) |
(580) |
|
|
|
EBIT |
8,680 |
12,313 |
9,480 |
10,628 |
11,134 |
11,343 |
|
|
|
Net interest income/(exp.) |
(209) |
(299) |
(194) |
151 |
151 |
|
151 |
|
|
Profit before tax |
8,983 |
12,334 |
9,067 |
10,575 |
11,081 |
|
11,290 |
|
|
Income tax |
(1,778) |
(2,424) |
(1,843) |
(2,091) |
(2,323) |
|
(2,452) |
|
|
Minority interests |
(28) |
(31) |
(22) |
(26) |
(27) |
(27) |
|
|
|
Net income |
7,177 |
9,879 |
7,202 |
8,458 |
8,731 |
8,810 |
|
|
|
Cash flow statement summary, USD mn |
|
|
|
|
|
|
|
|
|
Cash flow from operations |
12,998 |
16,062 |
12,561 |
13,305 |
13,617 |
|
13,716 |
|
|
Working capital changes |
(428) |
(536) |
|
|
|
|
|
|
|
Capex |
(8,766) |
(7,204) |
(8,381) |
(8,184) |
(8,517) |
|
(8,258) |
|
|
Other investing activities |
(112) |
(123) |
- |
- |
- |
- |
|
|
|
Free cash flow |
4,261 |
8,933 |
4,180 |
5,121 |
5,100 |
5,458 |
|
|
|
Share issue (reacquisition) |
(162) |
(957) |
|
|
|
|
|
|
|
Dividends paid |
(2,425) |
(2,559) |
(2,743) |
(2,966) |
(3,301) |
(3,637) |
|
|
|
Net change in borrowings |
(987) |
(3,325) |
|
|
|
|
|
|
|
Other financing cash flow |
(665) |
(635) |
(728) |
(251) |
(251) |
(251) |
|
|
|
Movement in cash |
1,183 |
2,589 |
709 |
1,904 |
1,548 |
1,570 |
|
|
|
Balance sheet summary, USD mn |
|
|
|
|
|
|
|
|
|
Cash and equivalents |
5,736 |
7,091 |
7,801 |
9,705 |
11,253 |
12,823 |
|
|
|
PP&E |
62,069 |
55,119 |
63,500 |
71,684 |
80,201 |
88,459 |
|
|
|
Goodwill |
717 |
601 |
601 |
601 |
601 |
601 |
|
|
|
Investments |
3,192 |
3,660 |
3,660 |
3,660 |
3,660 |
3,660 |
|
|
|
Other assets |
19,019 |
16,043 |
16,044 |
16,044 |
16,044 |
16,044 |
|
|
|
Total assets |
90,733 |
82,515 |
91,606 |
101,694 |
111,759 |
121,587 |
|
|
|
Interest bearing debt |
10,701 |
7,702 |
7,702 |
7,702 |
7,702 |
7,702 |
|
|
|
Other liabilities |
19,435 |
16,177 |
16,177 |
16,177 |
16,177 |
|
16,177 |
|
|
Total liabilities |
30,136 |
23,879 |
23,879 |
23,879 |
23,879 |
23,879 |
|
|
|
Total shareholder's equity |
60,468 |
58,522 |
67,589 |
77,652 |
87,690 |
97,491 |
|
|
|
Minority interest |
129 |
115 |
137 |
163 |
190 |
217 |
|
|
|
Net working capital |
4,453 |
3,808 |
3,808 |
3,808 |
3,808 |
3,808 |
|
|
|
Net Debt |
4,625 |
233 |
(476) |
(2,380) |
(3,928) |
(5,498) |
|
|
|
Capital |
71,168 |
66,224 |
75,291 |
85,354 |
95,392 |
105,193 |
|
|
|
|
|
|
|
|
|
|
|
|
15 March 2019 |
3 |
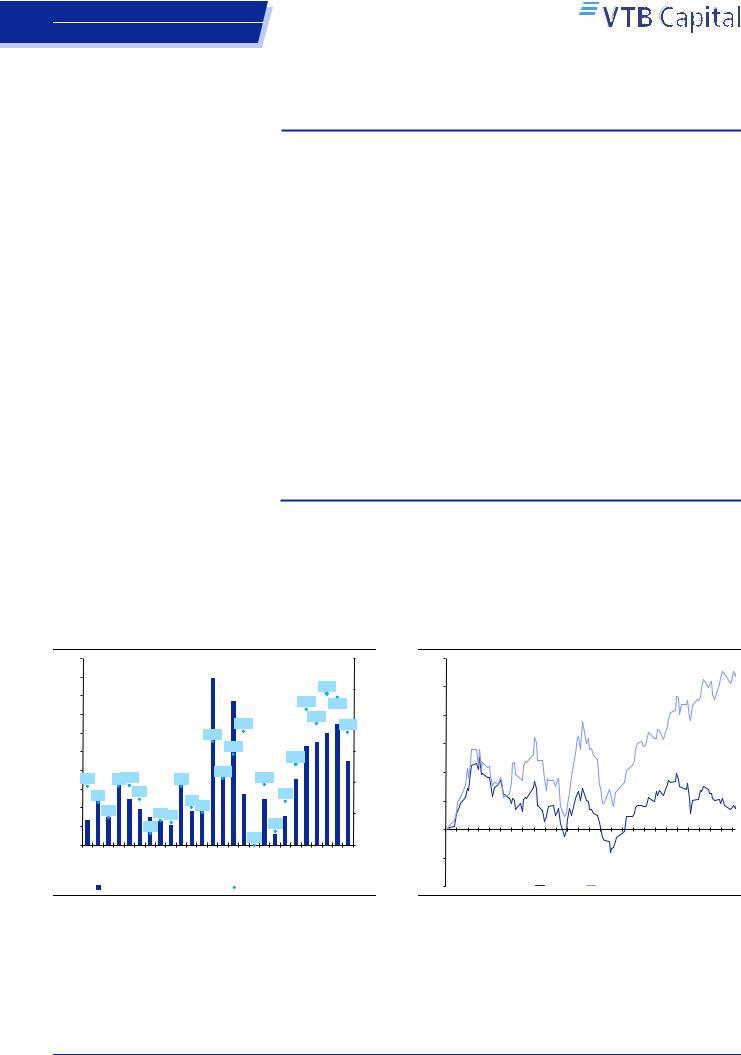
vk.com/id446425943 |
Lukoil |
Russia |
|
Energy: Integrated Oil & Gas |
|
Lukoil – Impressive Corporate Governance
Drive
Lukoil has attracted wider investment community attention as a result of the ongoing buyback and the share price has shown a decent performance, with the stock beating the RTSI by 9% YTD.
The company has demonstrated a notable trend of improving corporate governance since 2013, which we think is behind the stock’s strong performance.
We see the company’s domestic crude oil production increasing at a CAGR of 1% in 2019-20F with the share of high margin barrels growing to 41% in 2020F from c.31% now.
The profitability of the downstream is set to improve thanks to the growing share of diesel and declining share of FO, and this is likely to offset the negative effect of IMO restrictions.
Our ‘inside out’ approach under USD 57/bbl shows that Lukoil now trades at a 9% premium to the NPV of the combined tax reliefs. However, if oil stays at USD 67/bbl, that might be a good indication for likely further stock price appreciation.
Although we see the downside as pretty limited, given the buyback and predictable dividend policy, the upside is capped mainly due to our muted view on the oil price.
Lukoil still remains our relative preferred play in the Russian oils despite the Hold recommendation.
Lukoil has spent USD 1.7bn on the buyback since September 2018, accounting for some 10% of the daily trading volume on average for the period (22% for the last month, spending some USD 0.5bn). Although it is not particularly clear to us what is behind this accelerated buyback, we treat it as beneficial for minority shareholders. Nevertheless, we believe this has been one of the most important driver for the stock’s recent performance.
Figure 1: More than half of USD 3bn buyback has been spent by now
|
200 |
|
|
|
|
|
|
|
30% |
|
180 |
|
|
|
|
|
|
24% |
|
|
160 |
|
|
|
|
|
|
25% |
|
|
|
|
|
|
|
|
|
||
|
|
|
|
|
|
22% |
24% |
|
|
|
|
|
|
|
|
|
|
||
|
140 |
|
|
|
|
|
19% |
20% |
|
|
120 |
|
|
|
17% |
18% |
18% |
||
USDmn |
|
|
|
|
|
|
|||
100 |
|
|
|
|
15% |
|
15% |
||
|
|
|
|
|
|
||||
|
|
|
|
|
|
13% |
|
||
|
|
|
|
|
|
|
|
|
|
|
80 |
9% |
9%10% |
9% |
11% |
10% |
|
|
|
|
60 |
|
|
10% |
|||||
|
|
|
7% |
|
|
|
|
||
|
7% |
|
|
|
7% |
|
|
||
|
|
|
6%5% |
|
|
|
|||
|
40 |
4% |
|
|
|
|
|
||
|
|
4%4% |
|
|
|
5% |
|||
|
|
|
|
|
2% |
|
|||
|
20 |
|
|
2% |
|
|
|
|
|
|
0 |
|
|
|
|
|
0% |
|
0% |
|
Week 1 Week 2 Week 3 |
|
Week 4 Week 5 Week 6 Week 7 Week 8 |
Week 9 Week 10 Week 11 Week 12 Week 13 |
Week 14 Week 15 Week 16 Week 17 Week 18 Week 19 Week 20 Week 21 Week 22 Week 23 |
Week 24 Week 25 Week 26 |
|||
|
|
|
|
||||||
|
|
Buyback traded volumes, USDmn |
|
Share of total traded volumes |
|
||||
Source: Company data, VTB Capital Research
Figure 2: Lukoil’s shares have outperformed RTS O&G by 23% since the buyback was launched
30%
25% |
|
|
|
|
20% |
|
|
|
|
15% |
|
|
|
|
10% |
|
|
|
|
5% |
|
|
|
|
0% |
12-Sep |
19-Sep 26-Sep 3-Oct 10-Oct 17-Oct 24-Oct 31-Oct 7-Nov 14-Nov 21-Nov 28-Nov 5-Dec |
12-Dec 19-Dec 26-Dec 2-Jan 9-Jan 16-Jan 23-Jan 30-Jan 6-Feb 13-Feb 20-Feb 27-Feb 6-Mar 13-Mar |
|
-5% |
||||
|
|
|
||
-10% |
|
RTS O&G |
LKOD LI |
Source: Company data, VTB Capital Research
15 March 2019 |
4 |
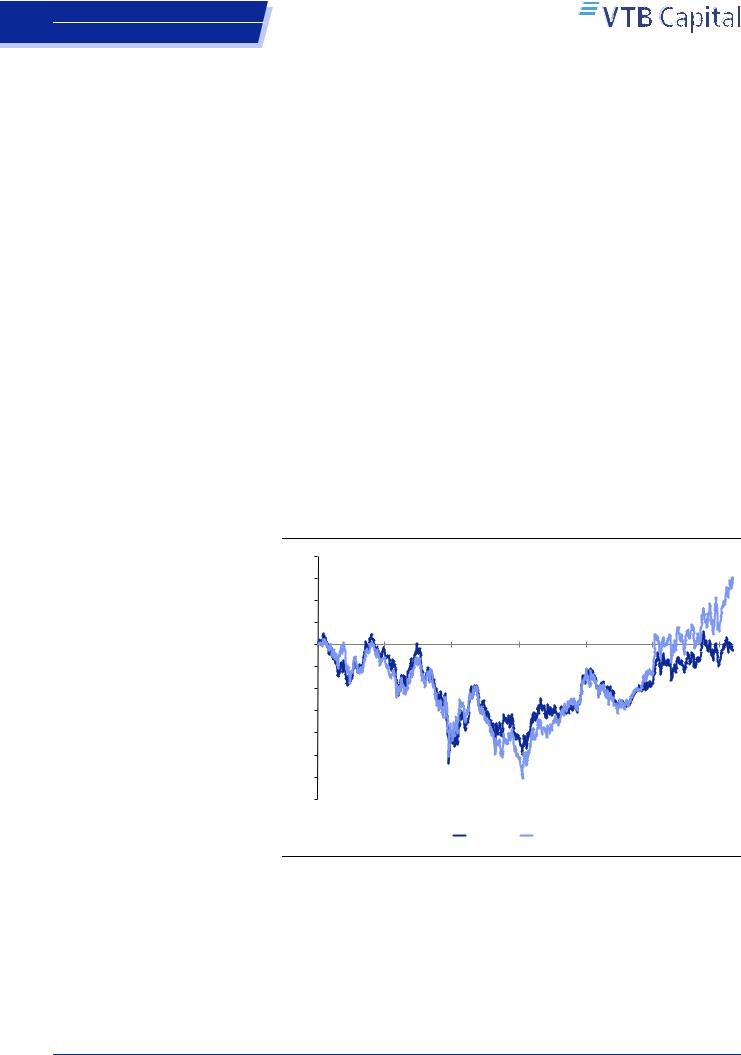
vk.com/id446425943
Russia
Energy: Integrated Oil & Gas
Lukoil
We note the consistent trend of corporate governance improvements across the board at Lukoil in recent years. While, from the operational profitability standpoint, the company has remained more or less the same, in our view it is corporate governance that has provided the impetus for the appreciation in Lukoil’s shares. And it must be noted that over the last 12-15 months, Lukoil has addressed almost all the issues which had been raised:
Poor communication practices
Low dividends and reluctance to revise dividend policy
Treasury shares on the balance
International expansion
•Refineries in Europe
•Offshore exploration in Africa
General lack of care about minorities
Improving corporate governance practices was one of the key targets of the company’s 2013 Strategy, with the first strategic aim being ‘Value creation and accelerating the growth of dividends’. Since then, Lukoil has behaved consistently. Based on the stock’s performance, we think that, although this was visible, investors were not in rush to price it in. The stock only started to outperform peers visibly after the company announced its intention to cancel 12% of treasury shares in January 2018. Since then, Lukoil has been the second best performing stock in the oil space (after Tatneft, which has also massively improved its corporate governance), delivering +49% in capital gains since 1 January 2018 and outperforming the RTS O&G Index by 31% in dollar terms.
Figure 3: Lukoil is among the top performers over the last five years
40%
30%
20%
10%
0% -10% -20% -30% -40% -50% -60% -70%
2013 |
2014 |
2015 |
2016 |
2017 |
2018 |
2019 |
|
|
|
RTS O&G |
LKOD LI |
|
|
Source: Bloomberg, VTB Capital Research
15 March 2019 |
5 |

vk.com/id446425943 |
Lukoil |
Russia |
|
Energy: Integrated Oil & Gas |
|
Way to being the most owned stock in the Russian oil space
What was Lukoil back in 2012? Along with TNK-BP, Bashneft and Alliance oil, it was one of the non-state owned, public, large cap (hence, liquid) integrated oil and gas companies in Russia. Lukoil’s share in the core indices has always been significant – 14.5% and 0.8% in MSCI Russia and EM, respectively (on 1 January 2013) vs. 21.3% and 0.8% now. The company produced c.1.7mmbbl/d (84mmt) of oil in 2012 compared with 1.6mmbbl/d (c.81mmt) in 2018 (-c.3%) and refined in total 44mmt and 43mmt (-c.3%) of oil in the respective years in Russia. Lukoil’s EBITDA in 2018 came 6% lower than it was in 2012 (USD 18.9bn vs. USD 17.8bn), while the company’s FCF has increased 21% (from USD 7.4bn to USD 8.9bn) providing for the respective FCF yields of 14.5% and 15.4%.
Figure 4: Crude production in Russia remained broadly flat…
1.80
1.75
1.70 mnb/d 1.65 1.60
1.55
1.50
1Q2012 |
2Q2012 |
3Q2012 |
4Q2012 |
1Q2013 |
2Q2013 |
3Q2013 |
4Q2013 |
1Q2014 |
2Q2014 |
3Q2014 |
4Q2014 |
1Q2015 |
2Q2015 |
3Q2015 |
4Q2015 |
1Q2016 |
2Q2016 |
3Q2016 |
4Q2016 |
1Q2017 |
2Q2017 |
3Q2017 |
4Q2017 |
1Q2018 |
2Q2018 |
3Q2018 |
4Q2018 |
|
|
|
|
|
|
|
|
|
Crude production in Russia |
|
|
|
|
|
|
|
|
|
|
||||||||
Source: Company data, VTB Capital Research
Figure 5: …as did the financial performance, at first glance
20
18
16
14
12
USDbn 10
8
6
4
2
-
2012 |
2013 |
2014 |
2015 |
2016 |
2017 |
2018 |
|
|
|
EBITDA FCF |
|
|
|
Source: Company data, VTB Capital Research
We acknowledge that there have been changes in the company’s business operations (for example, it has launched large greenfields in Russia and Iraq, modernised refineries, developed premium sales channels in the downstream, and commissioned new oil and gas fields in former CIS countries). Also, in addition to the macro situation being quite volatile (with oil losing USD 40/bbl and RUB depreciating 50%), there have been significant changes in the regulatory environment (such as the numerous modifications to the tax manoeuvre). However, in terms of its operational profitability and financial performance, Lukoil seems not to have changed dramatically.
What has really changed is corporate governance.
Formally, as we mentioned above, Lukoil set value creation via an increase in the dividends as one of the targets in the March 2013 Strategy. Back then, the market took it with a grain of salt. Given the company’s track record, investors were sceptical and wanted to see proof of a change in the company’s attitude towards minority shareholders. We think that the first real step in the corporate governance turnaround for Lukoil happened in March 2015, when CEO Vagit Alekperov announced that Lukoil might exit all international offshore projects in Western Africa due to the lack of commercial reserves. International investments (in refining and risky offshore exploration), which has always been one of the most questionable parts of Lukoil’s business activity. Apart from the capex, which was constantly being channelled to offshore exploration with operational and regulatory risks (USD 16.7bn was spent during 2008-15), the company had been steadily writing off dry wells in Africa, Romania, Vietnam, Saudi Arabia and other foreign regions (USD 2.4bn in total for 2008-16), which negatively affected Lukoil’s earnings. In June 2015, the company announced that it had decided to exit from one of two exploratory projects in Ghana. Then, by January 2016 Lukoil left all the projects in Sierra Leone and Cote d’Ivoire, keeping its exposure to the region only via one project in each of Ghana, Cameroon and Nigeria (none of which is operated by Lukoil). International refining and upstream (apart from the West Qurna-2 and CIS projects – mostly PSAs) stopped to be a focus area for the company (the drop in the oil price in 4Q14 might be one of the reasons, though).
15 March 2019 |
6 |

vk.com/id446425943
Russia
Energy: Integrated Oil & Gas
Lukoil
Although the company had started to limit risky international activities, this had no immediate effect on the stock price (even when Lukoil really started to focus on the dividends part of the story). The first signs of a renaissance in investment community interest towards Lukoil’s shares merged after the approval of the new dividend policy, which made the distribution of dividends more predictable. Before that, the company’s official dividend policy implied a payout of not less than 15%. In April 2016, the payout ratio was increased to 25%, while the potential downside was limited to rouble inflation of the previous year’s DPS (the company pays out the higher of these two). Although this was an important step in the overall corporate governance improvement of Lukoil, this did not see any tangible reflection in the stock performance, which makes us think that investors were not really impressed back then.
The strengthening of the IR team in August 2016 led to an immediate improvement in disclosure practices (operating statistics became available before the financial results were published, databook updates were given in a timely fashion, etc). Moreover, this led to management being more accessible (during conference calls and investor/analyst meetings), which we think was also appreciated by investors.
After that, there was only one disturbing factor left in Lukoil’s story: the 17% quasitreasury shares stake. And, finally, continuing the trend of the improvement in corporate governance, in January 2018 Lukoil announced its intention to cancel almost 12% of share capital (100.6mn shares) with some 5% to be spent for the management compensation programme. We think this was the real turning point, when investors’ appreciation of the steady, multi-year improvement in the corporate governance at Lukoil finally started to be reflected in the stock’s performance. The treasury shares were officially cancelled in November last year.
Furthermore, during its Strategy Update in March 2018, Lukoil announced its intention to spend half of the FCF generated at oil prices above USD 50/bbl for the shares buyback. In September 2018, the company announced a USD 3bn buyback programme for 2018-20 with all treasuries to be cancelled after the completion of the buyback. Given the accelerated pace of the buyback (USD 1.66bn has been spent as of now) the company stated that it might complete it as early as this year. This buyback is to be followed by another one, the details of which are to be discussed in 3Q19.
In addition, on 6 March the company’s BoD approved the amendment of the dividend policy, which is now going to account for the shares owned by Lukoil’s Group. This means that the greater buyback pace could provide for faster dividends growth. As a result of this amendment, we estimate that for 2018 Lukoil’s shareholders might receive RUB 5 more in DPS, which implies 0.1% additional DY. For 2018 in total, the company might pay RUB 240 (including RUB 85/share distributed for 9mo18) or 4.3% DY, on our numbers.
Over the last 20 years, Lukoil’s FCF has turned negative only once, in 1998. The company has sustainably generated positive FCF, although we do not think this was really appreciated by the investment community, given that sharing this cash with investors was not considered to be a priority. Now, that is no longer valid. With USD 1.7bn of cash spent on the buyback of own shares over the last six months and the intention to amend the dividend policy to account for the cancellation of the treasuries, Lukoil is essentially sharing its FCF with minority investors. We therefore believe that it is worth reminding ourselves what Lukoil as a company is now.
15 March 2019 |
7 |