

bain_report_private_equity_report_20
.pdfvk.com/id446425943
Global Private Equity Report 2019
Exits: Strategic buyers keep the party going
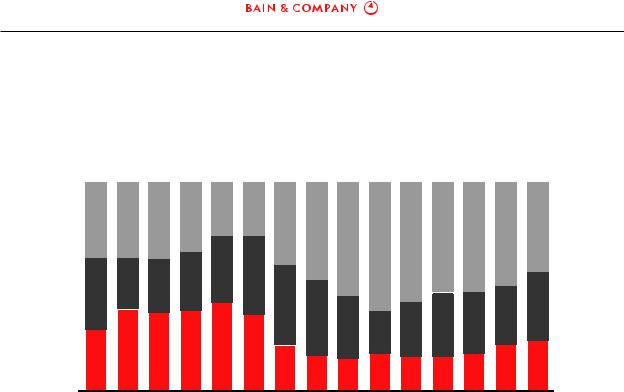
Although exit activity in 2018 came in a smidgen lower than the previous year, it was still a strong contributor to a historic five-year stretch that has produced unprecedented distributions for investors. Last year’s 1,146 exits, valued at $378 billion, were on par with 2017 (see Figure 1.14). The robust performance brought total exit value since 2014 to $2 trillion, by far the largest five-year total on record.
Activity over that period has bounced around somewhat, but the overall trend in exits has been strong and steady, generating an equally steady flow of capital back to LPs. Investors were cash flow positive for the eighth year running, meaning distributions have outstripped contributions each year—a virtuous cycle that has encouraged LPs to continue pumping capital back into the industry
(see Figure 1.15).
Exit value has been steady across regions, with the Asia-Pacific market producing the only real spike in 2018. Asia-Pacific exit count actually dropped during the year, but the average transaction size more than doubled due to a number of large exits in China and India. The US and Europe also benefited from a stream of big deals. Golden Gate Capital and Bain Capital, together with GIC, Insight Venture Partners and Elliott Management, produced the biggest exit in the US when they sold BMC Software to KKR for $8.3 billion. Europe’s largest exit was Macquarie’s $5.4 billion sale of Techem to Partners Group, CDPQ and the Ontario Teachers’ Pension Plan.
Figure 1.14: Buyout-backed exits continued strong in 2018
Global buyout-backed exit value |
Exit count |
$500B |
1,500 |
400 |
|
|
|
|
|
|
|
|
|
|
|
|
|
|
|
|
|
|
|
|
|
300 |
|
|
|
|
|
|
|
|
|
|
|
|
|
|
|
|
|
|
|
|
1,000 |
|
|
|
|
|
|
|
|
|
|
|
|
|
|
|
|
|
|
|
|
|
|
200 |
|
|
|
|
|
|
|
|
|
|
|
|
|
|
|
|
|
|
|
|
|
|
|
|
|
|
|
|
|
|
|
|
|
|
|
|
|
|
|
|
|
|
500 |
100 |
|
|
|
|
|
|
|
|
|
|
|
|
|
|
|
|
|
|
|
|
|
0 |
|
|
|
|
|
|
|
|
|
|
|
|
|
|
|
|
|
|
|
|
0 |
1996 97 |
98 |
99 |
00 |
01 |
02 |
03 |
04 |
05 |
06 |
07 |
08 |
09 |
10 |
11 |
12 |
13 |
14 |
15 |
16 |
17 |
18 |
Total count
 Rest of world
 Asia-Pacific

 Europe

 North America
Notes: Bankruptcies excluded; IPO value represents offer amount and not market value of company Source: Dealogic
17

vk.com/id446425943
Global Private Equity Report 2019
Figure 1.15: LPs have been cash flow positive on their PE investments for eight years running
Capital contributions and distributions, global buyout funds |
|
|
|
|
|
|
|
|
||||
$200B |
|
|
|
|
|
|
|
|
|
|
|
|
100 |
|
|
|
|
|
|
|
|
|
|
|
Net cash |
|
|
|
|
|
|
|
|
|
|
|
|
|
|
|
|
|
|
|
|
|
|
|
|
|
flows |
|
|
|
|
|
|
|
|
|
|
|
|
Distributions |
0 |
|
|
|
|
|
|
|
|
|
|
|
Contributions |
|
|
|
|
|
|
|
|
|
|
|
|
|
–100 |
|
|
|
|
|
|
|
|
|
|
|
|
–200 |
|
|
|
10 |
11 |
12 |
13 |
14 |
15 |
16 |
17 |
H1 18 |
2006 |
07 |
08 |
09 |
|||||||||
Ratio of distributions |
1.0 |
0.8 |
0.3 |
0.4 |
0.8 |
1.2 |
1.5 |
2.4 |
2.0 |
2.2 |
1.7 |
1.6 |
1.8 |
to contributions
Source: Cambridge Associates Private Investments Database
With some exceptions, such as partial exits, GPs are clearly in no mood to hang onto assets any longer than they have to. The median holding period (how long funds are holding onto portfolio companies before exiting) fell 10% last year to 4.5 years, after edging down slowly from a peak of 5.9 years in 2014. “Quick flips,” or assets held for less than three years, are still well below levels seen at the exuberant end of the last cycle, but they’ve crept up to 24% of the total (see Figure 1.16). Changes in the US tax treatment of carried interest were expected to discourage quick flips, but they ticked up last year anyway.
The urgency to sell reflects a number of factors. First, demand for assets among both corporate and PE buyers is ravenous. The same rise in competition and deal multiples that frustrates GPs on the buy side provides a rich opportunity to sell assets for premium prices. Second, as signs of economic weakness pile up, firms are also looking to sell anything that isn’t tied down, knowing that a recession could make it harder to sell later. Similarly, firms know that the robust fund-raising environment won’t last forever, meaning it pays to get back on the road as soon as possible. Many are willing to trade a little bit of IRR on current exits so they can turn to raising a new (and hopefully bigger) fund, which can provide fee income and fresh capital to invest for the next five-plus years. Decisions like those are made easier by the proliferation of exit committees charged with moving assets out of the portfolio most opportunistically. Taking the decision away from the managing director who “owns” the deal tends to avoid the trap of missing opportunities while trying to squeeze every last dollar from every last deal.
18
vk.com/id446425943
Global Private Equity Report 2019
Figure 1.16: The median holding period is falling as GPs exit an increasing percentage of companies in less than five years
Distribution of global buyout-backed investments exited, by length of time held in fund portfolio
100% |
|
|
|
|
|
|
|
|
|
|
|
|
|
|
80 |
|
|
|
|
|
|
|
|
|
|
|
|
|
|
60 |
|
|
|
|
|
|
|
|
|
|
|
|
|
|
40 |
|
|
|
|
|
|
|
|
|
|
|
|
|
|
20 |
|
|
|
|
|
|
|
|
|
|
|
|
|
|
0 |
|
|
|
|
|
|
|
|
|
|
|
|
|
|
2004 |
05 |
06 |
07 |
08 |
09 |
10 |
11 |
12 |
13 |
14 |
15 |
16 |
17 |
18 |
|
|
|
|
|
|
Year of exit |
|
|
|
|
|
|
|
|
Median holding |
4.2 |
3.8 |
3.8 |
3.6 |
3.2 |
3.6 |
4.4 |
4.8 |
5.2 |
5.7 |
5.9 |
5.2 |
5.1 |
5.0 |
4.5 |
period (years) |
|
|
|
|
|
|
|
|
|
|
|
|
|
|
|

 More than 5 years

 3–5 years

 0–3 years
Source: Preqin
Where the activity was
Strategic deals. Cash-rich corporate buyers looking to build scale and scope through acquisition continue to pace the market. Sales to these strategic buyers represented 2018’s most vibrant exit channel (see Figure 1.17). At a time when organic growth is hard to come by, corporations see real advantage in acquiring companies that have been pre-scrubbed during PE ownership. When The Stars Group bought Sky Betting & Gaming from CVC Capital Partners for $5 billion, for instance, the goal was to add sports betting to Stars’ dominant position in online poker. By the same token, Adobe hopes its $4.8 billion acquisition of Marketo from Vista Equity Partners will help accelerate expansion of its cloud-based marketing platform in the business-to-business space.
Sponsor-to-sponsor deals and IPOs. Sponsor-to-sponsor deals remained an important exit channel globally. While off slightly in terms of value, sponsor-to-sponsor exits turned in their third-strongest year ever for the industry in 2018. The value of IPOs, meanwhile, fell 34% globally as market uncertainty and higher volatility curtailed activity, especially in Europe and Asia-Pacific. As GPs grapple with an uncertain economic outlook, IPOs can be less attractive than onetime sales. Public offerings are essentially slow-motion exits, since mandated holding periods and market timing considerations force a firm to hold onto a large share of its investment for a period of years. That can allow a GP to continue to profit from the upside in good times, but if the economy falters, so might the value of the investment. It’s notable that, in December, CVC launched a bid to take private Sweden’s Ahlsell, a construction prod-
19

vk.com/id446425943
Global Private Equity Report 2019
Figure 1.17: Sales to strategic buyers and other sponsors kept up a brisk pace in 2018, while IPO exits weakened
Global buyout-backed exit value |
Exit count |
$500B |
1,500 |
400 |
|
|
|
|
|
|
|
|
|
|
|
|
|
|
|
|
|
|
|
|
|
|
|
|
|
|
|
|
|
|
|
|
|
|
|
|
|
|
|
|
|
|
1,000 |
300 |
|
|
|
|
|
|
|
|
|
|
|
|
|
|
|
|
|
|
|
|
|
200 |
|
|
|
|
|
|
|
|
|
|
|
|
|
|
|
|
|
|
|
|
|
|
|
|
|
|
|
|
|
|
|
|
|
|
|
|
|
|
|
|
|
|
500 |
100 |
|
|
|
|
|
|
|
|
|
|
|
|
|
|
|
|
|
|
|
|
|
0 |
|
|
|
|
|
|
|
|
|
|
|
|
|
|
|
|
|
|
|
|
0 |
1996 97 |
98 |
99 |
00 |
01 |
02 |
03 |
04 |
05 |
06 |
07 |
08 |
09 |
10 |
11 |
12 |
13 |
14 |
15 |
16 |
17 |
18 |
Total count 
 IPO
IPO
Sponsor- to-sponsor

 Strategic
Notes: Bankruptcies excluded; IPO value represents offer amount and not market value of company
Source: Dealogic
ucts company it had listed on the public markets only two years earlier. CVC still held a 25% stake in Ahlsell, but the company’s stock was trading below the IPO price. IPO data doesn’t account for followon sales—the sale of stakes left over from previous years’ IPOs—which have provided a significant source of liquidity in recent years. In 2018, however, increased volatility in the global equity markets suppressed follow-on activity, as GPs saw fewer chances to exit positions.
Dividend recapitalizations. Despite the upward trend in US interest rates, GPs have continued to take money off the table and de-risk investments by recapitalizing debt. Dividend recaps, in fact, have held up better than anyone expected. Tightening credit markets are starting to take a toll, however. Given the favorable debt environment of the past two or three years, it’s becoming harder to find a new credit agreement with better terms than the old one. In Europe, dividend recaps were down meaningfully from a spike in 2017, crowded out by demand for loans from the broader M&A market.
Partial exits. Last year, we talked about the increasing popularity of partial exits, deals in which a firm sells part of a portfolio company but holds onto the rest. Despite the seller’s market for assets described earlier, the trend continued in 2018. Given how hard it is to find deals and redeploy capital, GPs are increasingly reluctant to sell a company they believe has more room to run. Faced with the traditional threeto five-year timeline for buying and selling assets, a firm may feel the need to sell a partial stake to lock in gains or return capital to investors. Occasionally, the goal is to pass the asset from one fund to another, and selling a stake establishes the necessary arm’s-length valuation. In any of those cases, though, retaining a position keeps the firm involved in the company’s upside, often as majority shareholder.
20

vk.com/id446425943
Global Private Equity Report 2019
That was the strategy when Carlyle and Paris-based Montefiore Investment sold a 40% stake in European Camping Group (ECG) to the Ontario Teachers’ Pension Plan in April 2018. The PE owners had spent several years assembling ECG through a buy-and-build strategy and had faith that more time would allow them to unlock additional value. Selling a minority stake to a patient, long-term investor like Ontario Teachers’ monetized a significant portion of the investment. It also allowed Carlyle and Montefiore to retain majority control over ECG’s future. Following a similar logic, Hellman & Friedman sold a partial stake in insurance brokerage Hub International to Altas Partners in October 2018. After the minority investment, H&F remained Hub’s largest shareholder. Altas, a Toronto-based fund manager with a long-term orientation, said it plans to support the current strategy and management, which also invested in the deal. Selling a partial stake obviously doesn’t make sense for all assets. But when a portfolio company’s potential extends well beyond the five-year timeline, more firms are taking steps to ensure they aren’t bailing out too soon.
• • •
Fund-raising: The capital continues to flow
By historical standards, PE funds attracted an impressive amount of capital in 2018, although the pace slackened from 2017’s record-breaking performance. GPs raised $714 billion from investors during the year—the third-largest amount on record—bringing the total since 2014 to $3.7 trillion (see Figure 1.18).
Figure 1.18: While PE fund-raising fell off slightly in 2018, GPs have attracted more capital since 2014 than during any previous five-year stretch
Global PE capital raised, by fund type |
|
|
||
$1,000B |
|
|
|
|
800 |
|
|
|
|
|
677 |
695 |
|
|
600 |
542 |
|
574 |
|
|
|
|
||
|
|
|
446 |
|
400 |
362 |
|
392 |
|
324 |
320 |
|||
|
|
|||
200 |
219 |
|
|
|
105 |
|
|
||
|
|
|
||
0 |
|
|
|
|
|
|
855 |
|
|
|
794 |
Other |
|
|
714 |
|
661 |
697 |
Fund of funds |
|
|
Natural resources |
||
|
|
|
Secondaries |
|
|
|
Mezzanine |
|
|
|
Distressed PE |
|
|
|
Growth |
|
|
|
Venture capital |
|
|
|
Infrastructure |
|
|
|
Real estate |
|
|
|
Buyout |
2003 |
04 |
05 |
06 |
07 |
08 |
09 |
10 |
11 |
12 |
13 |
14 |
15 |
16 |
17 |
18 |
Notes: Includes funds with final close and represents the year in which funds held their final close; buyout includes buyout and balanced funds; distressed PE includes distressed debt, special situation and turnaround funds; other includes private investment in public equity and hybrid funds
Source: Preqin
21

vk.com/id446425943
Global Private Equity Report 2019
Buyout funds continued to draw the biggest share of capital, but investor interest during this record stretch has been broad and deep, benefiting all variety of funds.
The fund-raising peak in 2017 owed much to the closing of several of the largest buyout funds ever— the top three funds alone collected a staggering $57 billion in capital. Last year’s megafunds weren’t quite that big, but it would be hard to describe them as anything but massive. Carlyle Partners VII led the pack with $18.5 billion, followed closely by Hellman & Friedman Capital Partners IX with $16.0 billion and EQT VIII with $13.2 billion. Investors surveyed by Probitas Partners insisted they are turning their attention to smaller US buyout funds, US growth equity funds and European funds. Yet the strong performance by trusted managers continues to attract large flows of capital to megafunds, those raising $5 billion or more. Indeed, 2019 started off with a bang when Thoma Bravo closed its latest flagship fund at $12.6 billion, a big leap from the $7.6 billion it had raised for its previous flagship.
Emerging markets and the Asia-Pacific region were global fund-raising’s lone soft spots last year. Investors looking for diversification continue to be drawn to Asia-Pacific’s relatively strong long-term growth profile. But Greater China saw a massive decline in RMB fund-raising amid the central government’s decision to tighten rules on PE investment, part of an effort to rein in debt and reduce financial risk. Only 14% of funds raised globally in 2018 were focused on the Asia-Pacific region, down from 23% the year before.
Emerging markets and the Asia-Pacific region were global fund-raising’s lone soft spots last year. Overall, though, investor enthusiasm for private equity remains vibrant.
Overall, though, investor enthusiasm for private equity remains vibrant, and it’s easy to understand why. As we noted earlier, LPs have been cash flow positive on their PE positions for the past eight years. The asset class has outperformed others historically, and market analysts are almost unanimous in their opinion that private equity’s track record will continue. For LPs, the major challenge is keeping up with their gains. More than 90% of those surveyed by Preqin said they want to maintain or increase their capital contributions to private equity in coming years, and intend to maintain or increase their percentage allocations. Yet because distributions have been so robust and competition for new allocations is fierce, LPs have been unable to recycle gains fast enough to maintain their targets (see Figure 1.19).
Strong investor demand led to continued success on the fund-raising trail. Although the total number of PE funds closed during the year dropped in 2018, 56% of those seeking capital reached their goals (or were oversubscribed) within two years. For buyout funds, the pace was even faster—60% reached their goals within a year (see Figure 1.20). The average time on the road for all PE funds stayed the same at 16 months. Buyout funds are getting to close within 12 months on average.
22

vk.com/id446425943
Global Private Equity Report 2019
Figure 1.19: Institutional investors cannot pump their PE gains back into the industry fast enough to maintain their target allocations
Distribution of LPs, by fund-raising status |
|
|
|
|
|
|
|
||
100% |
|
|
|
|
|
|
|
|
|
|
|
|
|
|
|
|
|
|
Above |
|
|
|
|
|
|
|
|
|
target |
80 |
|
|
|
|
|
|
|
|
|
|
|
|
|
|
|
|
|
|
At |
60 |
|
|
|
|
|
|
|
|
target |
|
|
|
|
|
|
|
|
|
|
40 |
|
|
|
|
|
|
|
|
|
|
|
|
|
|
|
|
|
|
Below |
|
|
|
|
|
|
|
|
|
target |
20 |
|
|
|
|
|
|
|
|
|
0 |
|
|
|
|
|
|
|
|
|
2010 |
11 |
12 |
13 |
14 |
15 |
16 |
17 |
Start of |
End of |
|
|
|
|
|
|
|
|
2018 |
2018 |
|
|
|
At start of year |
|
|
|
|
|
|
Source: Preqin |
|
|
|
|
|
|
|
|
|
Figure 1.20: Buyout funds are reaching their targets faster than the overall industry
All PE funds
Distribution of funds closed, by target achievement
100%
80
60
40
20
0
2015
16 |
17 |
18 |
Year of final close

 Under target, or over 2 years to raise

 On target within 1–2 years

 On target within 1 year
Buyout funds
Distribution of funds closed, by target achievement
100%
80
60
40
20
0
2015
16 |
17 |
18 |
Year of final close

 Under target, or over 2 years to raise

 On target within 1–2 years

 On target within 1 year
Source: Preqin
23

vk.com/id446425943
Global Private Equity Report 2019
Moving beyond the core
Because LPs are constantly looking for new ways to invest with the firms they favor, GPs are expanding their menu of offerings. The number of funds per firm has increased steadily since the beginning of the current cycle, as GPs take careful steps to stretch beyond their core (see Figure 1.21). While these menu expansions typically depend on where the firm thinks it can best take advantage of its unique capabilities, we’ve seen heavy activity in three areas: sector-focused pools of capital, growth equity funds and long-duration funds. (For more on adjacency expansion, see page 58.)
The number of sector-focused funds in the market has grown sharply since the economy began its climb out of the global financial crisis in 2010. GPs have also raised pools of capital dedicated to specific sectors that can fly under the radar, such as sidecar funds or sleeves within funds. Specialization has become increasingly attractive as the market for deals has gotten more competitive. Specialized funds allow a GP and its investors to double down on areas in which the firm has deep expertise, strong conviction about assets and an extensive network that can surface attractive targets.
About half of the sector-specific funds on the market are dedicated to healthcare and technology investments. The superior growth characteristics of these two broad sectors have attracted PE investors for years, but they’ve become even more popular among LPs at a time when fears of an economic down-
Figure 1.21: Responding to market demand, buyout firms continue to add products to their slate of fund offerings
Average number of active funds per firm
4 |
|
|
|
|
|
|
|
|
3.7 |
3.9 |
3.9 |
|
|
|
|
|
|
|
|
|
|
|
|
|
|
|
|
|
|
|
|
3.5 |
|
|
|
|
|
|
|
|
|
|
3.1 |
|
|
|
|
3 |
2.9 |
2.9 |
2.8 |
|
2.7 |
2.7 |
|
|
|
|
|
|
|
|
2.6 |
|
|
|
|
|
|||
|
|
|
|
|
|
|
|
|
|
|
|
2.2 |
|
|
|
|
|
|
|
|
|
|
|
2 |
|
|
|
|
|
|
|
|
|
|
|
1 |
|
|
|
|
|
|
|
|
|
|
|
0 |
|
|
|
|
|
|
|
|
|
|
|
2007 |
08 |
09 |
10 |
11 |
12 |
13 |
14 |
15 |
16 |
17 |
18 |
Notes: Analysis includes 88 buyout firms that have closed more than $2 billion in buyout capital funds in the last five years; active funds defined as those having held a final close in the five years preceding each year; discrepancies in bar heights displaying the same value are due to rounding
Source: Preqin
24

vk.com/id446425943
Global Private Equity Report 2019
Figure 1.22: Strong returns and shelter against recession are attracting investors to healthcare and technology funds
Gross pooled MOIC, by sector, for global buyouts invested 2009–15
3x |
|
|
|
|
|
|
|
2 |
|
|
|
|
|
|
|
1 |
|
|
|
|
|
|
|
0 |
|
|
|
|
|
|
|
Healthcare |
Technology |
Financial |
Consumer |
Infrastructure |
Telecom |
Infrastructure |
Industrials |
|
|
services |
|
(economic) |
|
(social) |
|
Notes: Includes realized and unrealized buyout deals with invested equity capital of $50 million or more and initial investment between January 1, 2009, and December 31, 2015; MOIC stands for multiple of invested capital
Source: CEPRES PE.Analyzer
turn are prompting investors to look for cover. Healthcare and technology offer the holy trinity of strong growth, recession resistance and superior historical returns. In the current cycle, healthcare deals have returned $2.2 for every $1 of invested capital on a gross pooled basis, while technology deals have returned $2.1, according to CEPRES. Those multiples outshine valuations in every other sector (see Figure 1.22).
GPs catered to the high level of investor demand by launching a number of large sector-specific funds in 2018, including Thoma Bravo’s $2.4 billion Discover Fund II, focused on technology, and Linden Capital Partners’ $1.5 billion Fund IV, dedicated to healthcare. Healthcare and technology investments also figure prominently in another vibrant area for fund-raising—growth equity funds. Since 2014, GPs have raised $367 billion for these funds, which invest in companies that lie between ven- ture-backed firms and traditional buyout targets in terms of business maturity. (For more, see “Growth equity: Buyout-like returns with less leverage” on page 66.)
As we discussed in last year’s report, longer-duration funds are another way that PE firms are broadening their offerings. With attractive new targets harder and harder to find, more GPs are seeing the value of holding onto high-quality companies for as long as they keep generating value. Traditional buyout firms, of course, typically aim to acquire companies and sell them within three to five years. Not all assets, however, have reached their full potential within that time frame. Many are held by a
25

vk.com/id446425943
Global Private Equity Report 2019
Figure 1.23: Firms continue to experiment with fund duration and risk/return profile
|
Cranemere |
|
Altas Partners |
|
Blackstone |
|
|
KKR |
|
BlackRock |
|
|
|
|
|
|
|||||||
|
2012 |
|
2016 |
|
2017 |
|
2018 |
|
2018 (raising) |
||
|
|
|
Altas Partners Holdings |
|
Core Equity Partners |
|
|
Core Investment |
|
Long Term |
|
|
|
|
($1B) |
|
($5B) |
|
|
($8.5B) |
|
Private Capital |
|
|
|
|
CVC |
|
Vista Equity Partners |
|
|
CVC |
|
($10B) |
|
|
|
|
|
|
|
|
|
|
|||
|
|
|
2016 |
|
2017 (raising) |
|
|
2018 (raising) |
|
|
|
|
|
|
CVC Strategic |
|
Perennial Fund ($3B) |
|
|
CVC Strategic |
|
|
|
|
|
|
Opportunities (€3.9B) |
|
|
|
|
Opportunities II |
|
|
|
|
|
|
|
|
|
|
|
(€4B) |
|
|
|
|
|
|
|
|
|
|
|
|
|
|
|
|
|
|
|
|
|
|
|
|
|
|
|
|
|
|
|
|
|
|
|
|
|
|
|
|
|
|
|
|
|
|
|
|
|
|
|
|
Core Equity |
|
|
2017 |
Apollo |
|
Core Equity Holdings I |
|
|
(€1B) |
2018 (raising) |
Carlyle |
Cove Hill |
Hybrid Value ($3B) |
|
||
2016 |
2017 |
Partners Group |
Carlyle Global Partners |
Cove Hill Partners |
2018 (raising) |
($3.6B) |
Fund I ($1B) |
PG LIFE ($1B) |
Notes: Year represents year of final close for closed funds and year of formal announcement or first public reporting for raising funds; Blackstone Core Equity Partners has not held a final close but reportedly reached its target of $5 billion in 2017; for raising funds, value listed is the reported target amount
Sources: Preqin; literature search
succession of PE owners over a 15or 20-year period, generating value all along the way. For the original owner, that amounts to leaving money on the table.
Consequently, GPs are launching funds with longer investment time frames, a trend that accelerated in 2018 with large long-duration funds from firms like KKR, Partners Group and CVC (see Figure 1.23). This corner of the PE universe is still relatively small and untested. But it is growing steadily as investors come to appreciate its virtues—lower transaction costs, advantaged tax treatment, more flexibility to sell when the time is right, and capital that is fully invested over longer periods.
26