

9 11 2018 Consumer Update Smart Expansion
.pdfvk.com/id446425943
EQUITY RESEARCH  CONSUMER AND RETAIL
Russian Consumer and Retail Update
Smart Expansion Trumps Greedy Growth
FIVE LI |
|
|
|
|
|
|
|
|
BUY |
Target price |
|
|
|
|
|
|
|
$31.6 |
|
Potential upside |
|
|
|
|
|
|
|
29% |
|
|
|
|
|
|
|
|
|
|
|
MGNT LI |
|
|
|
|
|
|
|
|
BUY |
Target price |
|
|
|
|
|
|
|
$18.0 |
|
Potential upside |
|
|
|
|
|
|
|
27% |
|
|
|
|
|
|
|
|
|
|
|
MGNT RX |
|
|
|
|
|
|
|
|
BUY |
Target price |
|
|
|
|
|
|
RUB4 970 |
||
Potential upside |
|
|
|
|
|
|
|
34% |
|
|
|
|
|
|
|
|
|
|
|
LNTA LI |
|
|
|
|
|
|
|
|
HOLD |
Target price |
|
|
|
|
|
|
|
$4.0 |
|
Potential upside |
|
|
|
|
|
|
|
9% |
|
|
|
|
|
|
|
|
|
|
|
OKEY LI |
|
|
|
|
|
|
|
|
SELL |
Target price |
|
|
|
|
|
|
|
$1.4 |
|
|
|
|
|
|
|
|
|
|
|
Potential upside |
|
|
|
|
|
|
|
-10% |
|
|
|
|
|
|
|
|
|
|
|
|
|
MGNT |
|
|
FIVE |
|
LNTA |
|
O'KEY |
|
|
|
|
|
|
|
|
|
|
Price (GDR,$) |
|
18.0 |
|
31.6 |
|
4.0 |
|
1.4 |
|
Market Cap |
7 068 |
|
6 675 |
1 810 |
425 |
||||
($mn) |
|
||||||||
|
|
|
|
|
|
|
|
|
|
Free float (%) |
|
65% |
|
41% |
|
58% |
|
20% |
|
Free float mkt |
4 594 |
|
2 737 |
1 050 |
85 |
||||
cap ($mn) |
|
||||||||
|
|
|
|
|
|
|
|
|
|
|
|
|
|
|
|
|
|
|
|
Financials 18E |
|
MGNT |
|
|
FIVE |
|
LNTA |
|
O'KEY |
RUBbn |
|
|
|
|
|
||||
|
|
|
|
|
|
|
|
|
|
Revenue |
|
1 235 |
|
1 530 |
|
416 |
|
168 |
|
EBITDA |
91.6 |
|
107.6 |
38.1 |
7.8 |
||||
|
|
|
|
|
|
||||
EBIT |
|
57.7 |
|
61.1 |
|
26.8 |
|
3.3 |
|
Net income |
36.6 |
|
33.4 |
13.7 |
0.2 |
||||
|
|
|
|
|
|
|
|
|
|
|
|
MGNT |
|
|
FIVE |
|
LNTA |
|
O'KEY |
P/E (x) |
12.8 |
|
13.2 |
8.8 |
|
n/a |
|||
|
|
|
|
|
|
||||
EV/EBITDA (x) |
|
6.3 |
|
6.0 |
|
5.9 |
|
7.7 |
|
EV/Sales (x) |
0,5 |
|
0,4 |
0,5 |
0,4 |
||||
|
|
|
|
|
|
||||
RoIC (%) |
|
12.7% |
|
13.2% |
|
12.4% |
|
5.6% |
|
Performance |
|
MGNT |
|
|
FIVE |
|
LNTA |
|
O'KEY |
1 month (%) |
|
4% |
|
19% |
|
6% |
|
6% |
|
3 month (%) |
-16% |
|
-6% |
-26% |
-19% |
||||
|
|
|
|
|
|
||||
YTD (%) |
|
-49% |
|
-35% |
|
-36% |
|
-37% |
|
52-week high,$ |
30 |
|
44.6 |
7.3 |
2.8 |
||||
|
|
|
|
|
|
||||
52-week low,$ |
|
12 |
|
19.1 |
|
3.2 |
|
1.4 |
|
|
|
Source: Bloomberg, ATON Research |
|||||||
Figure 1: Russian retailers’ stock performances
20% |
|
|
|
|
0% |
|
|
|
|
-20% |
|
|
|
|
-40% |
|
|
|
|
-60% |
|
|
|
|
Nov-17 |
Feb-18 |
May-18 |
Aug-18 |
Nov-18 |
MGNT LI |
|
MGNT RX |
|
FIVE LI |
|
|
|||
LNTA LI |
|
OKEY LI |
|
|
|
|
|
Source: Bloomberg, ATON Research
©2018 ATON LLC. All rights reserved
©2017 ATON LLC. All rights reserved
Russian Grocers: Downgrade Cycle Coming to an End. Time for a Fresh Look?
The Russian grocery sector has been among the Russian stock market’s worst performers in 2018 with share prices declining between 35% and 49% YtD vs a flat overall market. Derating multiples, earnings falling on record-low food inflation, and expectations deteriorating as the sector’s promo activity soared explain the weak stock performance, but we believe this is mostly priced-in. Key food prices have finally started to climb (wheat + 17% YoY, pork +10% YoY, sugar +41% YoY), promotion activity is stabilising, and sector companies are much more focused on improving efficiency, suggesting that they will enjoy tailwinds in 2019. Earnings growth (14% to 20%), decent dividend yields (3.5% and 5.5%) and historically high valuation discounts will increasingly attract investor attention, and in turn further buoy its performance.
Industry Maturing, But Risks of Stronger Competition Overstated
The share of modern retail now exceeds 70%, a sure sign of Russian grocery market maturity. However, sector concentration is low: the top five players’ combined market share is only 29%. As a result, investors’ concerns that sector companies do not have scope for expansion, are exaggerated, in our view. While space growth will be slower (on average 23% in 2018-21 vs 90% in 2014-17), companies with scale and proven business models will still be able to expand, and market leaders Magnit and X5 will extend their market share leadership margins. At the same time, growth will have to be
“smarter” and mainly focused on differentiation and higher customer loyalty.
Valuations in Deep Value Territory, Positive Catalysts Increasingly Likely
The sector is trading at significant discounts to its historical levels (23-48%) – distressed levels, which we do not regard as justified given the sector’s fundamentals and growing FCF. The companies’ scale and their slower growth have already been reflected in positive FCF (yields of 4.3% to 14.9% in 2019) prompting more generous dividends (RUB38bn paid out in 2018) and buybacks (RUB34.3bn announced YtD).
Uneven Performances, Hypermarkets the Laggards but to Pay Higher Dividends
Growth in Russia’s maturing market will have varying implications for the different formats. Hypermarket segment growth is coming to a halt, and we see this segment as the key drag on the sector’s performance. Mounting competition with smaller formats
(convenience stores and supermarkets – mainly on pricing) as well as booming e- commerce will increasingly divert traffic from hypermarkets. Consequently, greater hypermarket exposure will increasingly be considered a risk. Nonetheless, hypermarket retailers’ poorer growth prospects may actually drive more aggressive return on capital to shareholders thanks to dividends and buybacks.
Top Picks: X5 Still Our Preferred Exposure: Balanced Growth and Efficiency in Focus; Magnit a Likely Turnaround Story…But Still in its Early Days
X5 has outlined a more balanced openings approach (2k gross in 2019E vs 2.5k in 2018E), and shifted its focus to retaining loyal customers and improving internal efficiency. With 83% of supermarkets refurbished as of 9M18, an extended product range, in-house production and innovative technological solutions, we expect the company to outperform peers operationally in 2019. We are cautiously optimistic about
Magnit’s turnaround but the implementation of its new strategy should eventually yield results. The low base of 2016-2018 and higher inflation should boost its financials.
We have incorporated into our model a higher risk-free rate (8.5%) and the new USD/RUB exchange rate. Our updated model results in BUYs for X5 retail Group and Magnit (TP of $31.6 and $18.0, potential upside of 29% and 27% respectively), a HOLD for Lenta (TP of $4.0; 9% upside) and a SELL for O’KEY (TP $1.4; 10% downside).
Victor Dima |
|
Anna Butko |
||
+7 (495) 213-03-44 |
+7 (495) 777-90-90, Ext: 3661 |
|||
Victor.Dima@aton.ru |
|
Anna.Butko@aton.ru |
|
|
|
|
|||
|
|
|
|
|
vk.com/id446425943 |
2 |
|
EQUITY RESEARCH |
CONSUMER AND RETAIL |
|
Challenging Macroeconomic Outlook: No Easy Gains
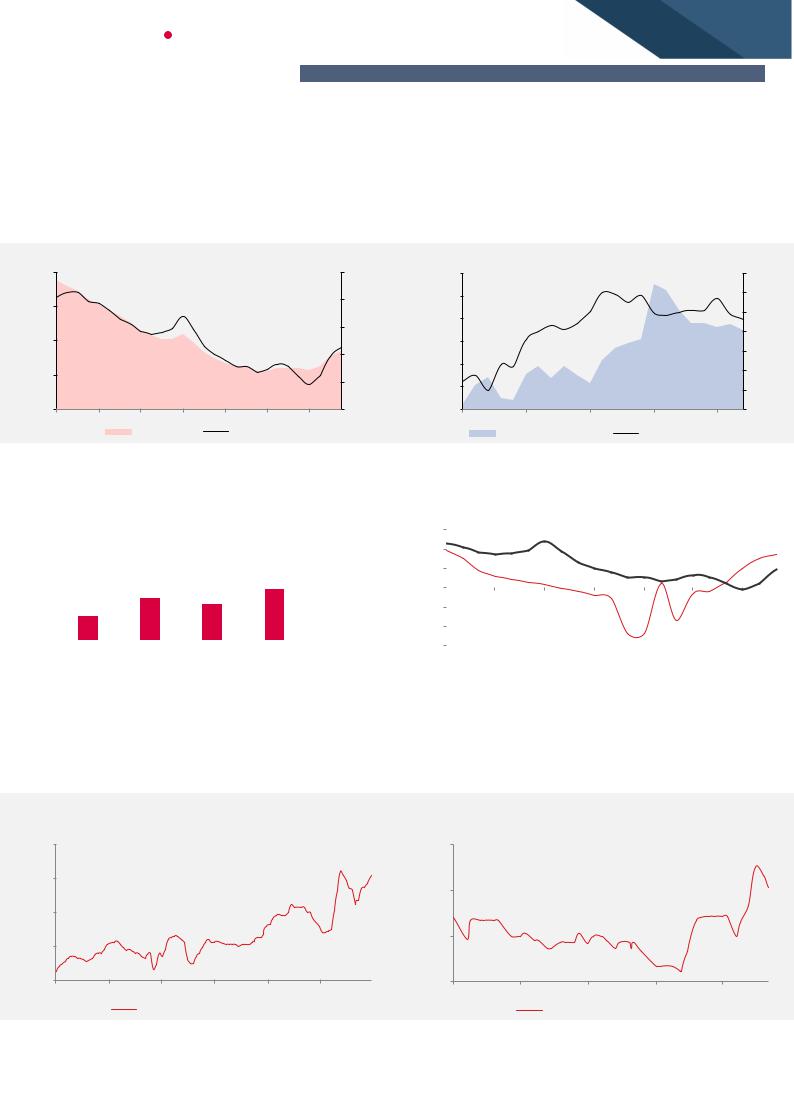
No relief in 9M18; tough macro persists. Retailers’ 9M18 performances remained under pressure. Russian real wage growth was 8.2% in the period, but despite this, retail sales softened after a promising acceleration in 4Q17 (average growth of 2.6% in 9M18). Food retail sales growth fell even lower (1.8% average for 9M18). Food CPI remains low, but did improve significantly in 3Q18 (from 0.4% in 2Q to 1.6% in 3Q). We believe that a more benign macro environment and a greater level of confidence is required to boost the consumer staples market.
Figure 2: Food CPI turned negative in 2Q18 while consumer CPI in |
Figure 3: Retail food sales remain in positive territory supported |
Russia indicated slight QoQ acceleration |
by real wage expansion |
8% |
|
8% |
6% |
|
6% |
|
|
|
|
|
4% |
4% |
|
|
|
|
2% |
2% |
|
0% |
|
|
|
0% |
|
-2% |
Jun-16 |
Oct-16 Feb-17 Jun-17 |
Oct-17 Feb-18 Jun-18 |
|
CPI |
Food CPI (RHS) |
12% |
|
|
|
6% |
10% |
|
|
|
4% |
|
|
|
|
|
8% |
|
|
|
2% |
|
|
|
|
|
|
|
|
|
0% |
6% |
|
|
|
|
|
|
|
|
-2% |
4% |
|
|
|
-4% |
|
|
|
|
|
2% |
|
|
|
-6% |
|
|
|
|
|
0% |
|
|
|
-8% |
Oct-16 |
Mar-17 |
Aug-17 |
Jan-18 |
Jun-18 |
|
Real wage growth |
Retail sales food (RHS) |
||
|
|
|
|
Source: Bloomberg, ATON Research |
|
|
|
|
|
|
|
Source: Bloomberg, ATON Research |
|||||||||
|
|
|
|
|
|
|
|
|
|
|
|
|
|
||||||||
|
Figure 4: … though Russian customers remain price sensitive with |
|
|
Figure 5: We expect CPI to correspond with PPI dynamics with a |
|||||||||||||||||
|
respect to grocery sales |
|
|
|
|
|
|
|
|
lag |
|
|
|
|
|
|
|||||
|
Share of grocery sales in |
|
|
37% |
|
|
|
|
|
|
|
|
|
|
|
|
|
|
|||
|
total consumption |
|
|
|
|
|
|
|
|
|
|
|
|
|
|
|
|
|
|||
|
|
|
|
|
|
|
|
|
6% |
|
|
|
|
|
|
|
|
|
|||
|
|
|
|
|
|
|
|
|
|
|
|
|
|
|
|
|
|
||||
|
|
|
|
|
|
|
|
|
|
|
4% |
|
|
|
|
|
|
|
|
|
|
|
|
|
|
|
|
|
|
|
|
|
2% |
|
|
|
|
|
|
|
|
|
|
|
|
|
14% |
|
17% |
|
|
|
|
|
0% |
|
|
|
|
|
|
|
|
|
|
|
|
|
12% |
|
|
|
|
|
|
|
|
|
|
|
|
|
|
|
|||
|
|
|
|
|
|
|
|
|
|
|
|
|
|
|
|
|
|
||||
|
|
|
|
|
|
|
|
|
|
|
|
|
|
|
|
|
|
|
|
|
|
8% |
|
|
|
|
|
|
|
|
-2% |
|
|
|
|
|
|
|
|
|
|||
|
|
|
|
|
|
|
|
|
|
|
-4% |
|
|
|
|
|
|
|
|
|
|
|
|
|
|
|
|
|
|
|
|
|
-6% |
|
|
|
|
|
|
|
|
|
|
|
|
US |
Germany |
UK |
Japan |
Russia |
|
|
|
|
|
|
|
|
|
|
|||||
|
|
|
|
|
|
|
|
|
|
|
|
||||||||||
|
|
|
|
Dec-16 Mar-17 |
Jun-17 |
Sep-17 |
Dec-17 Mar-18 |
Jun-18 |
|||||||||||||
|
|
|
|
|
|
|
|
|
|
|
|
||||||||||
|
|
|
|
|
|
|
|
|
|
|
|
|
|
|
PPI Food Production |
|
Russia CPI Food |
|
|
||
|
|
|
|
|
|
|
|
|
|
|
|
|
|
|
|
|
|
||||
|
|
|
|
|
|
|
|
|
|
|
|
|
|
|
|
|
|
|
|
|
|
|
|
|
Source: BCG Consumption survey, ATON Research |
|
|
|
|
|
|
|
Source: Bloomberg, ATON Research |
||||||||||
Food CPI should continue to accelerate later in the year supported by improving soft commodity prices. The latest soft commodity trends point to the very low food inflation cycle coming to an end. With CPI dynamics catching up with those of PPI with a lag, we expect to see further CPI food acceleration later in the year.
Figure 6: The Russian export wheat price has begun to grow (+16% since end of June)
250
230
210
190
170 |
|
|
|
|
|
Oct-16 |
Feb-17 |
Jun-17 |
Oct-17 |
Feb-18 |
Jun-18 |
Wheat 12.5% FOB Novorossiysk spot
Source: Bloomberg, ATON Research
Figure 7: Meat prices also expanding (pork +5% since end of June)
195
180
165
150 |
|
|
|
|
Oct-16 |
Mar-17 |
Aug-17 |
Jan-18 |
Jun-18 |
Moscow pork wholesale price incl VAT
Source: Bloomberg, ATON Research
© 2018 ATON LLC. All rights reserved
vk.com/id446425943 |
3 |
|
EQUITY RESEARCH |
CONSUMER AND RETAIL |
|
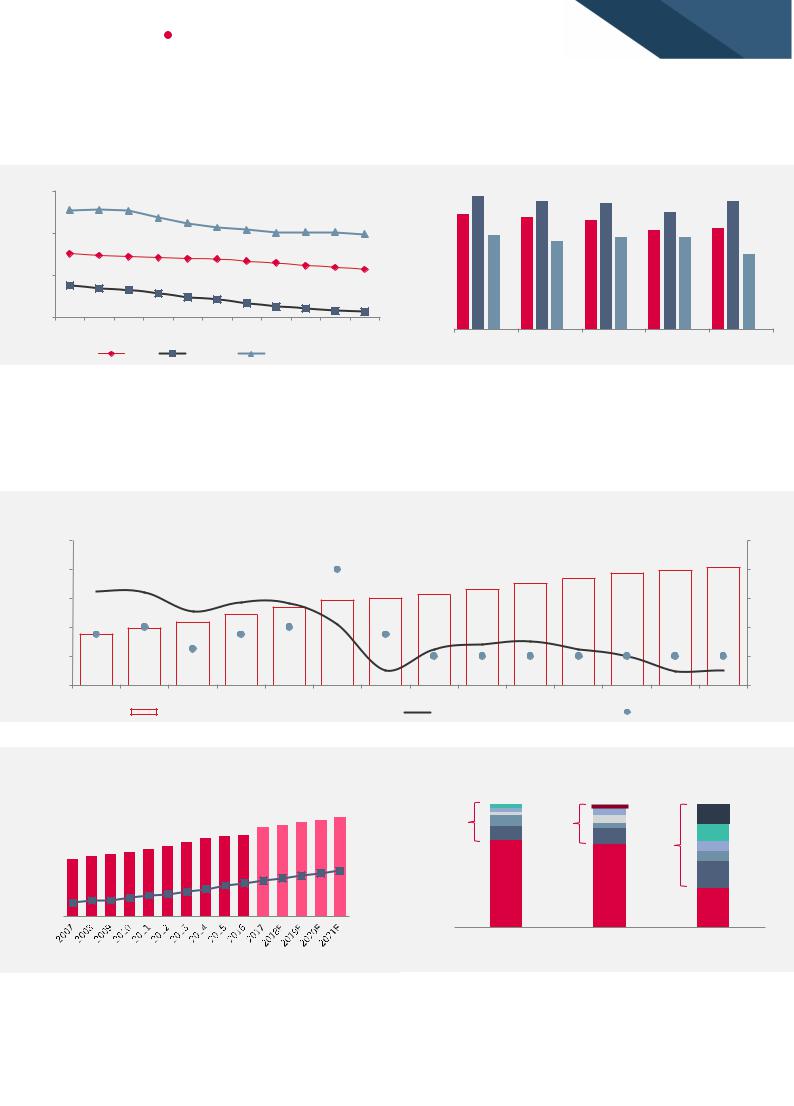
High share of promotions still key disruptor for mass market grocers. A 30-40% share of promotions in total SKUs remains the key challenge for mass market grocers. The respective companies do not see this share growing YoY, but unwinding this elevated share will not be easy as it will require market discipline from all the main players.
Figure 8: Major retailers experiencing falling sales density… |
Figure 9:… focusing on internal efficiencies to support margins |
|
|
350 |
327 |
328 |
326 |
|
|
|
|
|
|
|
|
|
318 |
|
|
|
|
|
|
|
|||
|
|
|
|
312 |
|
|
|
|
|
|
|
|
|
|
|
|
307 |
304 |
|
301 |
301 |
|
|
|
|
|
|
|
|
301 |
299 |
||||
|
|
|
|
|
|
|
|||||
|
|
|
|
|
|
|
|
||||
300 |
276 |
274 |
|
|
|
|
|
|
|
|
|
|
272 |
271 |
270 |
269 |
267 |
|
|
|
|
||
|
|
265 |
262 |
259 |
|
||||||
|
|
|
|
|
|
|
257 |
||||
|
|
|
|
|
|
|
|
|
|||
250 |
238 |
235 |
233 |
229 |
|
|
|
|
|
|
|
|
224 |
|
|
|
|
|
|
||||
|
|
|
|
221 |
|
|
|
|
|
||
|
|
|
|
|
217 |
|
|
|
|
||
|
|
|
|
|
|
213 |
211 |
|
|
||
|
|
|
|
|
|
|
208 |
207 |
|||
|
|
|
|
|
|
|
|
||||
|
|
|
|
|
|
|
|
|
|
||
200 |
|
|
|
|
|
|
|
|
|
|
|
|
1Q16 |
2Q16 |
3Q16 |
4Q16 |
1Q17 |
2Q17 |
3Q17 |
4Q17 |
1Q18 2Q18 |
3Q18 |
|
ths RUB per sqm |
|
X5 |
|
Magnit |
|
Lenta |
|
|
|
||
41,6 |
40,7 |
40,5 |
|
40,8 |
|
|
|||
38,7 |
38,1 |
37,7 |
|
38,9 |
|
|
|
||
|
|
|
36,4 |
|
35,2 |
|
34,9 |
36,1 |
|
34,2 |
34,9 |
32,2
|
1H16 |
|
2H16 |
1H17 |
2H17 |
1H18 |
||
|
X5 |
|
Lenta |
|
Magnit |
SG&A excl rent and utilities per sqm |
||
|
|
|
||||||
|
|
|
||||||
Source: Company data, ATON Research |
Source: Company data, ATON Research |
Russian retail industry entering maturity, but still offers plenty of growth opportunities for select players with scale and proven business models. The share of modern retail exceeded 70% in 2017 in Russia, while the concentration level remains low (the top-five players account for only 29% of the market). That leaves plenty of scope for major players to gain market share and expand in the key regions.
Figure 10: Russian food retail industry entering maturity with restricted growth opportunities and tough macro environment…
20 |
|
|
|
|
|
|
|
|
|
|
|
|
|
20% |
|
|
|
|
|
|
16% |
|
|
|
|
|
15,5 |
15,8 |
16,2 |
16 |
|
|
|
|
|
|
|
|
|
14,7 |
16% |
|||
|
|
|
|
|
|
|
|
13,2 |
14 |
|
|
|||
|
|
|
|
|
|
|
|
|
|
|
|
|
||
|
|
|
|
|
|
|
12 |
12,5 |
|
|
|
|
|
|
|
|
|
|
|
|
11,7 |
|
|
|
|
|
|
||
12 |
|
|
|
|
10,8 |
|
|
|
|
|
|
12% |
||
|
|
|
|
|
|
|
|
|
|
|
|
|||
|
|
|
|
|
|
|
|
|
|
|
|
|
||
|
|
7,9 |
8,7 |
9,7 |
|
|
|
|
|
|
|
|
|
|
|
7 |
|
|
|
|
|
|
|
|
|
|
|
||
8 |
|
|
|
|
|
|
|
|
|
|
|
|
8% |
|
|
|
|
|
|
|
|
|
|
|
|
|
|
||
|
7% |
8% |
|
7% |
8% |
|
7% |
|
|
|
|
|
|
|
4 |
|
|
|
|
|
|
|
|
|
|
4% |
|||
|
|
5% |
|
|
|
|
|
|
|
|
|
|
||
|
|
|
|
|
|
|
4% |
|
4% |
|
4% |
|
4% |
|
|
|
|
|
|
|
|
|
|
|
|
||||
0 |
|
|
|
|
|
|
|
|
|
|
|
|
|
0% |
|
2010 |
2011 |
2012 |
2013 |
2014 |
2015 |
2016 |
2017 |
2018 |
2019 |
2020 |
2021 |
2022 |
2023 |
|
|
|
Russian grocery retail market (RUB trn) ex. VAT |
|
YoY Retail growth (RHS) |
|
|
CPI (RHS) |
|
|||||
Source: Bloomberg, Companies presentations, ATON Research
Figure 11: Though there is still room for modern retailing expansion and industry consolidation…
100%
80%
60%
40%
20%
0%
 Modern grocery retailers, %
 Market share of major retailers
Source: Infoline, Company data, ATON Research
Figure 12:…with the top players accounting for 29% market share
29% |
32% |
68%
|
|
Russia |
|
|
Moscow |
|
St. Pete |
|||||||||
|
Other |
|
X5 |
|
|
Magnit |
|
Auchan |
|
Dixy |
|
Lenta |
|
Meto |
|
OKEY |
|
|
|
|
|
|
|
|
|||||||||
|
|
|
|
|
|
|
|
|||||||||
Source: Company data, ATON Research
|
Internal efficiencies in focus. The major players are currently reconsidering their |
|
strategies, shifting from rapid expansion to targeting efficiency in order to support |
|
margins. Operating efficacy will be tackled first, starting with renegotiating lease rates, |
|
raising productivity, improving logistics, and lowering shrinkage. However, we see the |
© 2018 ATON LLC. All rights reserved |
most potential in enhancing personnel efficiency. |

vk.com/id446425943 |
|
|
|
|
|
|
|
|
||||||||
|
EQUITY RESEARCH |
|
CONSUMER AND RETAIL |
|
|
|
|
|
|
|||||||
|
Figure 13: Russian retailers have room to improve internal efficiency |
|
|
|
|
|||||||||||
|
|
|
|
|
||||||||||||
per |
0,05 |
|
|
Perekrestok |
|
|
|
|
|
|
|
|
||||
|
|
|
|
|
|
|
|
|
|
|||||||
|
|
|
|
|
|
|
|
|
|
|
|
|
|
|||
|
|
|
|
|
|
|
|
|
|
|
Kaufland |
|
|
|
||
employees |
0,04 |
|
|
|
|
|
|
|
|
|
|
|
Lenta |
|
||
|
DA! |
|
|
Lenta |
|
Karusel |
|
|
|
|
|
|||||
0,04 |
|
|
|
|
|
|
|
|
hypermarkets |
|
||||||
|
|
|
Pyaterochka |
|
|
supermarkets |
|
|
|
|
|
|
|
|
||
|
|
0,03 |
|
|
|
|
|
|
|
|
|
|
|
|
|
|
|
|
|
|
|
|
|
|
|
|
|
|
|
|
|
|
|
numberof sqm |
0,03 |
|
Carrefour |
|
|
|
|
|
|
|
Carrefour hypermarkets |
|
||||
|
Convenience store |
|
|
|
|
|
||||||||||
0,02 |
|
|
|
|
|
|
|
|
|
|||||||
|
Small Lidl |
|
|
|
|
|
|
|
|
|
|
|
||||
|
|
0,02 |
|
|
|
|
Carrefour |
|
Carrefour |
|
|
Real Germany |
|
|
||
|
|
|
|
|
|
|
|
|
|
|
|
|||||
|
|
|
|
|
|
|
|
|
|
|
|
|
|
|||
Average |
|
|
|
|
|
supermarket |
mini-hypermarkets |
|
|
|
|
|
|
|||
0,01 |
|
ALDI |
|
Large Lidl |
|
|
|
|
|
|
|
|
||||
|
|
|
|
|
|
|
|
|
|
|
|
|||||
|
|
0,01 |
|
|
|
|
|
|
|
|
|
|
|
|
||
|
|
|
|
|
|
|
Smaller formats |
|
|
|
|
|
|
|
|
|
|
|
0,00 |
|
|
|
|
|
|
|
|
|
|
|
|
|
|
|
|
-30 |
|
20 |
|
70 |
120 |
170 |
220 |
|||||||
|
|
|
|
|
||||||||||||
|
|
|
|
|
|
|
|
|
|
Average number of employees per store |
|
|
||||
4
O'KEY
Larger formats
270
Source: Company data, ATON Research
Online no longer a side strategy… Though the online share of grocery sales is still small, it is growing fast and is set to become one of the main drivers of Russian e-commerce. X5 has made the greatest progress in the development of the omni-channel business model, culminating in the launch of Perekrestok online (number of orders per day estimated to reach 2.5k by YE18) and plans to expand the pilot to St. Petersburg (Pyaterochka is to follow starting from 2019). Magnit indicated its intention to develop the omni-channel concept by 2Q19, while O’KEY is exploring the viability of dark stores in order to boost the number of orders processed from the current 150-200 per store.
Figure 14: With the Russian e-commerce market’s growth estimated at 20.2% in FY18, e-commerce penetration remains the lowest among all FMCG categories and represents a vast opportunity for key retailers with efficient logistics
28%
E-commerce penetration, %
|
|
|
|
|
7% |
7% |
8% |
|
|
|
|
|
|
|
|
||
|
|
3% |
4% |
4% |
|
|
|
|
|
<1% |
|
|
|
|
|
|
|
|
|
|
|
|
|
|
|
|
|
|
|
|
|
|
|
|
|
|
Grocery |
Pharmacy |
Petcare |
Beauty and |
Kids |
Fashion |
Home and |
Electronics& |
|
|
|
|
wellness |
|
|
Garden |
computers |
Source: eMarketer, ACIT, ATON Research
© 2018 ATON LLC. All rights reserved

vk.com/id446425943 |
|
|
|
|
|
|
|
|
|
|
|
|
|
|
|
|
|
|
|
|
|
|
|
|
|
|
|
|
|
|
|
|
|
|
5 |
|
|||||
|
EQUITY RESEARCH |
|
CONSUMER AND RETAIL |
|
|
|
|
|
|
|
|
|
|
|
|
|
|
|
|
|
|
|
|
|
|
|
|
|
|
||||||||||||
|
Figure 15: Russian retailers comp’s sheet |
|
|
|
|
|
|
|
|
|
|
|
|
|
|
|
|
|
|
|
|
|
|
|
|
|
|
|
|
|
|
|
|
||||||||
|
Company |
|
|
CUR |
|
|
Price |
|
Mcap, USDmn |
|
|
P/E |
|
|
|
|
EV/EBITDA |
|
EV/Sales |
|
|
|
EPS Growth |
|
Div Yield |
||||||||||||||||
|
|
|
|
|
|
|
|
|
|
|
|
|
|
|
|
|
|
|
|
|
|
|
|
|
|
|
|
|
|
|
|
|
|
|
|
|
|
|
|
|
|
|
|
|
|
|
|
|
|
|
|
|
|
|
2018E |
|
2019E |
|
2018E |
|
2019E |
|
2018E |
|
|
2019E |
|
2018E |
|
2019E |
|
2018E |
|
2019E |
|||||||||
|
|
|
|
|
|
|
|
|
|
|
|
|
|
|
|
|
|
|
|
|
|
|
|||||||||||||||||||
|
|
|
|
|
|
|
|
|
|
|
|
|
|
|
|
|
|
|
|
|
|
|
|
|
|
|
|
|
|
|
|
|
|
|
|
|
|
|
|
|
|
|
X 5 RETAIL GROUP |
|
USD |
|
24.5 |
|
|
6675 |
|
13.2 |
|
11.0 |
|
|
6.0 |
|
|
5.3 |
|
0.4 |
|
|
0.4 |
|
6.5% |
|
20.3% |
|
4.5% |
|
5.5% |
|
|||||||||
|
MAGNIT PJSC |
|
|
RUB |
3720 |
|
|
5733 |
|
10.4 |
|
9.0 |
|
|
5.3 |
|
4.6 |
0.4 |
|
0.4 |
3.1% |
15.9% |
4.4% |
4.5% |
|
||||||||||||||||
|
|
|
|
|
|
|
|
|
|
|
|
|
|
|
|
|
|
|
|
|
|
|
|
|
|
|
|
|
|
|
|
|
|
||||||||
|
MAGNIT PJSCGDR |
|
USD |
|
14.18 |
|
|
7068 |
|
12.8 |
|
11.0 |
|
|
6.3 |
|
|
5.4 |
|
0.5 |
|
|
0.4 |
|
3.1% |
|
15.9% |
|
3.4% |
|
3.5% |
|
|||||||||
|
LENTA |
|
|
USD |
3.68 |
|
|
1810 |
|
8.8 |
|
7.7 |
|
|
5.9 |
|
5.5 |
0.5 |
|
0.5 |
3.3% |
13.9% |
|
n/a |
|
n/a |
|||||||||||||||
|
|
|
|
|
|
|
|
|
|
|
|
|
|
|
|
|
|
|
|
|
|
|
|
|
|
|
|
|
|
|
|
|
|
|
|||||||
|
O'KEY GROUP |
|
USD |
|
1.56 |
|
|
425 |
|
|
|
n/a |
|
29.8 |
|
|
7.7 |
|
|
6.8 |
|
0.4 |
|
|
0.3 |
|
|
n/a |
|
n/a |
|
7.3% |
|
1.3% |
|
||||||
|
RUSSIA |
|
|
|
|
|
|
|
|
|
|
11.9 |
|
10.6 |
|
|
5.9 |
|
|
5.2 |
|
0.4 |
|
|
0.4 |
|
4.2% |
|
17.1% |
|
4.2% |
|
4.4% |
|
|||||||
|
SHOPRITE |
|
|
ZAr |
|
19811 |
|
|
8132 |
|
18.4 |
|
17.9 |
|
|
11.1 |
|
10.3 |
|
0.8 |
|
|
0.7 |
|
1.1% |
|
n/a |
|
2.7% |
|
2.8% |
|
|||||||||
|
PICK N PAY STORES |
|
ZAr |
7265 |
|
|
2558 |
|
22.7 |
|
19.8 |
|
|
10.9 |
9.9 |
0.4 |
|
0.4 |
13.6% |
|
n/a |
3.0% |
3.4% |
|
|||||||||||||||||
|
|
|
|
|
|
|
|
|
|
|
|
|
|
|
|
|
|
|
|
|
|
|
|
|
|
|
|
|
|
|
|
|
|
|
|||||||
|
SPAR GROUP |
|
|
ZAr |
|
18917 |
|
|
2522 |
|
17.2 |
|
15.4 |
|
|
11.4 |
|
10.4 |
|
0.4 |
|
|
0.4 |
|
7.9% |
|
n/a |
|
4.0% |
|
4.5% |
|
|||||||||
|
WOOLWORTHS |
|
ZAr |
5621 |
|
|
4092 |
|
14.4 |
|
13.4 |
|
|
8.7 |
|
8.3 |
1.0 |
|
0.9 |
-4.5% |
|
n/a |
4.8% |
5.1% |
|
||||||||||||||||
|
|
|
|
|
|
|
|
|
|
|
|
|
|
|
|
|
|
|
|
|
|
|
|
|
|
|
|
|
|
|
|
|
|
|
|
||||||
|
SOUTH AFRICA |
|
|
|
|
|
|
|
|
|
17.9 |
|
16.8 |
|
|
10.5 |
|
9.8 |
|
0.7 |
|
|
0.7 |
|
2.6% |
|
n/a |
|
3.4% |
|
3.7% |
|
|||||||||
|
MIGROS TICARET |
|
TRY |
16.13 |
|
|
533 |
|
|
|
n/a |
64.5 |
|
|
6.3 |
|
5.3 |
0.3 |
|
0.3 |
-179.3% |
-109.0% |
0.0% |
0.0% |
|
||||||||||||||||
|
|
|
|
|
|
|
|
|
|
|
|
|
|
|
|
|
|
|
|
|
|
|
|
|
|
|
|
|
|
|
|
|
|
||||||||
|
BIM BIRLESIK |
|
|
TRY |
|
77.7 |
|
|
4309 |
|
21.4 |
|
18.1 |
|
|
13.5 |
|
11.4 |
|
0.7 |
|
|
0.6 |
|
29.4% |
|
18.2% |
|
2.8% |
|
3.4% |
|
|||||||||
|
BIZIM TOPTAN |
|
TRY |
7.05 |
|
|
77 |
|
22.6 |
|
17.3 |
|
|
2.4 |
|
2.0 |
0.1 |
|
0.1 |
-167.5% |
30.8% |
0.8% |
0.8% |
|
|||||||||||||||||
|
|
|
|
|
|
|
|
|
|
|
|
|
|
|
|
|
|
|
|
|
|
|
|
|
|
|
|
|
|
|
|
|
|
||||||||
|
EUROCASH SA |
|
PLN |
|
20.3 |
|
|
763 |
|
24.9 |
|
18.2 |
|
|
9.0 |
|
|
7.6 |
|
0.2 |
|
|
0.1 |
|
37.0% |
|
36.7% |
|
3.4% |
|
3.3% |
|
|||||||||
|
JERONIMO MARTINS |
|
EUR |
10.815 |
|
|
7760 |
|
16.3 |
|
15.0 |
|
|
7.5 |
|
7.0 |
0.4 |
|
0.4 |
-1.0% |
9.2% |
|
4.3% |
3.9% |
|
||||||||||||||||
|
|
|
|
|
|
|
|
|
|
|
|
|
|
|
|
|
|
|
|
|
|
|
|
|
|
|
|
|
|
|
|
|
|
||||||||
|
SAVOLA |
|
|
SAR |
|
27.85 |
|
|
3964 |
|
39.2 |
|
24.1 |
|
|
18.9 |
|
14.6 |
|
1.0 |
|
|
1.0 |
|
-56.5% |
|
62.7% |
|
2.9% |
|
2.6% |
|
|||||||||
|
ABDULLAH AL |
|
SAR |
70.5 |
|
|
1691 |
|
15.2 |
|
14.4 |
|
|
12.5 |
11.0 |
0.8 |
|
0.7 |
26.8% |
5.2% |
|
2.6% |
3.5% |
|
|||||||||||||||||
|
|
|
|
|
|
|
|
|
|
|
|
|
|
|
|
|
|
|
|
|
|
|
|
|
|
|
|
|
|
|
|
|
|
|
|||||||
|
MENA/EMERGING EUROPE |
|
|
|
|
|
|
|
|
|
22.7 |
|
19.0 |
|
|
11.7 |
|
9.9 |
|
0.6 |
|
|
0.6 |
|
-7.4% |
|
19.9% |
|
3.3% |
|
3.5% |
|
|||||||||
|
CP ALL PCL |
|
|
THB |
68 |
|
|
18551 |
|
29.3 |
|
25.6 |
|
|
18.0 |
16.5 |
1.5 |
|
1.4 |
7.4% |
14.2% |
1.7% |
1.9% |
|
|||||||||||||||||
|
|
|
|
|
|
|
|
|
|
|
|
|
|
|
|
|
|
|
|
|
|
|
|
|
|
|
|
|
|
|
|
|
|
||||||||
|
PUREGOLD PRICE CLUB I |
|
PHP |
|
43 |
|
|
2250 |
|
18.3 |
|
16.4 |
|
|
10.8 |
|
9.7 |
|
0.9 |
|
|
0.8 |
|
7.0% |
|
11.4% |
|
0.9% |
|
1.1% |
|
||||||||||
|
DAIRY FARM |
|
|
USD |
9 |
|
|
12174 |
|
24.8 |
|
21.8 |
|
|
18.0 |
16.1 |
1.1 |
|
1.1 |
0.0% |
13.8% |
2.6% |
2.9% |
|
|||||||||||||||||
|
|
|
|
|
|
|
|
|
|
|
|
|
|
|
|
|
|
|
|
|
|
|
|
|
|
|
|
|
|
|
|
|
|
||||||||
|
SUN ART RETAIL GROUP |
|
HKD |
|
9.56 |
|
|
11653 |
|
28.8 |
|
27.3 |
|
|
9.5 |
|
|
9.1 |
|
0.7 |
|
|
0.6 |
|
1.4% |
|
5.4% |
|
|
1.4% |
|
1.5% |
|
||||||||
|
PRESIDENT CHAIN STORE CORP TWD |
324.5 |
|
|
10992 |
|
32.7 |
|
30.1 |
|
|
16.1 |
15.1 |
1.3 |
|
1.2 |
-63.5% |
8.8% |
|
2.6% |
2.8% |
|
|||||||||||||||||||
|
|
|
|
|
|
|
|
|
|
|
|
|
|
|
|
|
|
|
|
|
|
|
|
|
|
|
|
|
|
|
|
|
|
||||||||
|
E-MART INC |
|
|
KRW |
|
208500 |
|
|
5200 |
|
12.8 |
|
12.4 |
|
|
7.8 |
|
|
7.3 |
|
0.5 |
|
|
0.5 |
|
-19.6% |
|
3.4% |
|
|
0.9% |
|
0.9% |
|
|||||||
|
EMERGING ASIA EX CHINA |
|
|
|
|
|
|
|
|
|
27.1 |
|
24.5 |
|
|
14.9 |
|
14.5 |
|
1.1 |
|
|
1.0 |
|
-10.4% |
|
10.4% |
|
1.9% |
|
2.1% |
|
|||||||||
|
CENCOSUD SA |
|
CLP |
|
1448.3 |
|
|
6185 |
|
18.59 |
|
16.0 |
|
|
9.9 |
|
|
9.5 |
|
0.7 |
|
|
0.7 |
|
-5.4% |
|
16.2% |
|
2.5% |
|
2.1% |
|
|||||||||
|
WALMART DE MEXICO |
|
MXN |
54.07 |
|
|
46586 |
|
26.44 |
|
24.5 |
|
|
15.0 |
13.8 |
1.5 |
|
1.4 |
4.2% |
8.1% |
|
3.0% |
3.1% |
|
|||||||||||||||||
|
|
|
|
|
|
|
|
|
|
|
|
|
|
|
|
|
|
|
|
|
|
|
|
|
|
|
|
|
|
|
|
|
|
||||||||
|
LOJAS AMERICANAS |
|
BRL |
|
17.6 |
|
|
6724 |
|
48.18 |
|
31.3 |
|
|
12.2 |
|
10.6 |
|
1.8 |
|
|
1.9 |
|
79.0% |
|
53.9% |
|
0.4% |
|
1.3% |
|
||||||||||
|
ORGANIZACION SORIANA |
|
MXN |
29.49 |
|
|
2616 |
|
12.02 |
|
10.5 |
|
|
6.5 |
|
6.5 |
0.5 |
|
0.5 |
-3.2% |
15.0% |
0.0% |
0.3% |
|
|||||||||||||||||
|
|
|
|
|
|
|
|
|
|
|
|
|
|
|
|
|
|
|
|
|
|
|
|
|
|
|
|
|
|
|
|
|
|
|
|||||||
|
EMERGING AMERICAS |
|
|
|
|
|
|
|
|
|
27.4 |
|
23.8 |
|
|
13.8 |
|
12.7 |
|
1.4 |
|
|
1.3 |
|
11.0% |
|
14.2% |
|
2.5% |
|
2.8% |
|
|||||||||
|
AVERAGE EMERGING MARKETS |
|
|
|
|
|
|
|
|
|
|
|
21.3 |
|
|
12.9 |
|
|
|
|
|
|
|
|
|
|
|
|
|
|
|||||||||||
|
|
|
|
|
|
|
|
24.0 |
|
|
|
|
12.0 |
|
1.0 |
|
|
1.0 |
|
0.3% |
|
13.8% |
|
2.7% |
|
1,6% |
|
||||||||||||||
|
|
|
|
|
|
|
|
|
|
|
|
|
|
|
|
|
|
|
|
||||||||||||||||||||||
|
CONTINENTAL EUROPE |
|
|
|
|
|
|
|
|
|
|
|
|
|
15.4 |
|
|
8.1 |
|
|
|
|
|
|
|
|
|
|
|
|
|
|
|
||||||||
|
|
|
|
|
|
|
|
|
|
18.8 |
|
|
|
|
|
7.2 |
|
0.4 |
|
|
0.4 |
|
13.0% |
|
22.4% |
|
2.4% |
|
3.1% |
|
|||||||||||
|
|
|
|
|
|
|
|
|
|
|
|
|
|
|
|
|
|
|
|
|
|
|
|||||||||||||||||||
|
USA |
|
|
|
|
|
|
|
|
|
|
|
|
|
|
20.2 |
|
|
10.9 |
|
|
|
|
|
|
|
|
|
|
|
|
|
|
||||||||
|
|
|
|
|
|
|
|
|
|
|
21.9 |
|
|
|
|
10.8 |
|
0.7 |
|
|
0.6 |
|
9.1% |
|
8.0% |
|
|
1.9% |
|
1.9% |
|
||||||||||
|
|
|
|
|
|
|
|
|
|
|
|
|
|
|
|
|
|
|
|
|
|
|
|
||||||||||||||||||
|
|
|
|
|
|
|
|
|
|
|
|
|
|
|
|
|
|
|
|
|
|
|
|
|
|
|
|
|
|
|
|
|
|
||||||||
|
|
|
|
Revenue |
|
|
|
|
|
|
|
EBITDA |
|
|
|
|
|
|
|
|
|
|
|
|
Net Income |
|
|
|
|||||||||||||
|
|
2018E |
|
|
2019E |
|
|
|
2018E |
|
|
|
|
|
2019E |
|
|
|
2018E |
|
|
|
|
2019E |
|
||||||||||||||||
|
|
ATON |
vs cons |
|
|
ATON |
vs cons |
|
|
|
ATON |
vs cons |
|
|
ATON |
vs cons |
|
|
|
ATON |
|
|
|
vs cons |
|
ATON |
|
vs cons |
|
||||||||||||
|
X5 |
1 529 876 |
-0.3% |
|
1 762 035 |
-0.6% |
|
|
107 593 |
0.4% |
|
|
|
121 940 |
-0.5% |
|
|
33 432 |
|
|
-0.2% |
|
40 218 |
-0.3% |
|
||||||||||||||||
|
Magnit |
1 235 455 |
-1,8% |
1 355 742 |
-1.7% |
|
91 670 |
0.0% |
|
106 199 |
3.8% |
|
36 649 |
1.8% |
|
42 468 |
3.8% |
|
|||||||||||||||||||||||
|
|
|
|
|
|
|
|
|
|
|
|
|
|
|
|
|
|
|
|
||||||||||||||||||||||
|
Lenta |
416 342 |
-1,5% |
|
453 341 |
|
-3.4% |
|
|
38 071 |
-2.5% |
|
|
|
40 638 |
-4.6% |
|
|
13 702 |
|
|
-7,2% |
|
15 608 |
-8,6% |
|
|||||||||||||||
|
OKEY |
167 947 |
-5,8% |
175 546 |
|
-8,3% |
|
7 819 |
|
-23,0% |
|
10 159 |
-12,3% |
|
171 |
|
|
|
n/a |
948 |
|
n/a |
|||||||||||||||||||
|
|
|
|
|
|
|
|
|
|
|
|
|
|
|
|
|
|
|
|
|
|
|
|
|
|
|
|
|
|
|
Source: Bloomberg, ATON Research |
||||||||||
© 2018 ATON LLC. All rights reserved

vk.com/id446425943
EQUITY RESEARCH CONSUMER AND RETAIL
X5 Retail Group
Efficiency Surpasses Growth as Key Focus
FIVE LI |
|
|
|
|
|
BUY |
Target price |
|
|
|
|
$31.6 |
|
Potential upside |
|
|
|
|
29% |
|
|
|
|
|
|
|
|
FIVE RX |
|
|
|
|
|
|
Target price |
|
|
|
|
RUB 2 093 |
|
|
|
|
|
|
|
|
Potential upside |
|
|
|
|
29% |
|
SHARE DATA |
|
|
|
|
|
|
No. of ordinary GDRs (mn) |
|
|
271.6 |
|||
3M average daily t/o shares ($mn) |
7.7 |
|||||
|
|
|
|
|
|
|
Free float (%) |
|
|
|
|
41% |
|
Market capitalisation ($mn) |
|
|
6 675 |
|||
|
|
|
|
|
||
Enterprise value (RUBmn) |
|
|
|
645 043 |
||
Major shareholder |
|
|
|
|
||
Alfa Group |
|
|
|
|
|
48% |
FINANCIALS |
|
2017 |
|
2018E |
|
2019E |
(RUBmn) |
|
|
|
|||
|
|
|
|
|
|
|
Revenue |
|
1,295,008 |
1,529,876 |
|
1,762,035 |
|
|
|
|
|
|
|
|
EBITDA |
96,193 |
107,593 |
121,940 |
|||
|
|
|
|
|||
EBIT |
|
57,758 |
61,102 |
|
71,938 |
|
Net income |
31,394 |
33,432 |
40,218 |
|||
|
|
|
|
|||
EPGDR, RUB |
|
115.6 |
123.1 |
|
148.1 |
|
DPGDR, RUB |
79.8 |
73.9 |
88.9 |
|||
|
|
|
|
|
|
|
Valuation |
|
|
|
|
|
|
P/E (x) |
14.1 |
13.2 |
11.0 |
|||
|
|
|
|
|||
EV/EBITDA (x) |
|
6.7 |
6.0 |
|
5.3 |
|
EV/Sales (x) |
0.5 |
0.4 |
0.4 |
|||
|
|
|
|
|||
RoA (%) |
|
6.0% |
5.6% |
|
6.1% |
|
RoE (%) |
22.0% |
20.3% |
22.3% |
|||
|
|
|
|
|||
RoIC (%) |
|
14.9% |
13.2% |
|
13.9% |
|
Performance |
|
|
|
|
|
|
1 month (%) |
|
|
|
|
|
19% |
3 month (%) |
|
|
|
|
-6% |
|
|
|
|
|
|
|
|
YTD (%) |
|
|
|
|
|
-35% |
52-week high ($) |
|
|
|
|
44.6 |
|
|
|
|
|
|
|
|
52-week low ($) |
|
|
|
|
|
19.1 |
|
Source: Bloomberg, ATON Research |
|||||
Figure 16: X5’s stock performance
46
40
34
28
22
16 


 Nov-17 Feb-18 May-18 Aug-18 Nov-18
FIVE LI
Source: Bloomberg, ATON Research
© 2018 ATON LLC. All rights reserved
Recently X5 Retail Group’s top management held a Capital Markets Day at which it shared its view on the further development of the group, and each format in particular. Overall, the presentation outlined a more balanced approach to opening pace (2k gross openings expected in 2019 vs 2.5k planned for 2018) with the focus shifted to attracting a greater number of loyal customers (target level of 15%) and ironing out internal efficiencies. We agree that a greater share of refurbished stores (83% of supermarkets as of 9M18), an extended product range, in-house production, and innovative technological solutions would be well-received by clients and increase X5 Group’s NPS score.
X5 sees its revenue rising 15-20% in FY19 (ATON estimate 15.2%), but its adjusted EBITDA margin is expected to remain at 7%+ (7% ATON). While the group does face execution risk, its new initiatives, commitment to its dividend policy, and better macroeconomics may support its share price. X5’s stock is currently trading at a 13% and 16% discount to its 2Y historical BF P/E and EV/EBITDA multiples. We reiterate our BUY rating and 12-month target price of RUB2,093 per share/ $31.6 GDR implying 29% of potential upside.
Key Takeaways from the Presentation
More balanced approach to openings is sensible, hints at maturing grocery space. X5 guides for 15-20% revenue growth in FY19, supported by 2k (gross) store openings, which is a significant drop from 2017 (3k stores opened). We think this is a sensible shift in priorities by Russia’s largest retailer, and affirms that ROIC and profit trump growth alone. X5 says it will be pickier in terms of locations in order to maintain the current returns and profitability levels (target EBITDA 7%+). Low market concentration gives key players the opportunity to further consolidate their market shares.
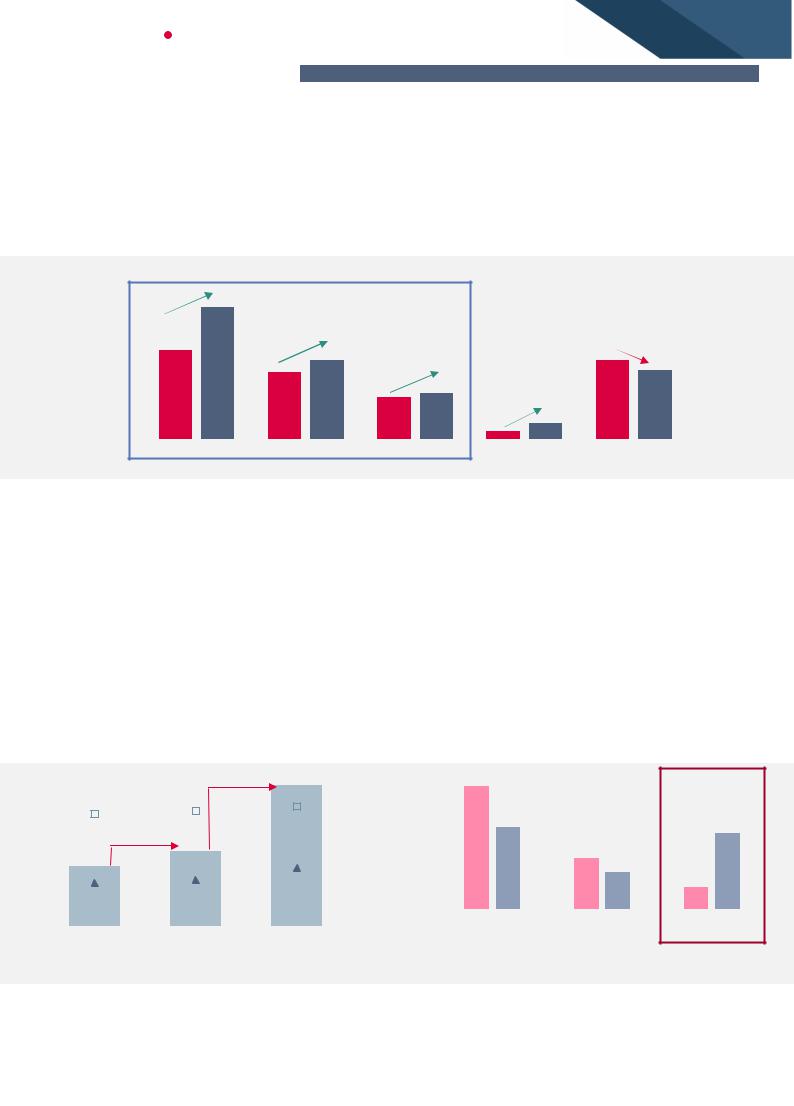
Market still offers growth opportunities for players with proven business models; proximity stores remain the key format. X5 estimates that the Russian grocery market will grow 19% from 2017 to 2021 (to RUB17.2trn), aided by the further expansion of modern trade (from 72% in 2017 to 80% in 2021). In total, supermarkets, discounters, and hypermarkets will account for 76% of the total market, with proximity stores and discounters set to show the fastest growth of 49% in four years.
Improving customer loyalty to become a more relevant sales driver. High-value customers with loyalty cards constitute 11% of the group’s total customer base but contribute 39% of revenue. A 1% increase in the number of customers categorised as
‘loyal’ would add 2.7% to sales, and X5 plans to expand the share of ‘loyal’ customers to 15%. In order to achieve this target, the group is working on its CVP, assortment mix, in-house production, a greater number of private labels (at Pyaterochka to up to 20-25%, at Karusel to 10% from the current 4%), and targeted promo campaigns.
Identifying the right omni-channel strategy is important for long-term growth. After the launch of Perekrestok online, net retail sales per omni-channel customer have increased 70% in Moscow with average NPS exceeding 80%. The company plans to further develop Perekrestok online, boosting the number of orders per day to 2.5k by the end of 2018, and expanding the pilot into St Petersburg. Pyaterochka also plans to launch an online channel in 2019, and is currently considering several options: either delivering to local customers from local stores or using postamats.
Trading 23% below its two-year historical average on BF P/E and 30% on BF EV/EBITDA, with the estimates downgrade cycle likely behind it (after an over 32% downgrade on FY19 EPS over the past 12 months). We see improving results and the dividend declaration due in Mar 2019 (expected yield over 4.5%) as possible catalysts for re-rating.
vk.com/id446425943 |
7 |
|
EQUITY RESEARCH |
CONSUMER AND RETAIL |
|
Format-Specific Strategies
Discounters to remain key business driver, but there will be fewer openings and a greater focus on efficiency. Discounters remain the key pillar of X5’s business, contributing approximately 80% of consolidated revenue as of 3Q18. X5’s new development strategy is based on several priorities listed below, with the main emphasis being customer loyalty and employee engagement:
1)Smart expansion. 1.8k stores are set to be opened in 2019 (or 37% less than in 2017). Pyaterochka will focus on its existing regions of presence in order to capitalise on its recognised brand, and will maintain the ROIC of new openings
(the Group’s IRR threshold is set at 19%).
Figure 20: Among X5’s three key formats, proximity stores are expected to show the fastest growth pace
Russian food retail formats’ expected expansion
6,7 |
|
|
|
|
|
|
|
4,5 |
4,0 |
|
|
|
|
|
4,0 |
|
|
|
|
|
|
|
|
3,4 |
|
|
|
2,3 |
|
3,5 |
|
|
|
|
|
|
|
||
|
|
2,1 |
|
|
|
|
|
|
|
|
|
|
|
0,8 |
|
|
|
|
|
|
|
0,4 |
|
|
|
|
|
|
|
|
|
Proximity |
Supermarkets |
|
Hypermarkets |
Other formats |
Traditional trade |
||
|
|
|
2017 |
|
2021 |
|
|
|
|
|
|
|
|
||
Source: Company data, ATON Research
2)CVP. Pyaterochka sees an opportunity in focusing on loyal customers whose spending is approximately 5x higher than regular customers. To attain this goal it will increase the number of fresh categories offered at its discounters, raise the share of private label products (to 20-25%), and improve the pricing process and the efficiency of its promotional campaigns, while maintaining the current promo level (around 30%).
3)Operating efficiency will be enhanced by decreasing shrinkages, further development of the multilayer logistics infrastructure, and optimisation of rent costs.
4)Innovations. In 2019 Pyaterochka plans to launch pilots for its online services. Currently the segment is considering several options of the omni-channel model including the possibility of delivering directly from its stores or using postamats.
Figure 21: Discounters will be the fastest-growing segment of |
Figure 22: Focus on loyal customers will boost Pyaterochka’s |
modern retail; Pyaterochka’s share in X5 sales up to 80% in 2021 |
revenue; +10% of spending of loyal clients = +3.8% to sales |
|
|
|
|
|
|
|
|
6,7 |
|
|||
7,0 |
|
|
|
|
|
|
|
100% |
||||
6,5 |
|
|
|
|
|
|
|
CAGR 10.4% |
|
|||
6,0 |
|
|
|
|
|
|
|
80% |
||||
|
75% |
|
|
77% |
|
|
|
|
80% |
|||
5,5 |
|
|
|
|
|
|
|
|
|
|||
|
|
|
|
|
|
|
|
|
|
|
||
5,0 |
|
|
|
|
4,5 |
|
|
|
60% |
|||
|
|
|
|
|
|
|
|
|
||||
4,5 |
|
4,0 |
CAGR 11% |
|
|
|
|
|||||
|
|
|
|
|
|
|||||||
4,0 |
|
|
|
|
|
|
|
|
|
|
40% |
|
3,5 |
|
|
|
|
|
|
|
39% |
|
|||
3,0 |
|
29% |
31% |
|
|
|
20% |
|||||
|
|
|
|
|
|
|
|
|
||||
2,5 |
|
|
|
|
|
|
|
|
|
|
|
|
2,0 |
|
|
|
|
|
|
|
|
|
|
0% |
|
2016 |
2017 |
2021 |
||||||||||
|
|
|
||||||||||
63% |
The most contributing |
|
||||
|
|
|||||
|
category - loyal customers; |
|
||||
|
target share - 15% |
|
||||
42% |
|
|
|
|
|
39% |
|
|
|
|
|
|
|
|
|
26% |
|
|
|
|
|
|
|
|
19% |
|
|
|
|
|
|
|
|
11% |
|
|
|
|
|
|
|
Regular customers |
|
|
Regular customers with |
High value customers |
||
without loyalty cards |
|
loyalty cards |
with loyalty cards |
|||
|
|
|
Customers |
|
Revenue |
|
|
|
|
|
|
||
|
|
|
|
|
||
 Proximity segment
  Share in grocery
 Pyaterochkas'a share in X5 sales
Source: Company data, ATON Research |
Source: Company data, ATON Research |
Supermarkets is the fastest-growing segment in X5’s format family and the only segment to generate positive LfL traffic since 1Q16. Customers appreciate the high share of refurbished stores (83%+), where average post-recovery LFL sales growth is
14-16%. The launch of online sales boosted clients’ average spending per month by
© 2018 ATON LLC. All rights reserved

|
vk.com/id446425943 |
|
|
|
|
|
|
|
|
|
|
|
|
|
|
|
|
|
|
|
|
|
|
8 |
|
|
|
||||||||||||
|
|
|
EQUITY RESEARCH |
|
CONSUMER AND RETAIL |
|
|
|
|
|
|
|
|
|
|
|
|
|
|
|
|
|
|||||||||||||||||
|
|
|
|
|
|
|
|
|
|
|
|
|
|
|
|
|
63%, albeit somewhat at the expense of offline spending that contracted 19%. X5 |
||||||||||||||||||||||
|
|
|
|
|
|
|
|
|
|
|
|
|
|
|
|
|
anticipates that in 2019 the Perekrestok chain will grow at a rate comparable to 2018. |
||||||||||||||||||||||
|
|
|
|
|
|
|
|
|
|
|
|
|
|
|
|
|
As with X5’s other formats, supermarket operations will be optimised, including the |
||||||||||||||||||||||
|
|
|
|
|
|
|
|
|
|
|
|
|
|
|
|
|
rollout of a regional model, logistics improvements with a focus on shelf availability, |
||||||||||||||||||||||
|
|
|
|
|
|
|
|
|
|
|
|
|
|
|
|
|
and the exploration of synergies with Pyaterochka in remote regions. |
|
|
|
|
|
|
||||||||||||||||
|
|
|
|
|
|
|
|
|
|
|
|
|
|
|
|
|
|
|
|
|
|
|
|
|
|
|
|
|
|
|
|
|
|||||||
|
|
Figure 23: We expect Perekrestok sales growth at a CAGR17-21 of |
|
Figure 24: Perekrestok is the only format to show positive LfL |
|||||||||||||||||||||||||||||||||||
|
|
11.7% (almost 3x higher than the segment average) |
|
traffic since 1Q16 |
|
|
|
|
|
|
|
|
|
|
|||||||||||||||||||||||||
|
4,5 |
23% |
|
|
|
|
|
|
23% |
|
|
|
|
8% |
|
|
|
|
|
|
|
|
|
|
|
|
|
|
|||||||||||
|
|
|
|
23% |
|
|
|
|
|
|
|
|
|
|
|
|
|
|
|
|
|
|
|
|
|||||||||||||||
|
|
|
|
|
|
|
|
|
|
|
|
|
|
|
|
|
|
|
|
|
|
|
|
|
|
|
|||||||||||||
|
|
|
|
|
|
|
|
|
|
|
|
|
|
|
|
|
|
|
|
|
|
|
|
|
|
|
|
|
|
|
|
|
|
|
|
|
|||
|
4 |
|
|
|
|
|
|
|
|
CAGR 4.1% |
22% |
|
|
|
|
|
|
|
|
|
|
|
|
|
|
|
|
|
|
|
|||||||||
|
|
|
|
|
|
|
|
|
|
|
|
|
|
|
|
|
|
|
|
|
|
|
|
|
|
|
|
|
|
||||||||||
|
|
|
|
|
|
|
|
|
|
|
4,0 |
|
|
|
|
|
4% |
|
|
|
|
|
|
|
|
|
|
|
|
|
|
||||||||
|
|
|
|
|
|
|
|
|
|
|
|
|
|
|
|
|
|
|
|
|
|
|
|
|
|
|
|
|
|
|
|
|
|||||||
|
3,5 |
|
|
|
|
|
|
|
|
|
|
|
|
|
|
|
|
|
|
|
|
|
|
|
|
|
|
|
|
|
|
|
|
|
|
||||
|
|
|
|
|
CAGR 6.3% |
3,4 |
|
|
|
|
|
|
|
|
|
|
|
|
|
|
|
|
|
|
|
|
|
|
|
|
|
|
|
|
|||||
|
|
|
|
|
|
|
|
|
|
|
|
|
|
|
|
|
|
|
|
|
|
|
|
|
|
|
|
|
|
|
|
|
|
|
|||||
|
3 |
3,2 |
|
|
|
|
|
|
|
18% |
|
|
|
|
|
|
|
|
|
|
|
|
|
|
|
|
|
|
|
||||||||||
|
|
|
|
|
|
|
|
|
|
|
|
|
|
|
|
|
0% |
|
|
|
|
|
|
|
|
|
|
|
|
|
|
||||||||
|
2,5 |
|
|
|
15% |
|
|
|
|
|
|
|
|
|
|
|
|
|
|
|
|
1Q16 2Q16 3Q16 4Q16 1Q17 2Q17 3Q17 4Q17 1Q18 2Q18 3Q18 |
|
||||||||||||||||
|
|
|
|
|
|
|
|
|
|
|
|
|
|
|
|
|
|
|
|
|
|
|
|
||||||||||||||||
|
|
|
|
|
|
14% |
|
|
14% |
|
|
-4% |
|
|
|
|
|
|
|
|
|
|
|
|
|
|
|||||||||||||
|
|
|
|
|
|
|
|
|
|
|
|
|
|
|
|
|
|
|
|
|
|
|
|
|
|
|
|
|
|||||||||||
|
2 |
|
|
|
|
|
|
|
|
|
|
|
|
|
13% |
|
|
|
|
|
|
|
|
|
|
|
|
|
|
|
|
|
|
||||||
|
|
|
|
|
|
|
|
|
|
|
|
|
|
|
|
|
|
|
|
|
|
|
|
|
|
|
|
|
|
|
|
|
|
|
|
|
|
||
|
1,5 |
|
|
|
|
|
|
|
|
|
|
|
|
|
|
10% |
|
|
-8% |
|
|
|
LfL traffic Pyaterochka |
|
LfL traffic Perekrestok |
|
|||||||||||||
|
|
|
2016 |
|
|
2017 |
|
|
2021 |
|
|
|
|
|
|
|
|
|
|
|
|
|
|
|
|
|
|
|
|||||||||||
|
|
|
|
|
|
|
|
|
|
|
|
|
|
|
|
|
|
|
|
|
|
|
|
|
|
||||||||||||||
|
|
|
|
|
|
|
|
|
|
|
|
|
|
|
|
|
|
LfL traffic Karusel |
|
LfL traffic X5 |
|
|
|
|
|
|
|||||||||||||
|
|
|
Supermarket segment |
Share in grocery |
|
Perekrestok's share in X5 sales |
|
|
|
|
|
|
|
|
|
|
|
|
|
|
|
||||||||||||||||||
|
|
|
|
|
|
|
|
|
|
|
|
|
|
|
|
|
|
|
|
|
|
|
|
|
|
|
|
|
|
|
|
|
|
|
|
|
|
|
|
|
|
|
|
|
|
|
|
|
Source: Company data, ATON Research |
|
|
|
|
|
|
|
Source: Company data, ATON Research |
||||||||||||||||||||||
|
|
|
|
|
|
|
|
|
|
|
|
|
|
|
|
|
Differentiation via assortment as the key means of improving CVP. In order to |
||||||||||||||||||||||
|
|
|
|
|
|
|
|
|
|
|
|
|
|
|
|
|
support further its format development, Perekrestok will prioritise enhancing its |
||||||||||||||||||||||
|
|
|
|
|
|
|
|
|
|
|
|
|
|
|
|
|
assortment, with a particular emphasis on fresh foods, and the opening of a kitchen |
||||||||||||||||||||||
|
|
|
|
|
|
|
|
|
|
|
|
|
|
|
|
|
factory (that will add 800 SKUs to the assortment). The project will be launched in |
||||||||||||||||||||||
|
|
|
|
|
|
|
|
|
|
|
|
|
|
|
|
|
1H19 and will focus on fresh and ready-to-eat products with targeted output of 120 |
||||||||||||||||||||||
|
|
|
|
|
|
|
|
|
|
|
|
|
|
|
|
|
tonnes per day. |
|
|
|
|
|
|
|
|
|
|
|
|
|
|
|
|
|
|||||
|
|
|
|
|
|
|
|
|
|
|
|
|
|
|
|
|
Perekrestok online development remains a priority. While Perekrestok online is still in |
||||||||||||||||||||||
|
|
|
|
|
|
|
|
|
|
|
|
|
|
|
|
|
its infancy, the results are already visible. The group plans to increase the number of |
||||||||||||||||||||||
|
|
|
|
|
|
|
|
|
|
|
|
|
|
|
|
|
SKUs to around 50k (via extending its online offering to include hypermarket’s and |
||||||||||||||||||||||
|
|
|
|
|
|
|
|
|
|
|
|
|
|
|
|
|
partners’ assortments), improve its mobile app, and launch the ‘click and collect’ pilot. |
||||||||||||||||||||||
|
|
|
|
|
|
|
|
|
|
|
|
|
|
|
|
|
Loyal customers will become the major focus. As is the case for the group as a whole, |
||||||||||||||||||||||
|
|
|
|
|
|
|
|
|
|
|
|
|
|
|
|
|
Perekrestok will focus its energies on bolstering the number of loyal customers (loyal |
||||||||||||||||||||||
|
|
|
|
|
|
|
|
|
|
|
|
|
|
|
|
|
customers’ average ticket at Perekrestok is 37% higher than for the average client). |
||||||||||||||||||||||
|
|
|
|
|
|
|
|
|
|
|
|
|
|
|
|
|
Perekrestok plans to double the number of active loyalty card users from 5mn |
||||||||||||||||||||||
|
|
|
|
|
|
|
|
|
|
|
|
|
|
|
|
|
currently by 2020, and expand loyalty card penetration to 70%. |
|
|
|
|
|
|
|
|
||||||||||||||
|
|
|
|
|
|
|
|
|
|
|
|
|
|
|
|
|
|
|
|
|
|
|
|
|
|
|
|
|
|
|
|
|
|||||||
|
|
|
|
|
|
|
|
|
|
|
|
|
|
|
|
|
Figure 25: Perekrestok plans to double the number of active loyalty cards, at the |
|
|
|
|||||||||||||||||||
|
|
|
|
|
|
|
|
|
|
|
|
|
|
|
|
|
same time increasing the penetration rate |
|
|
|
|
|
|
|
|
|
|
||||||||||||
|
|
|
|
|
|
|
|
|
|
|
|
|
|
|
|
|
|
|
12 |
|
|
|
|
|
|
|
|
|
|
|
|
|
75% |
|
|
|
|
|
|
|
|
|
|
|
|
|
|
|
|
|
|
|
|
|
|
|
|
|
|
10 |
|
|
|
|
|
|
|
|
|
70% |
|
70% |
|
|
|
|
|
||
|
|
|
|
|
|
|
|
|
|
|
|
|
|
|
|
|
|
|
|
|
|
|
|
|
|
|
|
|
|
|
|
|
|
|
|
|
|
||
|
|
|
|
|
|
|
|
|
|
|
|
|
|
|
|
|
|
|
|
8 |
|
|
|
|
|
|
|
|
|
|
|
|
|
65% |
|
|
|
|
|
|
|
|
|
|
|
|
|
|
|
|
|
|
|
|
|
|
|
|
|
|
|
|
|
|
|
|
|
|
|
|
|
|
|
|
|
|
|
||
|
|
|
|
|
|
|
|
|
|
|
|
|
|
|
|
|
|
|
|
|
|
|
|
|
|
60% |
|
|
|
|
|
60% |
|
|
|
|
|
||
|
|
|
|
|
|
|
|
|
|
|
|
|
|
|
|
|
|
|
6 |
|
|
|
|
|
|
|
|
|
10 |
|
|
|
|
|
|
|
|
||
|
|
|
|
|
|
|
|
|
|
|
|
|
|
|
|
|
|
|
|
|
|
|
|
|
|
|
|
|
|
|
|
55% |
|
|
|
|
|
||
|
|
|
|
|
|
|
|
|
|
|
|
|
|
|
|
|
|
|
|
|
|
|
|
|
|
|
|
|
|
|
|
|
|
|
|
|
|
|
|
|
|
|
|
|
|
|
|
|
|
|
|
|
|
|
|
|
|
|
4 |
|
|
|
|
|
|
|
|
|
|
|
|
|
50% |
|
|
|
|
|
|
|
|
|
|
|
|
|
|
|
|
|
|
|
|
|
|
|
|
|
|
|
|
|
|
|
|
|
|
|
|
|
|
|
|
|
|
|
|
|
|
|
|
|
|
|
|
|
|
|
|
|
|
|
|
|
|
|
|
|
|
2 |
|
|
|
|
|
5 |
|
|
|
|
|
|
|
|
|
|
|
|
|
|
|
|
|
|
|
|
|
|
|
|
|
|
|
|
|
|
|
|
|
|
|
|
|
|
|
|
|
|
|
|
|
45% |
|
|
|
|
|
||
|
|
|
|
|
|
|
|
|
|
|
|
|
|
|
|
|
|
|
|
|
|
|
|
|
|
|
|
|
|
|
|
|
|
|
|
|
|
|
|
|
|
|
|
|
|
|
|
|
|
|
|
|
|
|
|
|
|
|
0 |
|
|
|
|
|
|
|
|
|
|
|
|
|
40% |
|
|
|
|
|
|
|
|
|
|
|
|
|
|
|
|
|
|
|
|
|
|
|
|
|
|
|
|
|
3Q18 |
2020F |
|
|
|
|
|
|
|||||||||
|
|
|
|
|
|
|
|
|
|
|
|
|
|
|
|
|
|
|
|
|
|
|
|
|
|
|
|
|
|
|
|
|
|
||||||
|
|
|
|
|
|
|
|
|
|
|
|
|
|
|
|
|
|
|
|
|
|
|
|
|
Active cards, mn |
Turnover penetration |
|
|
|
|
|
|
|
|
|||||
|
|
|
|
|
|
|
|
|
|
|
|
|
|
|
|
|
|
|
|
|
|
|
|
|
|
|
|
|
|
|
|
|
|||||||
|
|
|
|
|
|
|
|
|
|
|
|
|
|
|
|
|
|
|
|
|
|
|
|
|
|
|
|
|
|
|
|
|
|
|
|
|
|
||
|
|
|
|
|
|
|
|
|
|
|
|
|
|
|
|
|
|
|
|
|
|
|
|
|
|
|
|
|
|
Source: Company data, ATON Research |
|||||||||
|
|
|
|
|
|
|
|
|
|
|
|
|
|
|
|
|
Karusel susceptible to larger format risks… Hypermarkets are the slowest growing |
||||||||||||||||||||||
|
|
|
|
|
|
|
|
|
|
|
|
|
|
|
|
|
segment in the Russian retail landscape with the estimated average compound growth |
||||||||||||||||||||||
|
|
|
|
|
|
|
|
|
|
|
|
|
|
|
|
|
rate from 2017 to 2021 being 2.9% (Infoline), and expected to further cede market |
||||||||||||||||||||||
|
|
|
|
|
|
|
|
|
|
|
|
|
|
|
|
|
share to smaller formats. We estimate Karusel’s growth in line with the market average |
||||||||||||||||||||||
|
|
|
|
|
|
|
|
|
|
|
|
|
|
|
|
|
and consequently forecast that its contribution to X5’s top line will dip from 7% in 2017 |
||||||||||||||||||||||
|
© 2018 ATON LLC. All rights reserved |
|
|
|
|
|
to 5% in 2021. |
|
|
|
|
|
|
|
|
|
|
|
|
|
|
|
|
|
|||||||||||||||
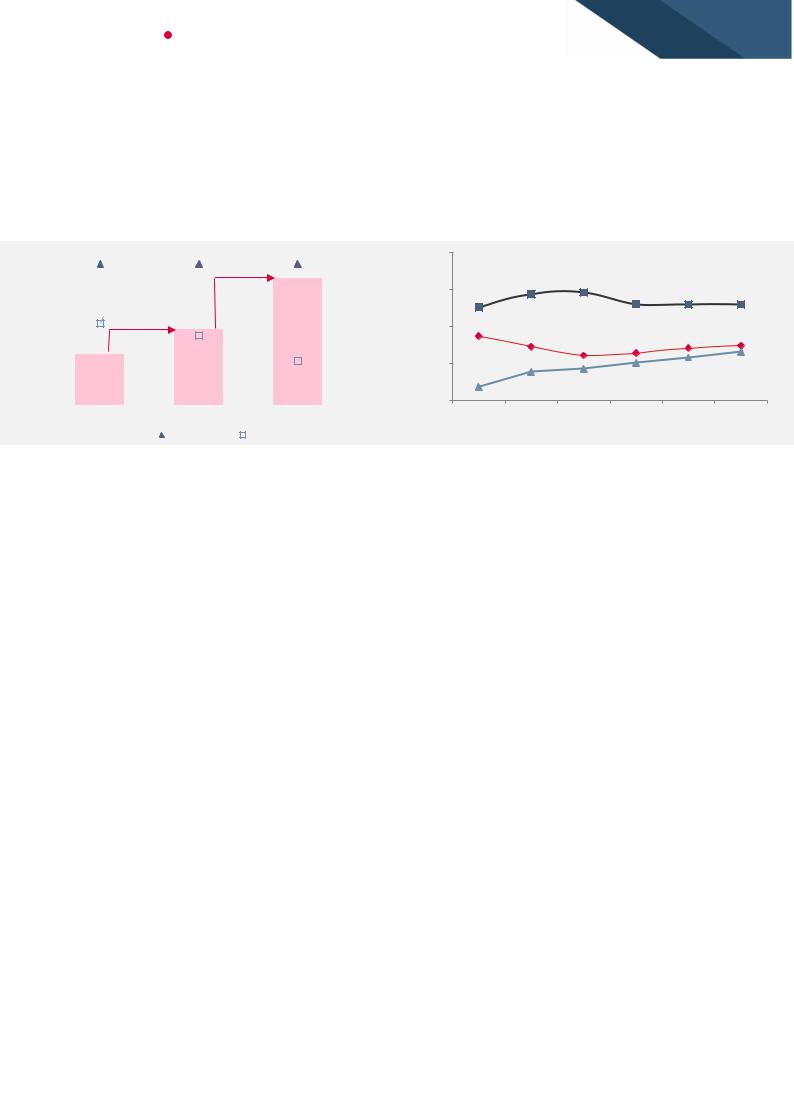
vk.com/id446425943 |
9 |
|
EQUITY RESEARCH |
CONSUMER AND RETAIL |
|
… though efficiency to be dramatically improved that will translate into higher sales densities. The initiatives that X5 has announced, including further enhancement of its assortment mix (increasing the share of private label products from the current 4% to 10% by 2020) with a focus on healthy food and fresh produce, as well as the development of food services (in-store pizza points, cafeterias, and restaurants) together with further operating optimisation should raise Karusel’s sales density (+7% expected by 2021). Together with heightened personnel efficiency and shrinkage cost reduction, the improved sales density should benefit the format’s margins.
Figure 26: The hypermarkets’ top line CAGR17-21 will be 1.8x |
Figure 27: Sales density of Karusel will improve at fastest pace |
lower than the CAGR16-17 |
among X5 formats |
2,4 |
|
|
|
|
|
|
|
|
14% |
|
15% |
|||
|
|
|
|
|
14% |
14% |
|
|
||||||
|
|
|
|
|
2,3 |
|
|
|||||||
|
|
|
|
|
|
|
|
|
|
|
||||
2,3 |
|
|
|
|
|
|
|
CAGR 2.9% |
|
|||||
|
|
|
|
|
|
|
|
|
||||||
2,2 |
|
8% |
|
|
|
|
|
|
|
|
|
10% |
||
|
|
|
2,1 |
|
|
|
|
|
|
|||||
2,1 |
|
|
|
|
CAGR 5.1% |
|
|
|
|
|
|
|||
|
2,0 |
|
|
|
|
|
|
|
|
|
||||
|
|
|
|
|
|
|
|
|
|
|
||||
2,0 |
|
7% |
4% |
|
5% |
|||||||||
|
|
|
|
|
|
|
|
|
||||||
|
|
|
|
|
|
|
|
|
|
|
|
|
||
1,9 |
|
|
|
|
|
|
|
|
|
|
|
|
|
|
|
|
|
|
|
|
|
|
|
|
|
|
|
|
|
1,8 |
|
|
|
|
|
|
|
|
|
|
|
|
|
0% |
2016 |
|
2017 |
2021 |
|
||||||||||
|
|
|
|
|
||||||||||
|
|
Hypermarkets segment |
Share in grocery |
|
Karusel's share in X5 sales |
|||||||||
|
|
|
||||||||||||
|
|
|
|
|
|
Source: Company data, ATON Research |
|
|||||||
360 |
|
|
|
|
|
320 |
|
|
|
|
|
|
315 |
|
|
|
304 |
280 |
|
|
|
|
|
|
258 |
|
|
|
259 |
|
|
|
|
|
253 |
240 |
|
|
|
|
|
|
231 |
|
|
|
|
200 |
|
|
|
|
|
2016 |
2017 |
2018 |
2019 |
2020 |
2021 |
 Pyaterochka
 Perekrestok
  Karusel
Source: Company data, ATON Research
Figure 28: X5 financials snapshot
INCOME STATEMENT, RUBmn |
2015 |
2016 |
2017 |
2018E |
2019E |
2020E |
Revenue |
808 818 |
1 033 667 |
1 295 008 |
1 529 876 |
1 762 035 |
2 001 220 |
Gross profit |
198 390 |
249 985 |
308 938 |
367 170 |
424,651 |
481 294 |
|
|
|
|
|
|
|
Operating profit (EBIT) |
34 449 |
45 631 |
57 758 |
61 102 |
71 938 |
82 856 |
EBITDA |
55 233 |
76 267 |
96 193 |
107 593 |
121 940 |
136 409 |
|
|
|
|
|
|
|
EBITDA adj |
59 413 |
79 519 |
99 131 |
109 622 |
124 070 |
138 539 |
EBITDA margin |
7,3% |
7,7% |
7,7% |
7.2% |
7.0% |
6.9% |
|
|
|
|
|
|
|
EBITDAR |
91 598 |
123 287 |
156 273 |
182 271 |
206 872 |
231 376 |
Profit before income tax |
17 930 |
28 653 |
41 816 |
44 576 |
53 624 |
64 430 |
|
|
|
|
|
||
Profit for the period |
14 174 |
22 291 |
31 394 |
33 432 |
40 218 |
48 322 |
BALANCE SHEET, RUBmn |
2015 |
2016 |
2017 |
2018E |
2019E |
2020E |
Property, plant and equipment |
189 000 |
232 316 |
278 928 |
311 873 |
333 009 |
346 545 |
Total non-current assets |
293 410 |
343 409 |
405 985 |
443 643 |
466 462 |
481 442 |
|
|
|
|
|
|
|
Inventories |
57 887 |
73 801 |
99 300 |
118 680 |
140 174 |
163 471 |
Total current assets |
108 705 |
130 076 |
159 273 |
186 828 |
221 500 |
247 588 |
|
|
|
|
|
||
Total assets |
402 115 |
473 485 |
565 258 |
630 471 |
687 963 |
729 030 |
Total equity |
104 718 |
127 040 |
158 442 |
170 250 |
190 409 |
214 600 |
|
|
|
|
|
||
Long-term borrowings |
101 545 |
110 865 |
135 622 |
176 197 |
196 197 |
193 197 |
Total non-current liabilities |
106 517 |
119 075 |
142 641 |
183 528 |
203 528 |
200 528 |
|
|
|
|
|
||
Total current liabilities |
190 880 |
227 370 |
264 175 |
276 693 |
294 026 |
313 901 |
Total equity and liabilities |
402 115 |
473 485 |
565 258 |
630 471 |
687 963 |
729 030 |
|
|
|
|
|
||
Key data |
2015 |
2016 |
2017 |
2018E |
2019E |
2020E |
ROE |
14,5% |
19,2% |
22,0% |
20.3% |
22.3% |
23.9% |
ROA |
3,8% |
5,1% |
6,0% |
5.6% |
6.1% |
6.8% |
|
|
|
|
|
||
ROIC |
13,9% |
15,8% |
16,7% |
13.2% |
13.9% |
14.9% |
|
|
|
|
|
Source: Company data, ATON Research
© 2018 ATON LLC. All rights reserved
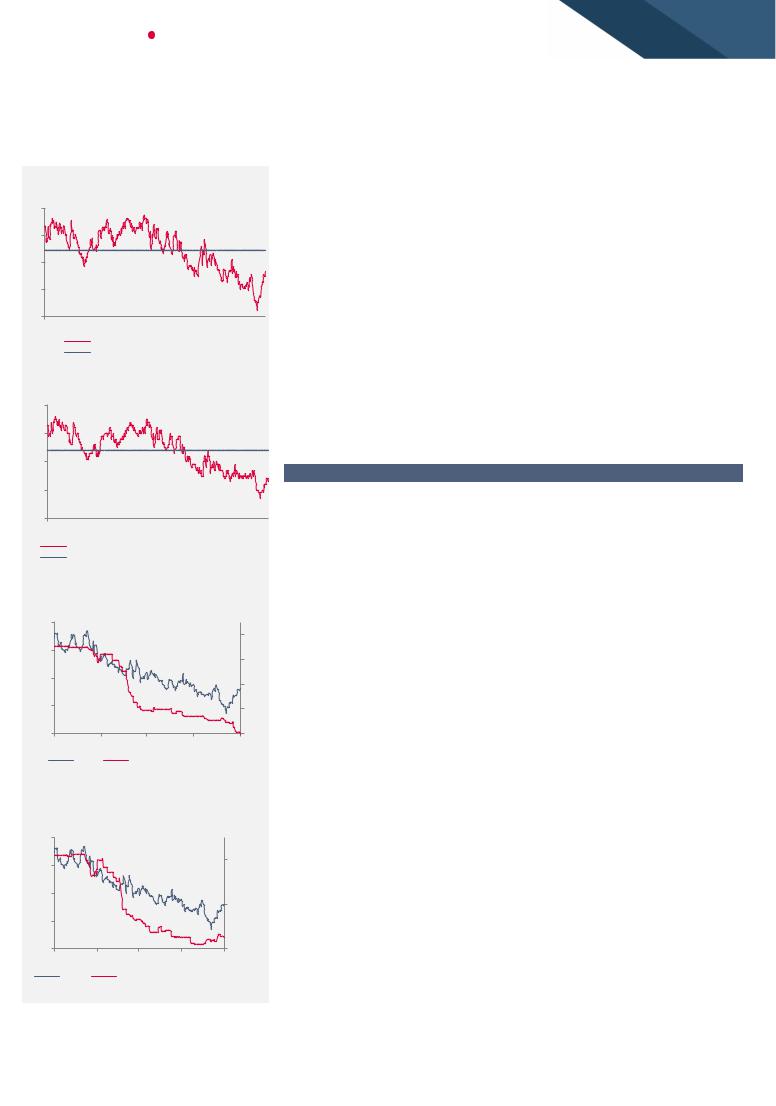
vk.com/id446425943 |
10 |
||||
|
EQUITY RESEARCH |
CONSUMER AND RETAIL |
|
||
|
|
|
|
|
|
|
Target Price |
|
|
Valuation |
|
|
Target price per GDR (DCF),$ |
32.6 |
|
|
|
Target price per GDR (multiples),$ |
30.7 |
Average Target Price per GDR,$ |
31.6 |
|
|
Potential upside |
29% |
|
|
Source: Company data, ATON Research
Figure 29: Fwd P/E FIVE LI
16
14
12
10
8 


 Oct-16 Mar-17 Aug-17 Jan-18 Jun-18
FIVE LI Equity Multiple (BF P/E) Multiple Average (2 Years)
Source: Bloomberg, ATON Research
Figure 30: Fwd EV/EBITDA FIVE LI
12M target price. We used both DCF and multiples-based approaches to value X5 Group, and our combined valuation yields a 12-month target price of $31.6 price per GDR in 2018, implying 29% upside potential to the current market price (CMP) and we reiterate our BUY rating for the name. In 2018 X5 commenced trading on Moscow Stock Exchange, and for FIVE RX our target price is RUB2 093, implying 29% of potential return on the current market price.
Multiples valuation. With respect to our multiples valuation, we used the 12M forward
P/E and EV/EBITDA ratios of X5 Group’s global emerging markets peers (12.9x and
22.9x, respectively), as well as a 45% discount to the target multiples The marketbased valuation resulted in a target price of $30.7 per GDR, implying 25% upside potential to the CMP.
X5’s Cost of Capital was calculated using: 1) the Russian corporate tax rate of 24%, 2) the RFR offered on 10-year OFZ, and 3) our assumption of a 5% debt premium and ERP of 5%. Using the current debt–to-equity ratio we calculate X5’s weighted average cost of capital to be 13.7%.
8
7
6
5
4 


 Oct-16 Mar-17 Aug-17 Jan-18 Jun-18
FIVE LI Equity Multiple (BF EV/EBITDA) Multiple Average (2 Years)
Source: Bloomberg, ATON Research
Figure 31: X5 EPS 2019 estimates fell 32% over 12m
2600
|
230 |
2200 |
210 |
|
|
1800 |
190 |
|
|
1400 |
170 |
|
|
1000 |
150 |
Nov-17 Feb-18 |
May-18 Aug-18 |
Price |
BEst Standard EPS adj 2019 |
Source: Company reports, ATON Research
Figure 32: X5 EBITDA 2019 est decreased
13% over 1 yr
2600
2200 |
140000 |
|
|
1800 |
|
|
130000 |
1400 |
|
1000 |
120000 |
Nov-17 Feb-18 May-18 Aug-18 |
|
Price |
BEst Standard EBITDA 2019 A |
Source: Bloomberg, Company, ATON Research
DCF. In order to calculate the terminal value we assume that after 2026 future cash flows will grow at a constant rate of 5%. Given our DCF model we calculated a target price of $32.6 which implies 33% upside potential to the current price per GDR.
Risks
Downside risks
Lower-than-expected economic growth in Russia: constrained consumer spending may slow the consumer recovery and put pressure on X5’s top line growth.
A faster turnaround and Magnit’s new strategy: Magnit is currently putting immense effort into reconquering Russian retail market leadership. While the turnaround will take time, the success of X5’s main competitor may negatively affect the latter’s business.
Less aggressive openings pace may result in weaker top line growth and market share contraction while not guaranteeing a better operating performance.
Upside risks
Accelerating inflation: faster acceleration of food CPI should result in quicker top-line growth.
Higher dividend payout. A strong balance sheet position may see X5 paying out higher dividends. This would put it at a distinct competitive advantage, taking into consideration that Magnit has decided not to pay a final dividend for 2017.
M&A: With greater opportunities for M&A, X5 may accomplish more respective transactions and accelerate its growth.
Greater-than- forecast upside from new technological pilots and faster development of online. Currently X5 has 68 projects that are being piloted and it has also arduously developed the omni-channel business model in all its formats. At this stage it is difficult to evaluate the effect of the new projects on X5’s business, and we see their successful development as another potential upside risk.
© 2018 ATON LLC. All rights reserved