

9 11 2018 Consumer Update Smart Expansion
.pdfvk.com/id446425943 |
|
|
|||
|
EQUITY RESEARCH |
CONSUMER AND RETAIL |
|
||
|
|
|
|
|
|
|
Multiples Valuation |
|
EV/EBITDA |
P/E |
|
|
GEM peers, x |
|
12,9 |
22,9 |
|
|
|
|
|
|
|
|
X5 target multiples, x |
|
7,1 |
12,6 |
|
|
|
|
|
|
|
|
X5 |
18-19E EBITDA, RUBmn |
|
114 767 |
|
|
|
|
|
|
|
|
X5 |
18-19E net income, RUBmn |
|
|
36 825 |
|
|
|
|
|
|
|
X5 implied EV, RUBmn |
|
814 270 |
|
|
|
|
|
|
|
|
|
X5 |
2018E net debt, RUBmn |
|
196 030 |
|
|
|
|
|
|
|
|
X5 implied equity value, RUBmn |
|
618 240 |
463 808 |
|
|
|
|
|
|
|
|
Price per GDR, $ |
|
35,0 |
26,3 |
|
|
|
|
|
|
|
|
TP (average EV/EBITDA and P/E), $ |
30,7 |
|
||
|
|
|
|
|
|
|
Potential Upside |
|
25% |
|
|
|
|
|
|
|
|
Source: Bloomberg, Company data, ATON Research
11
WACC calculation
|
Tax rate |
|
24,0% |
|
|
|
|
|
|
|
|
|
Asset Beta |
|
1,0 |
|
|
|
|
|
|
|
|
|
Debt/Equity |
0,5 |
|
|
|
||
|
|
|
|
|
Geared Beta |
|
1,4 |
|
|
|
|
|
|
|
|
|
Risk free rate |
8.5% |
|
|
|
||
|
|
|
|
|
Debt premium |
|
5,0% |
|
|
|
|
|
|
|
|
|
Equity risk premium |
5,0% |
|
|
|
||
|
|
|
|
|
Cost of equity |
|
15,6% |
|
|
|
|
|
|
|
|
|
Cost of debt (after tax) |
10,3% |
|
|
|
||
|
|
|
|
|
WACC |
|
13,7% |
|
|
|
|
|
|
|
|
Source: Bloomberg, Company data, ATON Research
DCF valuation |
2018E |
2019E |
2020E |
2021E |
2022E |
2023E |
2024E |
2025E |
2026E |
EBIT |
61,102 |
71,938 |
82,856 |
88,625 |
89,028 |
92,954 |
99,868 |
110,027 |
114,723 |
Less taxation |
-11,144 |
-13,406 |
-16,107 |
-17,019 |
-17,457 |
-18,609 |
-20,549 |
-23,337 |
-24,859 |
|
|
|
|
|
|
|
|
|
|
Tax adjusted EBIT |
49,958 |
58,532 |
66,749 |
71,606 |
71,572 |
74,345 |
79,319 |
86,690 |
89,865 |
Depreciation and amortisation |
46,491 |
50,003 |
53,553 |
56,630 |
59,448 |
62,055 |
63,206 |
61,602 |
60,068 |
|
|
|
|
|
|
|
|
|
|
Less CAPEX |
-77,004 |
-68,564 |
-64,275 |
-62,402 |
-61,996 |
-60,736 |
-54,733 |
-52,119 |
-49,315 |
Change in working capital |
6,205 |
-2,706 |
-4,043 |
-5,634 |
-6,914 |
-2,146 |
-2,943 |
10,038 |
-2,842 |
|
|
|
|
|
|
|
|
|
|
Unlevered free cash flow |
25,650 |
37,265 |
51,984 |
60,200 |
62,110 |
73,519 |
84,850 |
106,211 |
97,777 |
WACC |
13.7% |
|
|
|
|
|
|
|
|
|
|
|
|
|
|
|
|
|
|
Discounted free cash flow |
25,168 |
32,148 |
39,429 |
40,145 |
36,415 |
37,897 |
38,455 |
42,321 |
34,254 |
Future cash flow growth rate |
5.0% |
|
|
|
|
|
|
|
|
|
|
|
|
|
|
|
|
|
|
Terminal value |
1,272,500 |
|
|
|
|
|
|
|
|
Discounted terminal value |
445,794 |
|
|
|
|
|
|
|
|
|
|
|
|
|
|
|
|
|
|
PV of 2026E enterprise value |
772,026 |
|
|
|
|
|
|
|
|
Net debt |
196,030 |
|
|
|
|
|
|
|
|
|
|
|
|
|
|
|
|
|
|
Fair equity value |
575,996 |
|
|
|
|
|
|
|
|
Number of GDRs, mn |
271.5 |
|
|
|
|
|
|
|
|
|
|
|
|
|
|
|
|
|
|
Price target, $ per GDR |
32.6 |
|
|
|
|
|
|
|
|
Potential Upside |
33% |
|
|
|
|
|
|
|
|
Figure 33: X5 new vs old forecasts comparison
|
|
2018E |
|
|
2019E |
|
|
New |
Old |
% |
New |
Old |
% |
Revenue |
1,529,876 |
1,569,960 |
-2.6% |
1,762,035 |
1,808,087 |
-2.5% |
EBITDA |
107,593 |
111,360 |
-3.4% |
121,940 |
123,919 |
-1.6% |
|
|
|
|
|
|
|
Net Income |
33,432 |
36,363 |
-8.1% |
40,218 |
41,599 |
-3,3% |
|
ATON |
Cons |
% |
ATON |
Cons |
% |
Revenue |
1,529,876 |
1,534,140 |
-0.3% |
1,762,035 |
1,772,959 |
-0.6% |
|
|
|
|
|
|
|
EBITDA |
107,593 |
107,182 |
0.4% |
121,940 |
122,532 |
-0.5% |
Net Income |
33,432 |
33,501 |
-0.2% |
40,218 |
40,332 |
-0.3% |
© 2018 ATON LLC. All rights reserved

vk.com/id446425943
EQUITY RESEARCH CONSUMER AND RETAIL
Magnit
First Steps Towards Transformation
MGNT RX |
|
|
|
|
|
BUY |
Target price share |
|
|
|
RUB4 970 |
||
Potential upside |
|
|
|
34% |
||
|
|
|
|
|
|
|
MGNT LI |
|
|
|
|
|
|
Target price GDR |
|
|
|
$18 |
||
|
|
|
|
|
|
|
Potential upside |
|
|
|
27% |
||
SHARE DATA |
|
|
|
|
|
|
No. of ordinary shares (mn) |
|
|
101,9 |
|||
|
|
|
|
|
|
|
No. of ordinary GDRs (mn) |
|
|
|
509.6 |
||
3M average daily t/o shares |
|
|
1 527 |
|||
(RUBmn) |
|
|
|
|||
|
|
|
|
|
||
Free float (%) |
|
|
|
65% |
||
Market capitalisation (RUBmn) |
|
|
381 301 |
|||
|
|
|
|
|
|
|
Enterprise value (RUBmn) |
|
|
|
485 958 |
||
Major shareholder |
|
|
|
|
|
|
VTB |
|
|
|
|
18% |
|
Marathon Group |
|
|
|
13%* |
||
|
|
|
|
|
|
|
FINANCIALS |
|
2017 |
|
2018E |
|
2019E |
(RUBmn) |
|
|
|
|||
|
|
|
|
|
|
|
Revenue |
1 143 314 |
1 235 455 |
|
1 355 742 |
||
|
|
|
|
|
|
|
EBITDA |
91 778 |
91 644 |
106 199 |
|||
|
|
|
|
|||
EBIT |
58 062 |
57 716 |
|
63 633 |
||
Net income |
35 539 |
36 649 |
42 468 |
|||
|
|
|
|
|||
EPS, RUB |
348,8 |
359,7 |
|
416,8 |
||
DPS, RUB |
135.5 |
161.8 |
166.7 |
|||
|
|
|
|
|
|
|
Valuation |
|
|
|
|
|
|
P/E (x) |
10.7 |
10.4 |
9.0 |
|||
|
|
|
|
|||
EV/EBITDA (x) |
5.3 |
5.3 |
|
4.6 |
||
EV/Sales (x) |
0.4 |
0.4 |
0.4 |
|||
|
|
|
|
|||
RoA (%) |
7,2% |
6,8% |
|
7,6% |
||
RoE (%) |
15,6% |
14,0% |
15,4% |
|||
|
|
|
|
|||
RoIC (%) |
14,3% |
12,7% |
|
13,8% |
||
Performance |
|
|
|
|
|
|
1 month (%) |
|
|
|
|
-1% |
|
3 month (%) |
|
|
|
-12% |
||
|
|
|
|
|
||
YTD (%) |
|
|
|
|
-41% |
|
52-week high (RUB) |
|
|
|
7 493 |
||
|
|
|
|
|
||
52-week low (RUB) |
|
|
|
|
3 291 |
|
|
|
|
|
|
|
|
Source: Bloomberg, ATON Research
*After SIA Group Deal
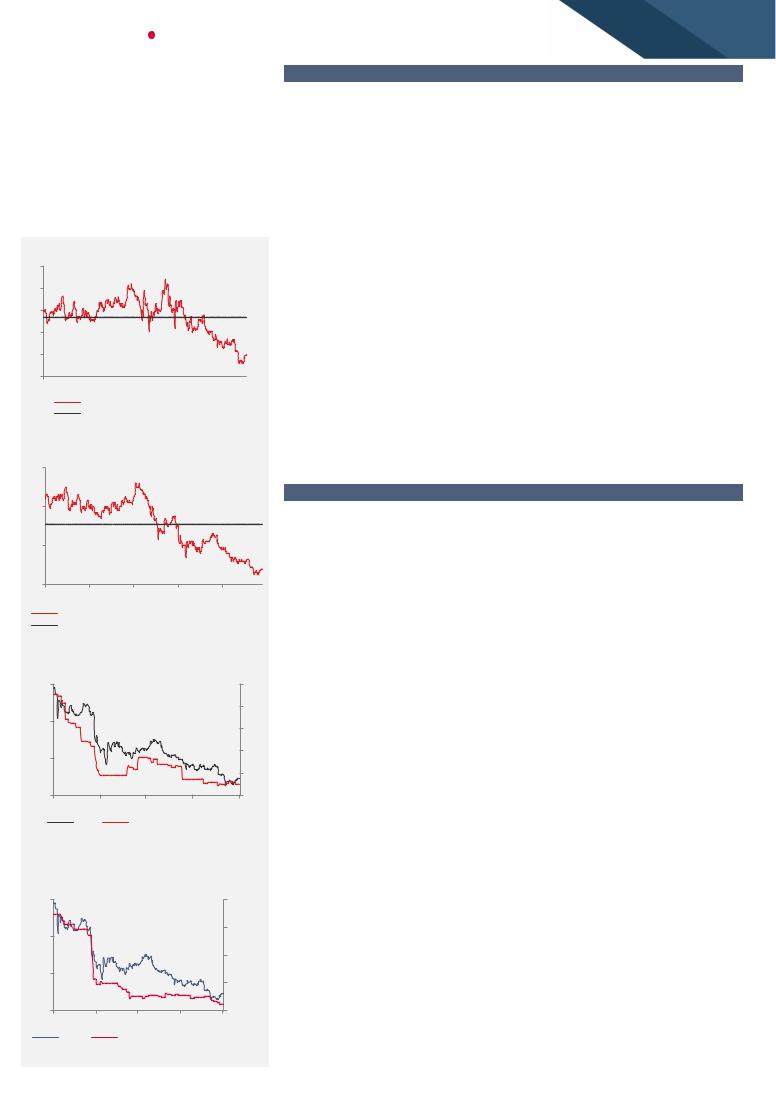
Figure 34: Magnit’s stock performance
8000
7000
6000
5000
4000
3000 


 Nov-17 Feb-18 May-18 Aug-18 Nov-18
MGNT RX
Source: Bloomberg, ATON Research
© 2018 ATON LLC. All rights reserved
In October we released “Magnit: Transformation Strategy 2018-2023: Ambitious, Risky, but Achievable”, in which we resumed our coverage of Magnit with a BUY rating and TP of RUB 4,970/$18 per share/GDR. The report was devoted to Magnit’s new strategy, and outlined the company’s ambitious turnaround plans, which if implemented, may lead to visible improvements in its financial performance over the course of 12-24 months. Yet the street will remain cautious, as the recovery could be very bumpy, given the sheer scale of the challenge, and the tough competitive and consumer environments. Magnit has performed nicely since we issued our rating (+12% GDR) and currently our target price assumes 34%/ 27% potential upside for stock and GDR, respectively.
After the announcement of the SIA deal terms minority shareholders’ caution eased, while the declared 9M18 dividends of RUB137.38 per share, implying a 3.7% dividend yield, provided a positive catalyst for the stock.
Key Takeaways from the Strategy Presentation
Aggressive openings to continue as low market share in key regions justifies expansion... Magnit aims to grow its space by 50% over 2018 – 2023 to capture 15% market share (9% for 2017). Key growth areas will be less-penetrated regions of Moscow (current market share 4%), Volga (12%), and Siberia (3%). Magnit expects to raise the number of proximity stores to 22.8k (+70%), Magnit family stores to 0.9k (+80%) from 0.5k, Magnit cosmetics stores to 9.3k (+111%) stores, and other formats by 9k. The company targets an IRR of at least 19%, and plans to add 18 distribution centres (DCs) (+49%).
Higher competition is the flipside of more aggressive growth. Magnit’s overlap with its competition will only broaden from the current levels (of over 60%). As a result, we expect just modest 8% growth in average sales densities in 2018-2023 despite the 3060% gap vs competition. However, better cost efficiency and higher sales density should help Magnit to offset growing margin pressure which it estimates at 150 bpts.
Improved customer value proposition = turnaround base case to drive sales densities and ultimately better shareholder returns if the process is successful. Store refurbishments (6k stores in 2.5 years), new formats (pharmacies, and ultra-small groceries, 9k by 2023), an extended product range (a wider offering of children’s goods and pet products), and a higher share of items unique to Magnit including more private label products (from 9% to 20%) combined with smart promo campaigns and better communication should help the company to recover after over three years of falling sales densities. Greater product and service differentiation and stronger customer loyalty will be key signs of success. The latter should boost Magnit’s financials over 12-24 months. We expect ROIC to gradually rise from around 13% to 18% in 2023.
Efficiency important weapon in battle with competitors. Apart from driving higher sales densities Magnit has a few other opportunities to improve efficiency and drive ROICs higher. Initiatives include in-house production (predominantly of food products), and improved working capital efficiency, which alone could help to release approximately RUB44bn of capital in the next 24 months (around 12% of the group’s market cap or approximately RUB430 per share). We think that the SIA Group deal may help to address WC efficiency in the cosmetics segment.
Trading well below historical average; good value but no near-term catalysts. We see merit in the valuation argument – Magnit is trading 31% off its 2Y historical average on BF P/E and 37% on BF EV/EBITDA – but the market lacks the confidence required for the stock to re-rate. We believe several quarters of improvement are needed.

vk.com/id446425943 |
|
|
|
|
|
13 |
||||
|
EQUITY RESEARCH |
CONSUMER AND RETAIL |
|
|
|
|
|
|
||
|
|
|
. |
|
|
|
|
|
|
|
|
Figure 38: Magnit at a glance |
|
|
|
|
|
|
|
|
|
|
|
|
|
|
|
|
|
|
|
|
|
|
|
2015 |
2016 |
2017 |
2018E |
2019E |
|
|
2020E |
|
|
|
|
|
|
|
|
|
|
|
|
Revenue |
|
950 613 |
1 074 812 |
1 143 314 |
1 235 455 |
1 355 742 |
|
1 489 220 |
|
|
Gross profit |
|
270 821 |
295 759 |
304 643 |
308 864 |
338 936 |
366 348 |
||
|
|
|
|
|
|
|
|
|
|
|
|
Operating profit (EBIT) |
|
82 856 |
81 967 |
58 062 |
57 716 |
63 633 |
|
73 059 |
|
|
EBITDA |
|
103 973 |
107 793 |
91 778 |
91 644 |
106 199 |
118 944 |
||
|
|
|
|
|
|
|
|
|
|
|
|
EBITDA margin |
|
10,9% |
10,0% |
8,0% |
7,4% |
7,8% |
|
8,0% |
|
|
EBITDAR |
|
134 150 |
146 264 |
137 101 |
145 666 |
166 758 |
185 238 |
||
|
|
|
|
|
|
|
|
|
|
|
|
EBITDAR margin |
|
14,1% |
13,6% |
12,0% |
11,8% |
12,3% |
|
12,4% |
|
|
Profit for the period |
|
59 061 |
54 409 |
35 539 |
36 649 |
42 468 |
50 942 |
||
|
|
|
|
|
|
|
|
|
|
|
|
BALANCE SHEET, RUBmn |
|
2015 |
2016 |
2017 |
2018E |
2019E |
|
|
2020E |
|
Property, plant and equipment |
265 996 |
289 945 |
329 827 |
344 837 |
361 316 |
|
378 458 |
||
|
Intangible assets |
|
1 397 |
1 424 |
2 268 |
2 731 |
2 850 |
2 568 |
||
|
|
|
|
|
|
|
|
|
|
|
|
Total non-current assets |
|
272 377 |
296 026 |
336 786 |
357 008 |
373 606 |
|
390 466 |
|
|
Inventories |
|
116 472 |
134 915 |
162 205 |
174 132 |
163 228 |
155 643 |
||
|
|
|
|
|
|
|
|
|
|
|
|
Total current assets |
|
131 816 |
158 890 |
189 539 |
199 122 |
192 864 |
|
221 038 |
|
|
Total assets |
|
404 193 |
454 915 |
526 325 |
556 129 |
566 470 |
611 504 |
||
|
|
|
|
|
|
|
|
|
|
|
|
Total equity |
|
165 141 |
196 077 |
259 307 |
262 964 |
288 445 |
|
313 916 |
|
|
Long-term borrowings and loans |
59 411 |
77 500 |
86 338 |
93 165 |
72 684 |
72 684 |
|||
|
|
|
|
|
|
|
|
|
|
|
|
Total non-current liabilities |
|
72 410 |
93 126 |
108 960 |
119 034 |
96 385 |
|
96 385 |
|
|
Total current liabilities |
|
166 643 |
165 713 |
158 057 |
174 130 |
181 639 |
201 202 |
||
|
|
|
|
|
|
|
|
|
|
|
|
Total equity and liabilities |
|
404 193 |
454 915 |
526 325 |
556 129 |
566 469 |
|
611 503 |
|
|
Key data |
|
2015 |
2016 |
2017 |
2018E |
2019E |
|
|
2020E |
|
ROE |
|
38.3% |
30.1% |
15.6% |
14.0% |
15.4% |
16.9% |
||
|
|
|
|
|
|
|
|
|
|
|
|
ROA |
|
15.8% |
12.7% |
7.2% |
6.8% |
7.6% |
|
8.6% |
|
|
ROIC |
|
29.3% |
23.8% |
14.3% |
12.7% |
13.8% |
|
16.2% |
|
|
|
|
|
|
|
|
|
|
|
|
|
|
|
|
|
|
|
Source: Company data, ATON Research |
|||
|
Figure 39: Magnit new vs old forecasts comparison |
|
|
|
|
|
|
|
||
|
|
|
|
|
|
|
|
|
|
|
|
|
|
2018E |
|
|
|
2019E |
|
|
|
|
|
New |
Old |
|
% |
New |
Old |
|
% |
|
|
Revenue |
1 235 455 |
1 320 937 |
|
-6,5% |
1 355 742 |
1 478 329 |
|
-8,3% |
|
|
EBITDA |
91 644 |
109 541 |
|
-16,3% |
106 199 |
125 801 |
-15,6% |
||
|
|
|
|
|
|
|
|
|
||
|
Net Income |
36 649 |
40 296 |
|
-9,1% |
42 468 |
47 245 |
|
-10,1% |
|
|
|
ATON |
Cons |
|
% |
ATON |
Cons |
|
% |
|
|
Revenue |
1 235 455 |
1 258 040 |
|
-1,8% |
1 355 742 |
1 378 718 |
-1,7% |
||
|
|
|
|
|
|
|
|
|
||
|
EBITDA |
91 644 |
91 670 |
|
0,0% |
106 199 |
102 291 |
|
3,8% |
|
|
Net Income |
36 649 |
35 987 |
|
1,8% |
42 468 |
40 356 |
5,2% |
||
|
|
|
|
|
|
|
|
Source: ATON Research |
||
© 2018 ATON LLC. All rights reserved
vk.com/id446425943CONSUMER AND
EQUITY RESEARCH
Target Price |
|
Target price per GDR (DCF),$ |
18,1 |
|
|
Target price per GDR (multiples),$ |
17,9 |
Average Target Price per GDR,$ |
18,0 |
|
|
Potential upside |
27% |
Target price per share, (DCF), RUB |
4 992 |
|
|
Target price per share (multiples) |
4 949 |
Average target price per share RUB |
4 970 |
|
|
Potential upside |
34% |
|
|
Source: Company data, ATON Research
RETAIL |
14 |
|
Valuation
12M target price. To evaluate Magnit we used a combination of DCF and multiples methods. Our combined valuation yields a 12-month target price of $18 price per GDR, which implies 27% upside potential to the CMP. Although we do not see strong catalyst for the stock performance short term we put a BUY rating on the GDR. To calculate the target price for the shares we also applied an average market discount to the GDR price of 15%. The 12M target share price of RUB4,970 anticipates 34% upside potential to the CMP. For the same reason as for GDR we assume BUY rating for the local stock.
Figure 40: Fwd P/E MGNT LI
18
16
14
12
10
8 


 Oct-16 Mar-17 Aug-17 Jan-18 Jun-18
MGNT RM Equity Multiple (BF P/E) Multiple Average (2 Years)
Source: Bloomberg, ATON Research
Figure 41: Fwd P/E MGNT RX
Multiples valuation. When considering our multiples valuation, we used the 12M forward P/E and EV/ EBITDA ratios of Magnit’s global peers operating in emerging markets (12.9x and 22.9x, correspondingly). The market-based valuation resulted in a target price of $17.9 per GDR, implying 26% upside potential to the CMP and a target price of RUB4,949 per share, indicating 33% upside potential to the CMP.
Magnit’s cost of capital was calculated using: 1) Russian corporate tax rate for retailers of 24%, 2) RFR offered on the 10-year OFZ, 3) we assume a debt premium of 5% and an EMRP of 5%. Using the debt–to–equity ratio estimated in 2018 we derive the weighted average cost of the company’s capital as 13.6%.
DCF. In order to calculate the terminal value, we assume that after 2026 future cash flows will grow at a constant rate of 5%. With our DCF model we derive a target price of $18.1 per GDR which implies 28% upside potential, and RUB4,992 per share, suggesting 34% upside potential to the CMP.
10
|
|
|
|
Risks |
|
8 |
|
|
|
|
|
|
|
|
|
Downside risks |
|
6 |
|
|
|
Lower than expected economic growth in Russia and legislation restrictions. |
|
|
|
|
|
||
|
|
|
|
While currently Magnit’s exposure to the VAT increase is likely to be limited, |
|
4 |
|
|
|
further legislation changes and a more hostile macro environment may put |
|
Oct-16 Mar-17 |
Aug-17 Jan-18 Jun-18 |
pressure on Magnit’s financial performance. |
|||
MGNT RM Equity Multiple (BF EV/EBITDA) |
|
||||
Multiple Average (2 Years) |
Growing share of promotions: increasing popularity of promotions among |
||||
|
Source: Bloomberg, ATON Research |
||||
|
shoppers and the necessity to keep up with the trend in order to maintain market |
||||
Figure 42: MGNT EPS 2019 estimates |
|||||
share may put strain on the margins of the major Russian retailers, including |
|||||
decreased 35% over 1 year |
|
||||
|
Magnit. |
||||
7500 |
|
|
600 |
||
|
|
|
|||
|
|
|
550 |
Execution and corporate governance risk. Implications in the implementation of |
|
6000 |
|
|
500 |
the new strategy may slow Magnit’s operational turnaround. |
|
|
|
|
|
||
4500 |
|
|
450 |
Upside risks |
|
|
|
|
|||
|
|
|
|
||
|
|
|
400 |
New management team efficacy. Currently a lot depends on the execution of the |
|
|
|
|
|
||
3000 |
|
|
350 |
new strategy and the effectiveness of the steps that the management team will |
|
Nov-17 |
Feb-18 May-18 |
Aug-18 Nov-18 |
undertake to reconquer its leadership position on the market. |
||
|
Price |
BEst Standard EPS adj 2019 |
|||
|
|
||||
|
Source: Company reports, ATON Research |
Faster refurbishment programme. The pilot results of the store replanning shows |
|||
|
that customers welcome the redesign (+30% revenue uplift for proximity stores, +13% in |
||||
Figure 43: MGNT EBITDA 2019 est were |
|||||
Magnit family). By the end of 2018 Magnit plans to increase the number of refurbished |
|||||
down 24% |
|
|
|||
|
|
|
|||
7500 |
|
|
140000 |
stores to 1,200. In the case of a faster pace in future we see potential upside to the base |
|
|
|
|
|
case. |
|
6000 |
|
|
130000 |
|
|
|
|
|
Increased market share. Notwithstanding the vast portfolio of Magnit stores (16, |
||
|
|
|
|
||
|
|
|
120000 |
960 stores of all formats at present), as of 2017 the retailer’s market share was only 9%. |
|
|
|
|
|
||
4500 |
|
|
110000 |
Higher penetration in the wealthier markets of Moscow and Siberia (current market |
|
|
|
|
|||
|
|
|
share is 4% and 3% correspondingly; the 2023 targets are 10% and 14%) as well as further |
||
|
|
|
|
||
3000 |
|
|
100000 expansion in other regions will help Magnit to boost market share to 15% and more and |
||
Nov-17 |
Feb-18 |
May-18 |
Aug-18 Nov-18 |
this remains the key upside risk for the Group. |
|
Price |
BEst Standard EBITDA 2019 A |
||||
|
|||||
Source: Bloomberg, Company, ATON Research
© 2018 ATON LLC. All rights reserved

vk.com/id446425943 |
|
|
||
|
EQUITY RESEARCH |
CONSUMER AND RETAIL |
|
|
|
|
|
|
|
|
Multiples Valuation |
|
EV/EBITDA |
P/E |
|
GEM peers, x |
|
12,9 |
22,9 |
|
|
|
|
|
|
Magnit's target multiples, x |
|
7,7 |
13,7 |
|
|
|
|
|
|
Average 2018-19E EBITDA, RUBmn |
98 921 |
|
|
|
|
|
|
|
|
Average 2018-19E net income, RUBmn |
|
39 558 |
|
|
|
|
|
|
|
Magnit's implied EV, RUBmn |
|
765 652 |
|
|
|
|
|
|
|
Magnit's 2018E net debt, RUBmn |
|
122 588 |
|
|
|
|
|
|
|
Magnit's implied equity value, RUBmn |
643 064 |
543 530 |
|
|
|
|
|
|
|
Price per GDR, $ |
|
19,4 |
16,4 |
|
|
|
|
|
|
TP (average EV/EBITDA and P/E), $ |
17,9 |
|
|
|
|
|
|
|
|
TP (average EV/EBITDA and P/E), RUB |
4 949 |
|
|
|
|
|
|
|
Source: Bloomberg, Company data, ATON Research
|
15 |
|
|
|
|
WACC calculation |
|
|
Tax rate |
24,0% |
|
|
|
|
Asset Beta |
1,0 |
|
|
|
|
Debt/Equity |
0,3 |
|
|
|
|
Geared Beta |
1,2 |
|
|
|
|
Risk free rate |
8,5% |
|
|
|
|
Debt premium |
5,0% |
|
|
|
|
Equity risk premium |
5,0% |
|
|
|
|
Cost of equity |
14,6% |
|
|
|
|
Cost of debt (after tax) |
10,3% |
|
|
|
|
WACC |
13,6% |
|
|
|
|
Source: Bloomberg, Company data, ATON Research
DCF valuation |
2018E |
2019E |
2020E |
2021E |
2022E |
2023E |
2024E |
2025E |
2026E |
EBIT |
57,716 |
63,633 |
73,059 |
78,239 |
80,781 |
85,048 |
91,577 |
94,003 |
94,440 |
Less taxation |
-9,742 |
-11,289 |
-13,542 |
-14,691 |
-15,228 |
-16,311 |
-17,595 |
-18,049 |
-18,081 |
|
|
|
|
|
|
|
|
|
|
Tax adjusted EBIT |
47,974 |
52,344 |
59,517 |
63,549 |
65,553 |
68,738 |
73,982 |
75,955 |
76,359 |
Depreciation and amortisation |
33,928 |
42,566 |
45,886 |
51,100 |
56,540 |
61,873 |
67,244 |
73,020 |
79,374 |
|
|
|
|
|
|
|
|
|
|
Less CAPEX |
-54,232 |
-57,603 |
-61,185 |
-65,380 |
-65,687 |
-59,117 |
-63,278 |
-66,490 |
-71,844 |
Change in working capital |
-1,725 |
28,895 |
26,175 |
1,967 |
2,566 |
3,030 |
-484 |
-508 |
-514 |
|
|
|
|
|
|
|
|
|
|
Unlevered free cash flow |
25,945 |
66,202 |
70,393 |
51,236 |
58,972 |
74,523 |
77,464 |
81,976 |
83,375 |
WACC |
13,6% |
|
|
|
|
|
|
|
|
|
|
|
|
|
|
|
|
|
|
Discounted free cash flow |
25,183 |
56,550 |
52,917 |
33,896 |
34,334 |
38,184 |
34,929 |
32,530 |
29,117 |
Future cash flow growth rate |
5.0% |
|
|
|
|
|
|
|
|
|
|
|
|
|
|
|
|
|
|
Terminal value |
1,097,771 |
|
|
|
|
|
|
|
|
Discounted terminal value |
383,366 |
|
|
|
|
|
|
|
|
|
|
|
|
|
|
|
|
|
|
PV of 2026E enterprise value |
721,005 |
|
|
|
|
|
|
|
|
Net debt |
122,588 |
|
|
|
|
|
|
|
|
|
|
|
|
|
|
|
|
|
|
Fair equity value |
598,417 |
|
|
|
|
|
|
|
|
Number of GDRs, mn |
509.5 |
|
|
|
|
|
|
|
|
|
|
|
|
|
|
|
|
|
|
Price target, $ per GDR |
18.1 |
|
|
|
|
|
|
|
|
Price target, RUB per share |
4,992 |
|
|
|
|
|
|
|
|
© 2018 ATON LLC. All rights reserved

vk.com/id446425943
EQUITY RESEARCH CONSUMER AND RETAIL
Lenta
Share Buyback to Support Stock, but Outlook Grimmer
LNTA LI |
|
|
|
|
|
|
HOLD |
Target price |
|
|
|
|
|
$4.0 |
|
Potential upside |
|
|
|
|
|
9% |
|
|
|
|
|
|
|
|
|
LNTA RX |
|
|
|
|
|
|
|
Target price share |
|
|
|
|
|
|
RUB266 |
|
|
|
|
|
|
|
|
Potential upside |
|
|
|
|
|
9% |
|
SHARE DATA |
|
|
|
|
|
|
|
No. of ordinary shares (mn) |
|
|
487.1 |
||||
3M average daily t/o shares ($mn) |
|
|
1.6 |
||||
|
|
|
|
|
|
|
|
Free float (%) |
|
|
|
|
|
58% |
|
Market capitalisation ($mn) |
|
|
1 810 |
||||
|
|
|
|
|
|
||
Enterprise value (RUBmn) |
|
|
|
222 986 |
|||
Major shareholder |
|
|
|
|
|
|
|
TPG Group |
|
|
|
|
|
|
34% |
EBRD |
|
|
|
|
|
7% |
|
|
|
|
|
|
|
|
|
FINANCIALS |
|
2017 |
|
|
2018E |
|
2019E |
(RUBmn) |
|
|
|
|
|||
|
|
|
|
|
|
|
|
Revenue |
|
365,178 |
|
416,342 |
|
453,360 |
|
|
|
|
|
|
|
|
|
EBITDA |
35,490 |
|
38,071 |
40,638 |
|||
|
|
|
|
|
|||
EBIT |
|
25,577 |
|
26,835 |
|
28,038 |
|
Net income |
|
13,264 |
|
13,702 |
|
15,608 |
|
|
|
|
|
|
|
|
|
EPGDR, RUB |
|
27.2 |
|
28.1 |
|
32.0 |
|
Valuation |
|
|
|
|
|
|
|
P/E (x) |
9.0 |
|
8.7 |
7.7 |
|||
|
|
|
|
|
|||
EV/EBITDA (x) |
|
6.3 |
|
5.9 |
|
5.5 |
|
EV/Sales (x) |
0.6 |
|
0.5 |
0.5 |
|||
|
|
|
|
|
|||
RoA (%) |
|
5.6% |
|
5.3% |
|
5.6% |
|
RoE (%) |
20.4% |
|
17.4% |
16.8% |
|||
|
|
|
|
|
|||
RoIC (%) |
|
13.9% |
|
12.4% |
|
12.0% |
|
Performance |
|
|
|
|
|
|
|
1 month (%) |
|
|
|
|
|
|
6% |
3 month (%) |
|
|
|
|
|
-26% |
|
|
|
|
|
|
|
|
|
YTD (%) |
|
|
|
|
|
|
-36% |
52-week high ($) |
|
|
|
|
|
7.3 |
|
|
|
|
|
|
|
|
|
52-week low ($) |
|
|
|
|
|
|
3.2 |
|
|
|
|
|
|
|
|
Source: Bloomberg, ATON Research
Figure 44: Lenta’s stock performance
8
7
6
5
4
3 


 Nov-17 Feb-18 May-18 Aug-18 Nov-18
LNTA LI
Source: Bloomberg, ATON Research
After its 3Q18 trading update, Lenta announced that it will no longer pursue its earlier guidance to double its selling space between 2017 and 2020. Facing a hostile macro environment and intensifying competition, Lenta has decided to constrain its opening pace in order to increase shareholder returns and drive positive FCF in 2019. Incorporating this data into our updated model we derived a target price of $4.0 per share that implies 9% of potential return. We see a short-term positive catalyst for Lenta’s stock in the form of the announced RUB11.6bn share buyback programme that is effective for 12 months. However, slower growth and deteriorating LfL sales decrease visibility. We therefore maintain our HOLD rating on Lenta.
Format risk remains the key concern for Lenta’s long-term investment case.
Weakening 3Q18 LfL sales (-0.6% vs 3.5% in 2Q) confirm investor concerns about the bigger formats’ risks. Hypermarkets remain the key format for Lenta’s business and while the supermarket segment is growing fast, hypermarkets still account for 93% of
Lenta’s sales. Hypermarkets are facing more intense competition and are expected to grow at a 3.6x lower CAGR than the smaller formats (2017-21 CAGR expected at 2.9%). The combination of slower store openings and deteriorating LfL sales will significantly retard the company’s growth.
Organic growth slowing but FCF positive. Lenta changed its earlier guidance of doubling its selling space between 2017 and 2020, and while the company reiterated the opening plan for FY18 (18 hypermarkets, 40 supermarkets), the number of openings in 2019 will be half that number or even less (with more precise guidance to be announced at the beginning of 2019). At the same time, Lenta will continue to consider possible M&A targets with an IRR threshold of 20%. However, on ATON’s estimates, the slower openings will result in RUB13bn positive FCF in FY19 (FCF yield of 13%).
Pressure on sales to persist through 4Q18 and 2019, while margins to be less affected. Lenta reported a significant QoQ slowdown of the top line expansion pace in 3Q18 (-400 bpts) due to the weak LfL sales performance (which turned to negative 0.6%). While initiatives including targeted promo and an improved assortment mix with a higher share of private label, will in our view help to attract additional traffic, the reduction in new openings will result in a significant slowdown in top line growth in 2019 (8.9% YoY vs 14% in 2018 and 19.2% in 2017). However, good cost discipline and a high space ownership rate will mitigate the respective impact on the EBITDA margin level (FY19E at 9.0% - vs 9.1% in 2018E).
Lenta’s share buyback programme to support stock performance short-term. Lenta announced a share buyback programme for up to RUB11.6bn and approximately 10% of its GDRs and 17% of free float. The programme will be effective for 12 months starting from 29 Oct 2018. Lenta will fund the programme via own funds, and will also refinance its debt due 2019.
Lenta’s current valuation is well below its average historic though the new openings guidance will lead to further consensus downgrades. We are 3.4% and 2.9% below Bloomberg consensus on 2019 revenue and EBITDA. Lenta trades at a 49% and 31% discount to its historical average of BF P/E and BF EV/EBITDA multiples, however falling estimates and lower longer-term visibility with respect to the company’s performance will likely keep the stock from re-rating in the short term.
© 2018 ATON LLC. All rights reserved

vk.com/id446425943 |
17 |
|
EQUITY RESEARCH |
CONSUMER AND RETAIL |
|
|
|
|
Figure 48: Hypermarkets segment will continue to underperform |
Figure 49: Lower selling space growth will result in constrained top |
|
|
|
line expansion |
Market volume, RUB trn |
|
|
CAGR 10.4% |
|
40% |
|
|
|
|
40% |
|
|
|
|
|
6,7 |
|
|
|
|
|||
|
|
|
|
|
|
|
|
|
|
|
|
|
|
|
|
CAGR 11% |
|
30% |
|
|
|
|
30% |
|
|
|
|
4,5 |
|
|
|
|
|
|
|
|
|
|
|
4,0 |
|
20% |
|
|
|
|
20% |
|
|
|
|
|
|
|
|
|
|
||
CAGR 5.1% |
CAGR 2.9% |
|
|
|
|
|
|
|
|
|
|
2,0 |
2,1 |
2,3 |
|
|
|
10% |
|
|
|
|
10% |
|
|
|
|
|
|
|
|
||||
|
|
|
|
|
|
0% |
|
|
|
|
0% |
|
|
|
|
|
|
2015 |
2016 |
2017 |
2018E |
2019E |
2020E |
Hypermarkets |
|
Proximity segment |
|
|
Selling space expansion |
|
Top line expansion |
||||
|
|
2016 |
2017 |
2021 |
|
|
|
||||
|
|
|
|
|
|
|
|
|
|||
|
|
Source: Company presentation, ATON Research |
|
|
Source: Company data, ATON Research |
||||||
|
Figure 50:… though will lead to RUB13bn of positive FCF in FY19 |
|
Figure 51: We expect the impact on margins to mitigated as a |
|
|
result of Lenta’s focus on internal efficiency |
|
|
|
|
25 |
|
|
|
|
|
|
|
15 |
|
|
|
|
|
|
|
5 |
|
|
|
|
|
|
|
-5 |
|
|
|
|
|
|
|
-15 |
|
|
|
|
|
|
|
-25 |
|
|
|
|
|
|
|
2013 |
2014 |
2015 |
2016 |
2017 |
2018E |
2019E |
2020E |
|
|
OCF |
Capex |
|
FCF |
|
|
|
|
Source: Company data, ATON Research |
|||||
30%
21,4% 21,5%
20%
10% |
|
|
|
|
|
|
|
9,7% 9,1% |
|
|
|
|
|
|
|||
|
|
|
|
|
|
|
|
|
|
|
|
7,0% 6,4% |
|
|
|
||
|
|
|
|
|
|
|
|
|
|
|
|
|
|
|
|
||
0% |
|
|
|
|
|
|
|
|
|
|
|
|
|
|
|
|
|
Gross Profit Margin |
|
EBITDA margin |
|
EBITMargin |
|
|
|||||||||||
|
|
|
|
|
|||||||||||||
|
|
2015 |
|
2016 |
|
2017E |
|
|
2018E |
|
2019E |
|
2020E |
|
|
||
|
|
|
|
|
|
|
|
||||||||||
|
|
|
|
|
|
|
|
|
|
|
|
|
|
|
|||
|
|
|
|
|
|
|
Source: Company data, ATON Research |
|
|
|
|||||||
Figure 52: Lenta at a glance
|
|
2015 |
|
|
2016 |
|
2017 |
|
|
2018E |
|
2019E |
|
|
2020E |
|
|
|
|
|
|
|
|
|
|
|
|
|
|
|
|
|
|
Revenue |
|
252 763 |
|
|
306 352 |
|
365 178 |
|
|
416 342 |
|
453 360 |
|
|
476 103 |
|
Gross profit |
56 305 |
|
67 768 |
78 236 |
|
89 514 |
96 778 |
|
101 061 |
|
||||||
|
|
|
|
|
||||||||||||
Operating profit (EBIT) |
|
22 332 |
|
|
23 695 |
|
25 577 |
|
|
26 835 |
|
28 038 |
|
|
28 805 |
|
EBITDA |
28 003 |
|
31 390 |
35 490 |
|
38 071 |
40 638 |
|
42 112 |
|
||||||
|
|
|
|
|
||||||||||||
EBITDA margin |
|
11,1% |
|
|
10,2% |
|
9,7% |
|
|
9.1% |
|
9.0% |
|
|
8.8% |
|
EBITDAR |
30 675 |
|
34 825 |
39 702 |
|
44 027 |
47 392 |
|
49 444 |
|
||||||
|
|
|
|
|
||||||||||||
Profit before income tax |
|
12 872 |
|
|
14 553 |
|
15 172 |
|
|
17 566 |
|
20 010 |
|
|
21 381 |
|
Profit for the period |
10 288 |
|
11 202 |
13 264 |
|
13 702 |
15 608 |
|
16 677 |
|
||||||
|
|
|
|
|
||||||||||||
BALANCE SHEET, RUBmn |
|
2015 |
|
|
2016 |
|
2017 |
|
|
2018E |
|
2019E |
|
|
2020E |
|
Property, plant and equipment |
|
104 016 |
|
|
147 812 |
|
170 308 |
|
|
181 798 |
|
183 642 |
|
|
182 529 |
|
Intangible assets |
1 092 |
|
1 890 |
1 817 |
|
1 820 |
1 795 |
|
1 729 |
|
||||||
|
|
|
|
|
||||||||||||
Total non-current assets |
|
115 040 |
|
|
161 573 |
|
178 245 |
|
|
191 832 |
|
193 651 |
|
|
192 473 |
|
Inventories |
22 782 |
|
27 491 |
36 933 |
|
42 533 |
46 404 |
|
48 807 |
|
||||||
|
|
|
|
|
||||||||||||
Total current assets |
|
63 352 |
|
|
64 597 |
|
68 485 |
|
|
77 967 |
|
91 623 |
|
|
115 973 |
|
Total assets |
178 392 |
|
226 170 |
246 731 |
|
269 800 |
285 275 |
|
308 446 |
|
||||||
|
|
|
|
|
||||||||||||
Total equity |
|
47 130 |
|
|
58 369 |
|
71 787 |
|
|
85 353 |
|
100 961 |
|
|
117 638 |
|
Long-term borrowings and loans |
65 149 |
|
66 956 |
62 194 |
|
62 194 |
59 000 |
|
60 975 |
|
||||||
|
|
|
|
|
||||||||||||
Total non-current liabilities |
|
70 403 |
|
|
74 318 |
|
70 581 |
|
|
72 708 |
|
69 513 |
|
|
71 488 |
|
Total current liabilities |
60 858 |
|
93 483 |
104 362 |
|
111 739 |
114 801 |
|
119 320 |
|
||||||
|
|
|
|
|
||||||||||||
Total equity and liabilities |
|
178 392 |
|
|
226 170 |
|
246 731 |
|
|
269 800 |
|
285 275 |
|
|
308 446 |
|
Key data |
|
2015 |
|
|
2016 |
|
2017 |
|
|
2018E |
|
2019E |
|
|
2020E |
|
ROE |
32,2% |
|
21,2% |
20,4% |
|
17.4% |
16.8% |
|
15.3% |
|
||||||
|
|
|
|
|
||||||||||||
ROA |
|
6,4% |
|
|
5,5% |
|
5,6% |
|
|
5.3% |
|
5.6% |
|
|
5.6% |
|
ROIC |
18,7% |
|
14,3% |
13,9% |
|
12.4% |
12.0% |
|
11.3% |
|
||||||
|
|
|
|
|
||||||||||||
Source: Company data, ATON Research
© 2018 ATON LLC. All rights reserved

vk.com/id446425943 |
18 |
|
EQUITY RESEARCH |
CONSUMER AND RETAIL |
|
Target Price |
|
Target price per GDR (DCF),$ |
3.7 |
|
|
Target price per GDR (multiples),$ |
4.3 |
Average Target Price per GDR,$ |
4.0 |
|
|
Potential upside |
9% |
|
|
Source: Company data, ATON Research
Figure 53: Fwd P/E LNTA LI
18
16
14
12
10
8
6 


 Oct-16 Mar-17 Aug-17 Jan-18 Jun-18
LNTA LI Equity Multiple (BF P/E) Multiple Average (2 Years)
Source: Bloomberg, ATON Research
Valuation
12M target price. To value Lenta we used a combination of DCF and multiples methods. Our combined valuation yields a 12-month target price of $4 price per GDR, which implies 9% upside potential to the CMP. Therefore, we reiterate our HOLD rating for the stock.
Multiples valuation. When considering our multiples valuation, we used 12M forward P/E and EV/ EBITDA ratios of the global EM peers (12.9x and 22.9x, respectively) and used a 57% discount to the target multiples. The market-based valuation resulted in a target price of $4.3 per GDR, implying 20% upside potential to the CMP.
Lenta’s cost of capital was calculated using: 1) the Russian corporate tax rate for retailers of 24%, 2) the RFR offered on the 10-year OFZ, 3) we assume a debt premium of 5% and an EMRP of 5%. Using the debt–to–equity ratio estimated in 2018 we derive a weighted average cost of company’s capital of 13.8%.
DCF. In order to calculate the terminal value, we assume that after 2026 future cash flows will grow at a constant rate of 2.5%. Given our DCF model we derive a target price of $3.7 per GDR which implies 1% upside potential.
Figure 54: Fwd EV/EBITDA LNTA LI
8
7
6
5
4 


 Oct-16 Mar-17 Aug-17 Jan-18 Jun-18
LNTA LI Equity Multiple (BF EV/EBITDA) Multiple Average (2 Years)
Source: Bloomberg, ATON Research
Figure 55: Lenta FY19E Revenue estimates was down 5.8% this year
400
360 |
500000 |
|
|
320 |
490000 |
|
|
280 |
|
240 |
480000 |
|
|
200 |
470000 |
Nov-17 Feb-18 May-18 Aug-18 |
|
Price |
BEst Standard Revenue 2019 A |
Source: Company reports, ATON Research
Figure 56: Lenta FY19E EBITDA estimates decreased 11% in last 12m
400 |
49000 |
360 |
47500 |
|
|
320 |
|
|
46000 |
280 |
|
240 |
44500 |
|
|
200 |
43000 |
Nov-17 Feb-18 |
May-18 Aug-18 |
Price |
BEst Standard EBITDA 2019 A |
Source: Bloomberg, Company, ATON Research
Risks
Downside risks
Deteriorating macroeconomic conditions: low inflation and slow economic growth will impact all players in the Russian economy
Format risk remains the key concern for long term performance. Hypermarkets, which remain the Lenta’s main format by revenue contribution, will be affected by the slower growth pace and traffic cannibalisation from smaller formats (proximity stores, discounters).
Industry consolidation and tougher competition: Lenta will suffer increasing pressure from larger players like Magnit and X5 Retail Group, especially taking into account their newly approved strategies that provide for significant faster expansion than Lenta’s.
Upside risks
Strong margins: Lenta has always been the industry leader in terms of EBITDA margin (due to the higher share of owned space, approximately 76%) and we expect that it will be able to maintain a high level of profitability.
Higher shopper retention achieved due to strong loyalty programme. In 2000 Lenta was the first retailer to introduce a loyalty programme and since then the number of active cardholders has surpassed 13.8mn people in 3Q18. If the group is able further build up this competitive advantage it may lead to higher LfL traffic than expected.
© 2018 ATON LLC. All rights reserved

vk.com/id446425943 |
|
|
||
|
EQUITY RESEARCH |
CONSUMER AND RETAIL |
|
|
|
|
|
|
|
|
Multiples Valuation |
|
EV/EBITDA |
P/E |
|
GEM peers, x |
|
12,9 |
22,9 |
|
Assumed premium/(discount) |
|
-57% |
-57% |
|
Lenta's target multiples, x |
|
5,5 |
9,8 |
|
Lenta's 2018E-2019E EBITDA, RUBmn |
39 354 |
|
|
|
Lenta's 2018E-2019E net income, RUBmn |
|
14 655 |
|
|
Lenta's implied EV, RUBmn |
|
218 298 |
|
|
Lenta's 2018E net debt, RUBmn |
|
88 604 |
|
|
Lenta's implied equity value, RUBmn |
129 694 |
144 305 |
|
|
Price per GDR, US$ |
|
4.1 |
4.6 |
|
Price per GDR, US$ |
|
4.3 |
|
Source: Bloomberg, Company data, ATON Research
19
|
WACC calculation |
|
|
|
|
Tax rate |
|
24,0% |
|
|
|
|
|
|
|
Asset Beta |
|
1,0 |
|
|
Debt/Equity |
1,1 |
||
|
|
|||
|
Geared Beta |
|
1,8 |
|
|
Risk free rate |
8,5% |
||
|
|
|||
|
Debt premium |
|
5,0% |
|
|
Equity risk premium |
5,0% |
||
|
|
|||
|
Cost of equity |
|
17,7% |
|
|
Cost of debt (after tax) |
10,3% |
||
|
|
|||
|
WACC |
|
13,8% |
|
|
|
|
|
|
Source: Bloomberg, Company data, ATON Research
DCF valuation |
2018E |
2019E |
2020E |
2021E |
2022E |
2023E |
2024E |
2025E |
2026E |
EBIT |
26,835 |
28,038 |
28,805 |
27,315 |
25,652 |
23,745 |
21,612 |
20,121 |
19,374 |
Less taxation |
-3,865 |
-4,402 |
-4,704 |
-4,517 |
-4,342 |
-4,080 |
-3,806 |
-3,718 |
-3,929 |
|
|
|
|
|
|
|
|
|
|
Tax adjusted EBIT |
22,970 |
23,636 |
24,101 |
22,797 |
21,311 |
19,664 |
17,806 |
16,403 |
15,444 |
Depreciation and amortisation |
11,236 |
12,599 |
13,307 |
13,890 |
14,415 |
14,941 |
15,468 |
16,009 |
16,567 |
|
|
|
|
|
|
|
|
|
|
Less CAPEX |
-22,100 |
-14,041 |
-11,752 |
-9,208 |
-9,519 |
-9,273 |
-9,508 |
-9,861 |
-10,133 |
Change in working capital |
-125 |
1,001 |
690 |
617 |
526 |
523 |
495 |
489 |
498 |
|
|
|
|
|
|
|
|
|
|
Unlevered free cash flow |
11,981 |
23,195 |
26,346 |
28,096 |
26,732 |
25,856 |
24,261 |
23,040 |
22,376 |
WACC |
13.8% |
|
|
|
|
|
|
|
|
|
|
|
|
|
|
|
|
|
|
Discounted free cash flow |
11,756 |
20,005 |
19,973 |
18,722 |
15,657 |
13,311 |
10,979 |
9,165 |
7,823 |
Future cash flow growth rate |
2.5% |
|
|
|
|
|
|
|
|
|
|
|
|
|
|
|
|
|
|
Terminal value |
225,927 |
|
|
|
|
|
|
|
|
Discounted terminal value |
78,990 |
|
|
|
|
|
|
|
|
|
|
|
|
|
|
|
|
|
|
PV of 2026E enterprise value |
206,380 |
|
|
|
|
|
|
|
|
Net debt |
88,604 |
|
|
|
|
|
|
|
|
|
|
|
|
|
|
|
|
|
|
Fair equity value |
117,775 |
|
|
|
|
|
|
|
|
Number of GDRs, mn |
487.1 |
|
|
|
|
|
|
|
|
|
|
|
|
|
|
|
|
|
|
Price target, $ per GDR |
3.7 |
|
|
|
|
|
|
|
|
Potential upside |
1% |
|
|
|
|
|
|
|
|
Figure 57: Lenta new vs old forecasts comparison
|
|
2018E |
|
|
2019E |
|
|
|
|
|
|
|
|
|
New |
Old |
% |
New |
Old |
% |
Revenue |
416 342 |
417 660 |
-0,3% |
453 360 |
477 927 |
-5,1% |
EBITDA |
38 071 |
41 161 |
-7,5% |
40 638 |
46 462 |
-12,5% |
|
|
|
|
|
|
|
Net Income |
13 702 |
13 977 |
-1,9% |
15 608 |
17 013 |
-8.2% |
|
ATON |
Cons |
% |
ATON |
Cons |
% |
Revenue |
416 342 |
423 634 |
-1,5% |
453 341 |
469 060 |
-3,4% |
EBITDA |
38 071 |
39 048 |
-2,5% |
40 638 |
42 596 |
-4,6% |
|
|
|
|
|
|
|
Net Income |
13 702 |
14 779 |
-7,2% |
15 608 |
17 090 |
-8,6% |
|
|
|
|
|
|
|
Source: ATON Research
© 2018 ATON LLC. All rights reserved

vk.com/id446425943
EQUITY RESEARCH CONSUMER AND RETAIL
O’KEY
Turnaround to Take More Time
OKEY LI |
|
|
|
|
|
|
SELL |
Target price share |
|
|
|
|
|
$1.4 |
|
Potential downside |
|
|
|
|
|
-10% |
|
|
|
|
|
|
|
|
|
SHARE DATA |
|
|
|
|
|
|
|
No. of ordinary GDRs (mn) |
|
|
|
269 |
|||
3M average daily t/o shares |
|
|
0.1 |
||||
(RUBmn) |
|
|
|
|
|
||
|
|
|
|
|
|
|
|
Free float (%) |
|
|
|
|
|
20% |
|
Market capitalisation ($mn) |
|
|
425 |
||||
|
|
|
|
|
|
||
Enterprise value (RUBmn) |
|
|
|
60 413 |
|||
Major shareholder |
|
|
|
|
|
|
|
NISEMAX Co |
|
|
|
|
|
|
51% |
GSU |
|
|
|
|
|
30% |
|
|
|
|
|
|
|
|
|
FINANCIALS |
|
2017 |
|
|
2018E |
|
2019E |
(RUBmn) |
|
|
|
|
|||
|
|
|
|
|
|
|
|
Revenue |
|
177,455 |
|
167,947 |
|
175,546 |
|
|
|
|
|
|
|
|
|
EBITDA |
9,335 |
|
7,819 |
8,908 |
|||
|
|
|
|
|
|||
EBIT |
|
7,590 |
|
3,284 |
|
3,817 |
|
Net income |
3,167 |
|
171 |
948 |
|||
|
|
|
|
|
|||
EPGDR, RUB |
|
11.8 |
|
0.6 |
|
3.5 |
|
DPGDR, RUB |
5.4 |
|
7.1 |
1.3 |
|||
|
|
|
|
|
|
|
|
Valuation |
|
|
|
|
|
|
|
P/E (x) |
8.9 |
|
164.6 |
29.8 |
|||
|
|
|
|
|
|||
EV/EBITDA (x) |
|
6.5 |
|
7.7 |
|
6.8 |
|
EV/Sales (x) |
0.3 |
|
0.4 |
0.3 |
|||
|
|
|
|
|
|||
RoA (%) |
|
3.3% |
|
0.2% |
|
1.1% |
|
RoE (%) |
12.6% |
|
0.8% |
4.1% |
|||
|
|
|
|
|
|||
RoIC (%) |
|
11.6% |
|
5.6% |
|
6.6% |
|
Performance |
|
|
|
|
|
|
|
1 month (%) |
|
|
|
|
|
|
6% |
3 month (%) |
|
|
|
|
|
-19% |
|
|
|
|
|
|
|
|
|
YTD (%) |
|
|
|
|
|
|
-37% |
52-week high ($) |
|
|
|
|
|
2.8 |
|
|
|
|
|
|
|
|
|
52-week low ($) |
|
|
|
|
|
|
1.4 |
|
|
|
|
|
|
|
|
Source: Bloomberg, ATON Research
Figure 58: OKEY stock performance
3
2,5
2 |
|
|
|
|
1,5 |
|
|
|
|
1 |
|
|
|
|
Nov-17 |
Feb-18 |
May-18 |
Aug-18 |
Nov-1 |
OKEY LI
Source: Bloomberg, ATON Research
© 2018 ATON LLC. All rights reserved
O’KEY remains the only retailer that has not yet disclosed its 3Q18 operating results. While the group has been at pains to improve its profitability (gross margin as of 1H18 +60 bpts YoY, EBITDA margin +17 bpts), the more cautious guidance announced for FY18 highlights that strong competition remains one of the key issues for retailers, while a lack of visibility on a material profitability enhancement in the DA! Segment will continue to weigh on the stock. The appointment of Armin Burger as CEO of the Group (also CEO of DA! Brand) indicates an increasing focus on discounters. In the absence of strong catalysts and material improvements in the company’s core hypermarket format we maintain our SELL rating and lower our target price to $1.4 per GDR.
Poor macro continues to have negative impact on retailers’ business. The Group expects that shelf deflation will continue for a while and does not see the promoactivity declining in the mid-term. Promotions remain one of the key tools for retailers to attract customers and attitudes may only change if the market consolidates.
However, O’KEY continues to focus on cost optimisation as new initiatives are expected to boost EBITDA margin by 1 ppt in two years (+17 bpts YoY as of 1H18).
RUB7bn proceeds from supermarket sale will be directed at the development of discounters, and hypermarkets’ renovation. O’KEY decided to sell the supermarket business to X5 last year, and the divestiture was necessary to free up resources and concentrate on the three key pillars of the new O’KEY strategy: the core hypermarkets business, e-commerce, and discounters.
The selling space optimisation in hypermarkets remains a key priority in order to drive sales densities. Currently O’KEY targets sales density at RUB400 ths –
RUB500ths per sqm. In those stores that have trouble in complying with the threshold,
O’KEY Group will decrease selling space and will attract external partners (for example, off-price chain Familia) to the fill the vacant space. Under its strategic partnership with Familia, the total space leased out is 5.7k sqm (while the total selling space of the hypermarkets segment decreased to 529.6k sqm). New partners are selected from those chains that will not harm or cannibalise O’KEY’s business but will generate additional traffic for the Group.
Discounters will break-even when the chain exceeds 100-110 stores; at 200 stores, discounters’ EBITDA margin may reach 4-6%. O’KEY is not considering an SPO to fund the discounter expansion but may attract private equity financing if additional resources are needed for the rapid format expansion. According to the current guidance, O’KEY has revised downwards its opening plan for discounters, and guides for up to 25 new stores in 2018 and around 50 openings in 2019.
O’KEY sees potential in developing its online channel. Currently the company is able to process 150-200 orders per day in store which is insufficient to meet demand.
However, O’KEY is preparing to launch dark stores that are convenient for collections, and will increase the number of orders to up to 3-4 thousand per day. Moreover, the costs associated with compiling an order in a dark stores are expected to be 27%-33% lower than in a traditional store even without process automation (in-store expenses are around RUB550-600 per order, in dark stores costs will equal approximately RUB400).
The buyback does not mean that there will be no dividends. O’KEY Group announced that it will launch a buyback programme for the purposes of its new and as yet unpresented LTI programme. However, company has refuted rumours that the buyback programme will usurp its dividend payment. According to management, assuming the net debt to EBITDA ratio is at a comfort level of 2.7x-3.0x, the Group will be able to pay out RUB1.8-2bn in dividends.