

CITI - Mid Year Outlook 2019_watermark
.pdfvk.com/id446425943
2019 Mid Year Outlook
Embracing Uncertainty in a Slower
Growth Environment
Wealth Management – June 2019
INVESTMENT PRODUCTS: NOT A BANK DEPOSIT. NOT GOVERNMENT INSURED. NO BANK GUARANTEE. MAY LOSE VALUE

vk.Marketcom/id446425943Performance
|
|
|
|
|
Market Performance |
|
|
|
|
|
||
|
|
|
|
|
|
|
|
|
|
|
|
|
|
Market Index |
2017 |
1Q18 |
2Q18 |
|
3Q18 |
4Q18 |
2018 |
1Q19 |
QTD |
YTD |
|
|
|
2Q19 |
2019 |
|
||||||||
|
|
|
|
|
|
|
|
|
|
|
||
|
|
|
|
|
|
|
|
|
|
|
|
|
|
Global Equities |
23.1% |
-1.1% |
1.9% |
|
5.1% |
-13.3% |
-8.2% |
12.7% |
2.1% |
15.1% |
|
|
US |
|
|
|
|
|
|
|
|
|
|
|
|
21.8% |
-0.8% |
3.4% |
|
7.7% |
-13.5% |
-4.4% |
13.6% |
2.5% |
16.5% |
|
|
|
|
|
|
|
|
|
|
|
|
|
|
|
|
Europe |
11.2% |
-4.0% |
4.3% |
|
1.3% |
-11.5% |
-10.3% |
13.3% |
2.1% |
15.6% |
|
|
Asia |
|
|
|
|
|
|
|
|
|
|
|
|
41.8% |
0.6% |
-5.4% |
|
-1.5% |
-8.8% |
-14.4% |
11.4% |
-4.5% |
6.4% |
|
|
|
Japan |
|
|
|
|
|
|
|
|
|
|
|
|
21.3% |
-5.1% |
4.1% |
|
9.0% |
-16.9% |
-10.4% |
6.8% |
-0.8% |
6.2% |
|
|
|
|
|
|
|
|
|
|
|
|
|
|
|
|
China H |
29.6% |
2.5% |
-6.2% |
|
1.9% |
-8.1% |
-10.0% |
12.4% |
-6.6% |
5.0% |
|
|
|
|
|
|
|
|
|
|
|
|
|
|
|
China A |
24.3% |
-3.3% |
-9.0% |
|
-0.9% |
-12.4% |
-23.6% |
28.7% |
-4.2% |
23.2% |
|
|
|
|
|
|
|
|
|
|
|
|
|
|
|
Emerging Markets |
37.5% |
1.4% |
-7.9% |
|
-1.0% |
-7.6% |
-14.5% |
9.9% |
-2.8% |
6.9% |
|
|
Global IG Bonds |
|
|
|
|
|
|
|
|
|
|
|
|
7.1% |
1.2% |
-2.7% |
|
-0.9% |
1.1% |
-1.3% |
2.3% |
2.1% |
4.3% |
|
|
|
Global HY Bonds |
|
|
|
|
|
|
|
|
|
|
|
|
7.0% |
-0.7% |
1.1% |
|
2.4% |
-4.7% |
-2.1% |
7.4% |
1.4% |
8.8% |
|
|
|
EM Sovereigns |
|
|
|
|
|
|
|
|
|
|
|
|
9.7% |
-2.1% |
-3.6% |
|
2.3% |
-0.7% |
-4.1% |
6.1% |
2.7% |
8.9% |
|
|
|
|
|
|
|
|
|
|
|
|
|
|
|
|
Gold |
13.5% |
1.7% |
-5.5% |
|
-4.9% |
7.7% |
-1.6% |
0.8% |
3.9% |
4.7% |
|
|
|
|
|
|
|
|
|
|
|
|
|
|
|
Oil (Brent) |
17.7% |
5.1% |
13.0% |
|
4.1% |
-35.0% |
-19.5% |
27.1% |
-10.4% |
14.0% |
|
|
|
|
|
|
|
|
|
|
|
|
|
|
|
|
|
|
|
|
|
|
|
|
|
|
|
|
Dollar Index |
-9.9% |
-2.3% |
5.0% |
|
0.7% |
1.1% |
4.4% |
1.2% |
-0.3% |
0.9% |
|
|
|
|
|
|
|
|
|
|
|
|
|
|
|
Source: Bloomberg L.P. As of 13 June 2019. |
|
|
|
|
|
|
|
|
|
||
2 |
Returns for Europe and Japan are in local currency. |
|
|
|
|
|
|
|
|
|
||
|
|
|
|
|
|
|
|
|
|
|
|
|
|
|
|
|
|
|
|
|
|
|
|
|
|
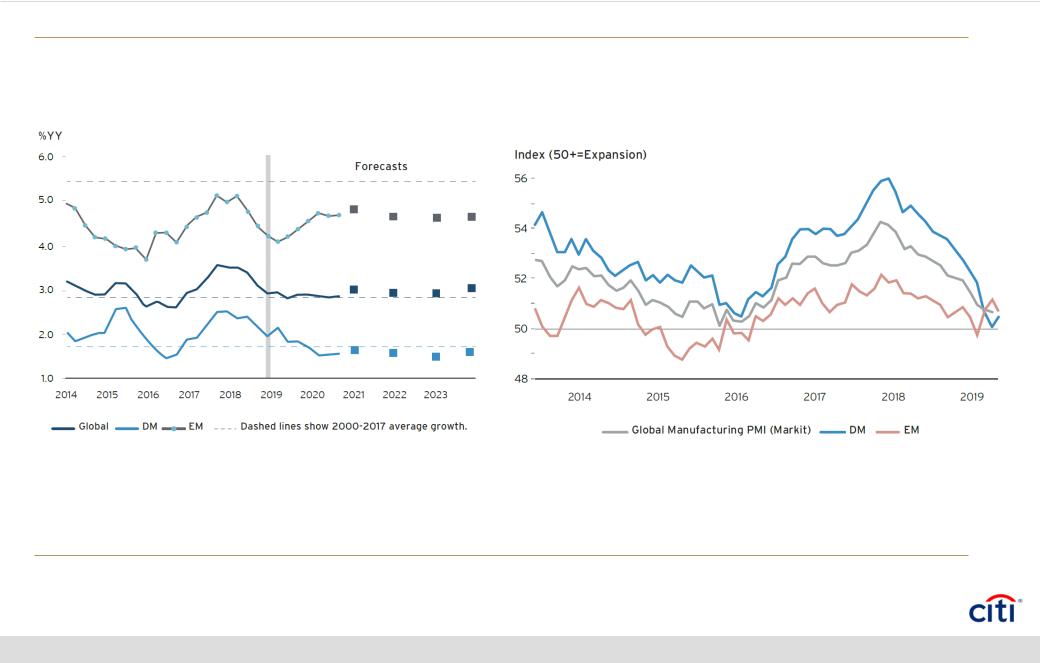
vk.Divergencecom/id446425943 in Global Growth
Global — Real GDP Growth (%YY) |
Global, DM, EM - Manufacturing PMI (Index), 2012-2019 Apr |
Source: Citi. As of 22 May 2019. |
Source: Citi. As of 22 May 2019. |
3
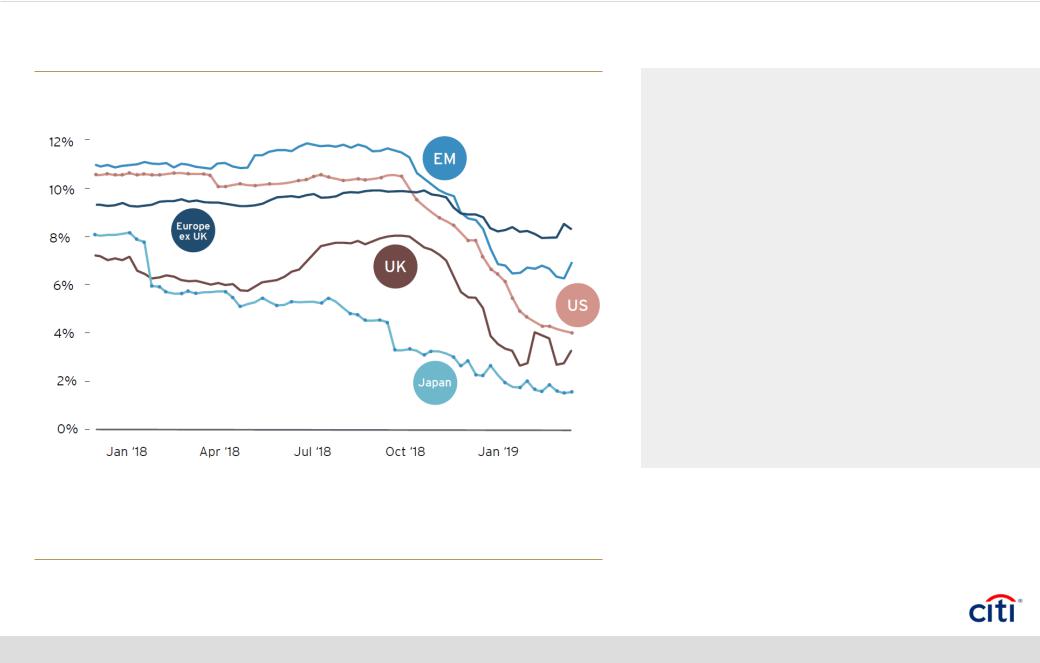
vk.Earningscom/id446425943 Slowing, Not Reversing
2019E EPS Growth By Region
Source: Citi. As of 3 April 2019.
4
•Citi analysts expect global EPS growth of 4% in 2019, slightly below consensus estimate of 5%.
•Markets will start looking towards global EPS prospects in 2020, where consensus currently forecasts 11% growth.
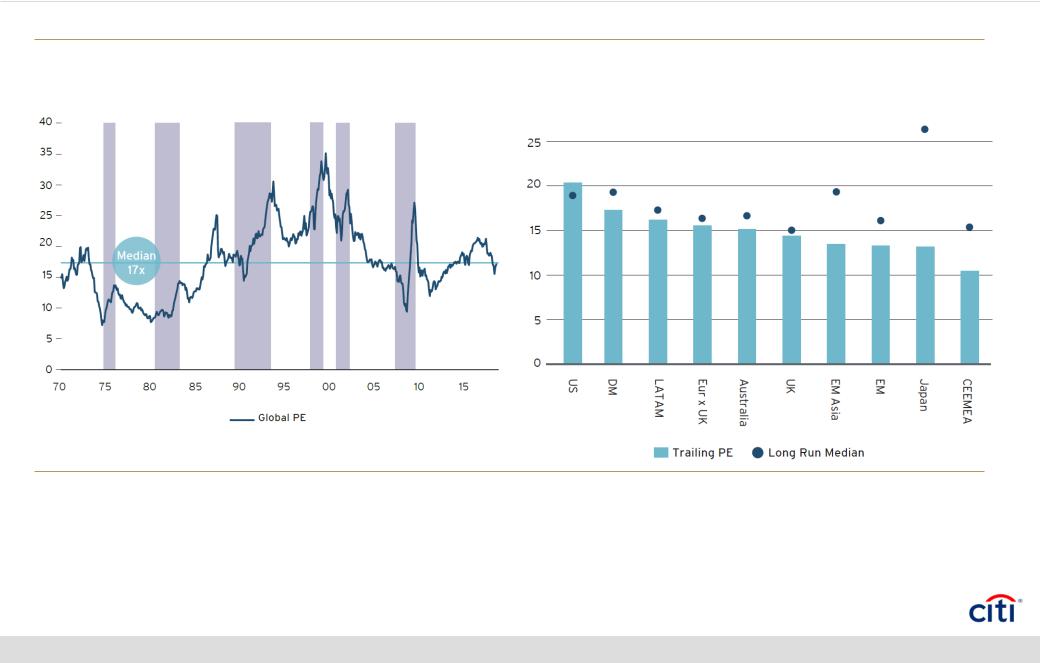
vk.Valuations:com/id446425943 EM cheaper than DM
MSCI AC World Trailing PE |
MSCI Regional Trailing PEs |
Source: Citi. As of 3 April 2019. |
Source: Citi. As of 3 April 2019. |
5
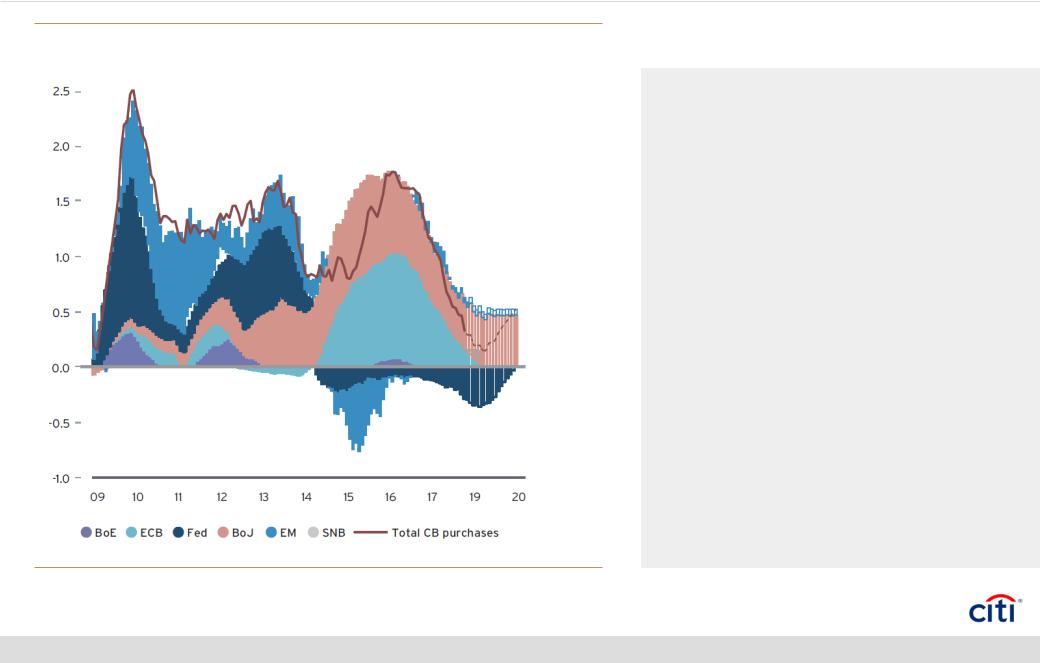
vk.Monetarycom/id446425943 Policy Remains Accommodative
Total Central Bank Purchases (12m Rolling In $tn)
Source: Citi. As of 3 April 2019.
6
•If the current weakening in financial conditions and negative trade impact spreads to overall domestic economic weakness, the Fed could follow financial markets with interest rate cuts.
•Recent changes in monetary policies of major central banks (CB) suggest that net 12-month CB asset purchases change from previous projections of -
$85bn to +$200bn by the end of 2019.
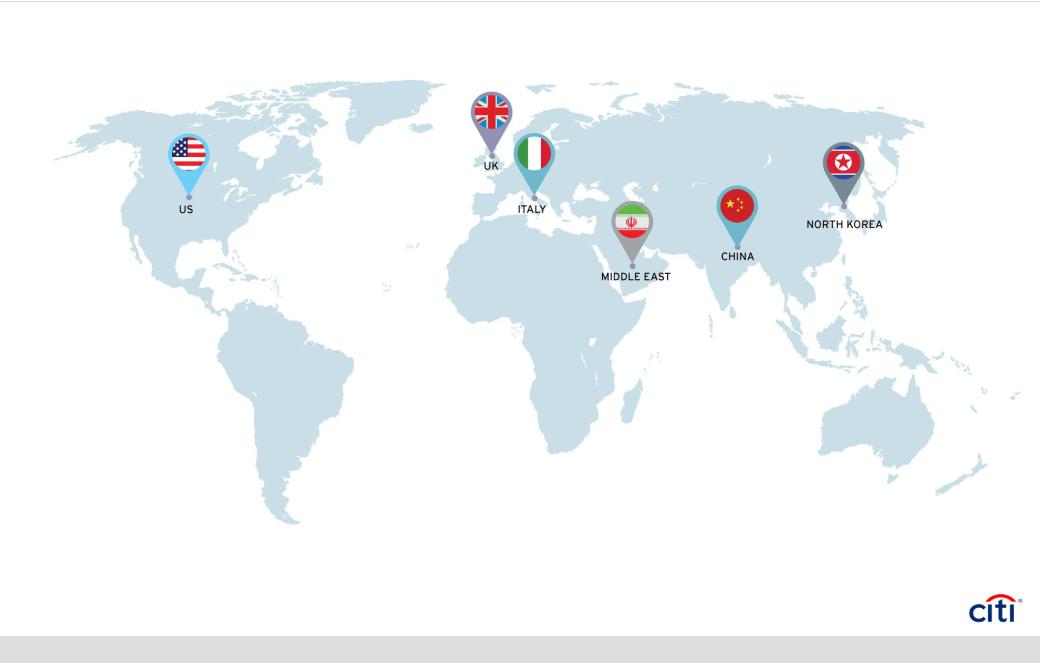
vk.Politicalcom/id446425943risks remain elevated
|
UK: Brexit transition |
|
|
deal |
|
|
North |
|
|
Korea: |
|
US: Trade |
Geopolitical |
|
Tensions with |
tensions |
|
China, Europe, |
Europe: Italian |
|
budget woes, |
||
Japan |
||
Trade dispute |
||
|
||
|
China: Trade Tensions |
|
|
Middle East: |
|
|
Escalation of Iran |
|
|
Sanctions |
7
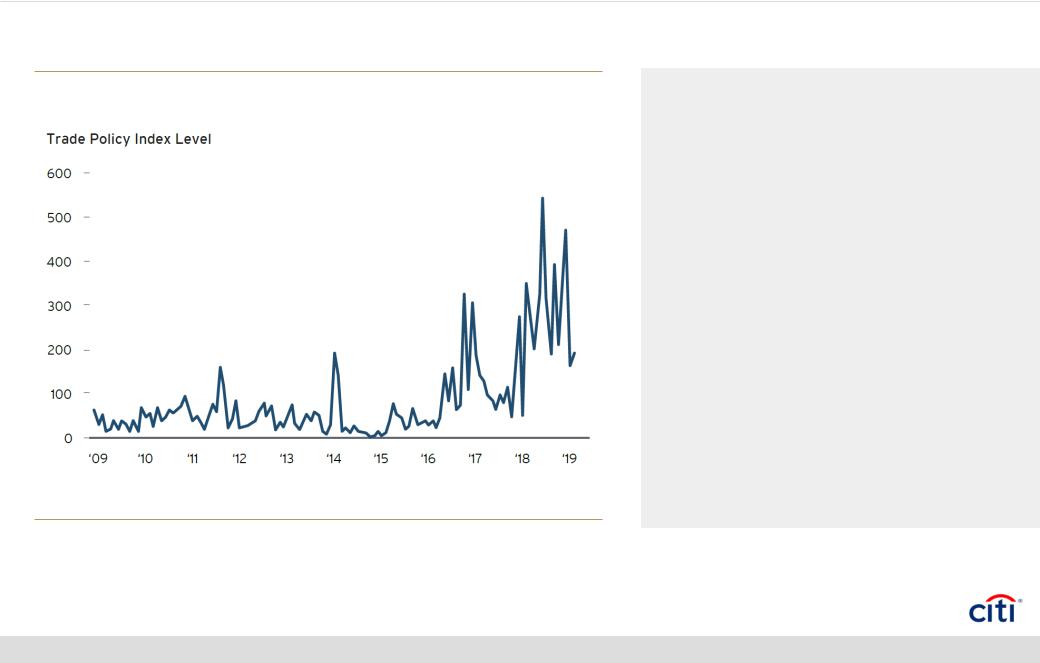
vk.Arecom/id446425943trade tensions priced in?
US Trade Uncertainty
Source: Citi. As of 6 May 2019.
8
•Citi analysts continue to see markets as unprepared for the heightened risk of a prolonged economic struggle that could extend beyond US and China.
•US-EU trade tensions have not peaked despite the delay in the implementation of the auto tariffs on the EU and Japan (for 6 months in exchange of a deal to restrict exports to the US).
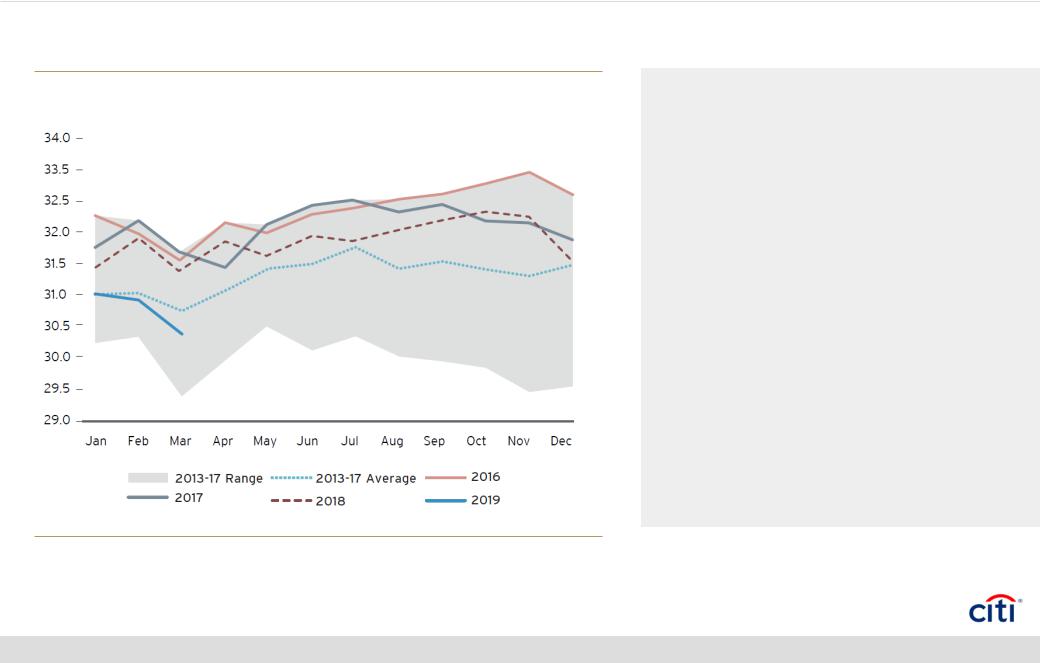
Commodities: Oil Supply Disruption Appears
vk.com/id446425943
Supportive
OPEC Crude Production (million barrels/day)
•Oil supply disruption is likely to support Brent prices even if a trade war were to escalate.
•Citi analysts foresee Brent prices hitting a short-term target of US$75/bbl once again, possibly overshooting towards US$78/bbl.
Source: Citi. As of 8 May 2019.
9

vk.1com/id446425943. Navigating Volatility
The costs of poor market timing are severe
• Following the sharp equity rally in 1Q19, it makes sense to derisk portfolios ahead of the seasonally weaker summer months and the ongoing volatility.
• However, Citi analysts caution against broad-based selling and market timing.
Source: Citi. As of 21 May 2019.
1 0