

DB China Industrial Automation_watermark
.pdfChina Industrial Automation
vk.com/id446425943 |
|
|
|
|
Deutsche Bank |
|
|
|
|
Research |
|
|
|
|
Asia |
|
Industry |
|
Date |
|
|
|||
China |
|
China Industrial |
|
13 November 2018 |
|
|
|
||
Industrials |
|
Automation |
|
Forecast Change |
Manufacturing |
|
|
||
|
|
|
|
|
Feel the pulse (Oct, 2018) – negative momentum building up
How bad is it?
Pretty bad, per our latest channel checks. Not only did China’s IA demand slow further in October, but the outlook in the coming months has also turned cloudier. The channel checks match our forecast model, which now predicts -0.4% YoY growth for 4Q (vs. +4% forecast previously) as most leading indicators continued to trend south. Major local players, due to their better exposure, are placed to outperform MNCs with even larger margins. Within MNCs, JP/TW companies are likely to su er more than US/EU ones, due to their heavier exposure to 3C and auto and more product sales.
When will the bottom come?
M1, equipment investment, and manufacturing PMI, which lead China's IA demand by 3-4 quarters, have continued to drop YTD. Meanwhile, the government hasn't unveiled any specific supportive policies for manufacturing sectors, and it typically takes 2-3 quarters for policies to translate into demand. Together with a high base in 1H18, IA demand is highly likely to continue to struggle in the coming 1-2 quarters, with a chance of posting new lows in 1H19. Looking into the last cycle, most IA stocks in the region started re-rating in 1Q16 along with the bottoming out of China's IA demand.
Channel checks – overwhelmingly negative
Gongkong expects overall demand to continue to slow (+2-4% in October, flattish in November, and negative growth in December vs. +4.8% in 3Q), on corporates' lower investment appetite and a tough comp. A leading local player also saw orders (mainly servo and inverters) slow to 20% plus in October (vs. +40% for 9M). Management also claimed the outlook remains challenging, especially for the servo business, which is heavily weighed by the weakness in electronics and machine tools. A domestic IA distributor witnessed a 50% YoY order decline in October (vs. 30-40% in 3Q), with weakness across all the downstream verticals. In terms of November, the distributor claimed no rebound at all.
Stock calls – prefer leading locals
Our forecast models now anticipate local players outperforming MNCs with even bigger margins, thanks to their more favorable vertical exposure (ie more general manufacturing sectors). Thus, we continue to prefer locals inc. Inovance, Estun, HOLI and believe LT value for these names has emerged. Investors may start accumulating and hedge with MNCs. We trim our earnings forecasts for Inovance and Estun, given the cloudier outlook and softer-than-expected 3Q.
Sky Hong, CFA Research Analyst +852-2203 6131
Key Changes |
|
|
Company |
Target Price |
Rating |
002747.SZ |
17.00 to 16.00 |
- |
300124.SZ |
34.00 to 32.00 |
- |
Source: Deutsche Bank |
|
|
|
|
|
Top picks |
|
|
Hollysys Automation Technol |
Buy |
|
(HOLI.OQ),USD18.93 |
|
|
Estun Automation (002747.SZ),CNY9.28 |
Buy |
|
Shenzhen Inovance Technolog |
Buy |
|
(300124.SZ),CNY24.27 |
|
|
Source: Deutsche Bank
Valuations and risks:
We use the DCF method to value the IA companies, given the stable cash flows. For Estun, our new TP comes to RMB16 (vs. RMB17 previously), which implies 40x 2020E P/E. We think this looks reasonable, given 53% EPS CAGR projected in 2017-20E. We continue to like Inovance, given its leading position in China's IA market, leveraging its advanced technology know-how and widest range of IA and NEV products. Along with its active position in large power inverters, we expect a 23% earnings CAGR in 2017-20E. Our new TP of RMB32 (vs. RMB34 previously) implies 36x 2019E P/E. For HOLI, we expect stable demand in process automation and the company's penetration in other verticals to drive very strong orders for its IA business ahead. We maintain our Buy and our TP of US$29 corresponds to a non-GAAP- based P/E of 14x on FY19E, supported by 16% EPS CAGR over FY18-21E. Key risks: slower-than-expected IA growth and import substitutions.
Deutsche Bank AG/Hong Kong
Deutsche Bank does and seeks to do business with companies covered in its research reports. Thus, investors should be
Distributed on: 13/11/2018 12:42:07 GMT aware that the firm may have a conflict of interest that could a ect the objectivity of this report. Investors should consider
this report as only a single factor in making their investment decision. DISCLOSURES AND ANALYST CERTIFICATIONS ARE LOCATED IN APPENDIX 1. MCI (P) 091/04/2018. THE CONTENT MAY NOT BE DISTRIBUTED IN THE PEOPLE'S REPUBLIC OF CHINA ("THE PRC") (EXCEPT IN COMPLIANCE WITH THE APPLICABLE LAWS AND REGULATIONS OF PRC), EXCLUDING SPECIAL ADMINISTRATIVE REGIONS OF HONG KONG AND MACAU.
7T2se3r0Ot6kwoPa
vk.com/id446425943
13 November 2018 Manufacturing
China Industrial Automation
Key thesis in charts
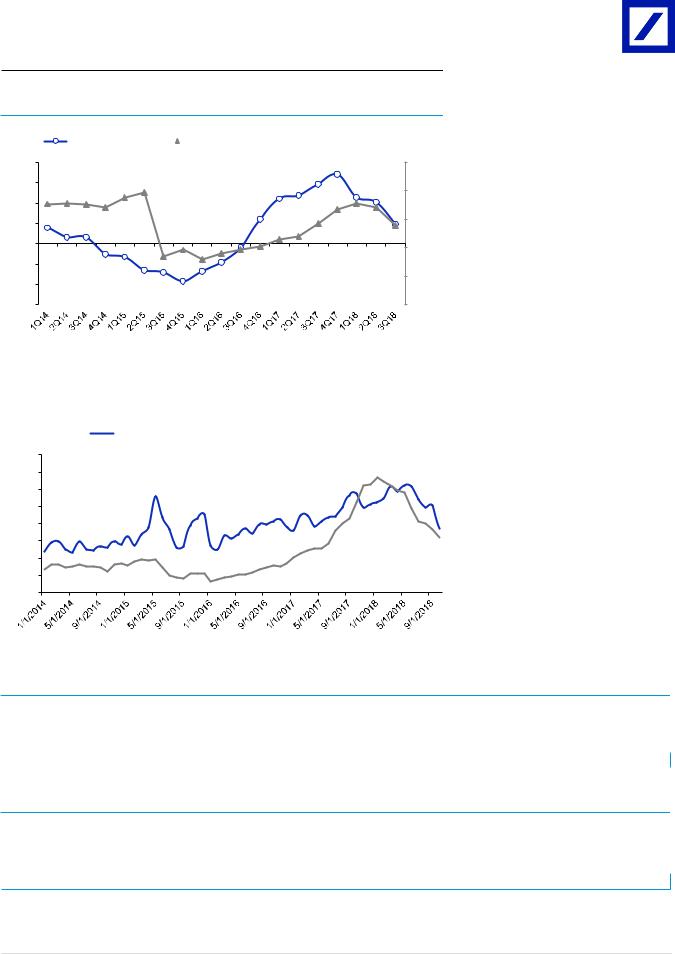
Figure 1: IA stocks move along with China's IA demand
China's IA demand |
|
Stock performance in the region (1Q11=100%, RHS) |
|
20% |
|
|
|
17% |
|
250% |
|
|
|
15% |
|
|
|
15% |
|
|
|
|
|
|
|
|
12% |
11% |
|
200% |
|
|
|
|
10% |
|||
10% |
|
|
|
|
|
|
5% |
|
|
11% |
|
5% |
150% |
|
|
|
|
|
||
4% |
|
6% |
|
|
|
|
|
|
|
|
|
||
0% |
2% 2% |
|
-1% |
|
|
|
|
|
|
|
|
||
|
|
|
|
|
100% |
|
|
-3% |
|
|
|
|
|
-5% |
-3% |
-5% |
|
|
|
|
|
-7% -7% |
|
|
|
||
|
|
-7% |
|
|
50% |
|
-10% |
|
|
-9% |
|
|
|
|
|
|
|
|
||
|
|
|
|
|
|
|
-15% |
|
|
|
|
|
0% |
Source: Deutsche Bank, Wind, Gongkong
IA stocks in the region started re-rating in 1Q16 when China's IA demand troughed in the 4Q15-1Q16 period.
Figure 2: Major local players outperformed MNCs
Local stock performance |
|
JP/TW stock performance |
|
500% |
450% |
400% |
350% |
300% |
250% |
200% |
150% |
100% |
Source: Deutsche Bank, Wind; Note Jan 2012 =100%
Major local IA stocks outperformed JP/TW companies in this round of pullback
Figure 3: Earnings revisions
Company |
Ticker |
Cur. |
|
New Forecast |
|
|
Old Forecast |
|
|
Consensus |
|
% chg new vs. old |
% chg DB vs. the street |
||||
|
|
|
FY 2018E |
FY 2019E |
FY 2020E |
FY 2018E |
FY 2019E |
FY 2020E |
FY 2018E |
FY 2019E |
FY 2020E |
FY 2018E |
FY 2019E |
FY 2020E |
FY 2018E |
FY 2019E |
FY 2020E |
SHENZHEN INOVANCE |
300124.SZ |
RMB M |
1,171 |
1,475 |
1,984 |
1,233 |
1,622 |
2,138 |
1,231 |
1,506 |
1,852 |
-5% |
-9% |
-7% |
-5% |
-2% |
7% |
ESTUN AUTOMATION |
002747.SZ |
RMB M |
120 |
210 |
331 |
139 |
246 |
384 |
126 |
196 |
276 |
-13% |
-14% |
-14% |
-5% |
7% |
20% |
|
|
|
|
|
|
|
|
|
|
|
|
|
|
|
|
|
|
Source: Deutsche Bank estimates, Bloomberg Finance LP
Figure 4: Summary of rating and TP changes
Company |
Ticker |
Cur. |
Rating |
New TP |
Old TP |
% chg |
Share price |
% upside |
P/B 18E |
P/B 19E |
Shenzhen Inovance |
300124.SZ |
RMB |
Buy |
32.0 |
34.0 |
-6% |
24.7 |
30% |
27.9 |
20.7 |
Estun Automation |
002747.SZ |
RMB |
Buy |
16.0 |
17.0 |
-6% |
9.5 |
68% |
66.2 |
37.9 |
Source: Deutsche Bank estimates, Bloomberg Finance LP
Page 2 |
Deutsche Bank AG/Hong Kong |
vk.com/id44642594313 November 2018
Manufacturing
China Industrial Automation
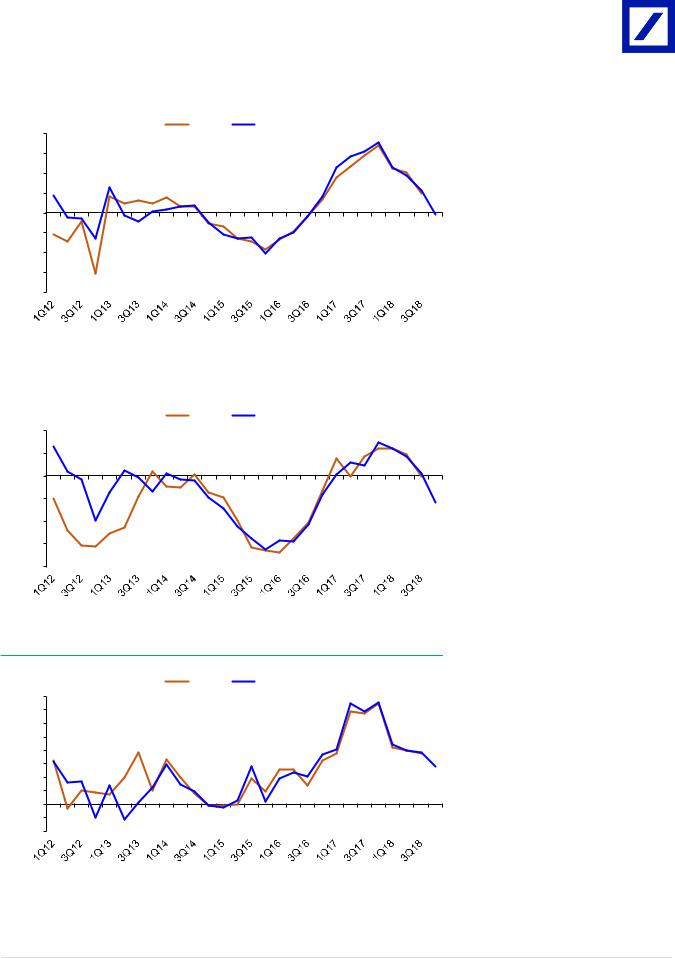
Figure 5: Deutsche Bank's IA forecast model I - overall
20% |
Actual |
Forecast |
|
|
|
15% |
R square = 98% |
|
10% |
Significance F < 0.01% |
|
|
|
|
5% |
|
|
0% |
|
|
-5% |
|
|
-10% |
|
|
-15% |
|
|
-20% |
|
|
Overall IA demand = -5% + 41% A + 76% B + 20% C + 7% D + 1.4 E + F
Variable A = M1 growth Variable B = PPI index
Variable C = total profit growth of industrial enterprises
Variable D = total equipments procurement and investment growth
Variable E = adjusted PMI index
Variable F = adjusted MNCs' confidence index
We forecast China's IA demand in 4Q to be -0.4% vs. +4% YoY previously
Source: Deutsche Bank estimates, Gongkong; Note R square shows the correlation between actual and forecasted demand growth, the closer to 100%, the higher correlation; Significance F shows the significance of our model. Generally, < 5% is acceptable, the lower, the better
|
|
|
MNCs' IA demand = -15% + 26% A + 17% |
Figure 6: Deutsche Bank's IA forecast model II - MNCs |
B + 21% C + 35% D + 1.3 E |
||
|
Acutal |
Forecast |
Variable A = M1 growth |
|
Variable B = industrial power consumption |
||
10% |
|
|
|
R square = 94% |
|
growth |
|
|
|
||
|
|
Variable C = total profit growth of industrial |
|
5% |
Significance F < 0.01% |
|
|
|
enterprises |
||
|
|
|
|
0% |
|
|
Variable D = total industrial fixed asset |
|
|
|
investment |
-5% |
|
|
Variable E = adjusted MNCs confidence |
-10% |
|
|
index |
|
|
|
|
-15% |
|
|
We forecast MNCs' IA demand in 4Q to be |
|
|
-5.8% vs. -1.2% YoY previously |
|
|
|
|
|
-20% |
|
|
|
Source: Deutsche Bank estimates, Gongkong
|
|
|
Local IA demand = -38% + 2.2 A + 2.8 B + |
|
Figure 7: Deutsche Bank's IA forecast model III - local |
37% C + 26% D + 59% E - 2.0 F + G |
|||
|
Actual |
Forecast |
Variable A = M1 growth |
|
|
Variable B = power consumption growth of |
|||
40% |
|
|
||
R square = 96% |
|
light industry |
||
35% |
|
|||
|
Variable C = total profit growth of industrial |
|||
Significance F < 0.01% |
||||
30% |
||||
|
|
enterprises |
||
25% |
|
|
Variable D = total industrial fixed asset |
|
20% |
|
|
||
|
|
investment growth |
||
15% |
|
|
Variable E = adjusted manufacturing |
|
10% |
|
|
company confidence |
|
5% |
|
|
Variable F = MNCs' IA demand growth |
|
0% |
|
|
Variable G = adjusted MNCs' confidence |
|
-5% |
|
|
index |
|
-10% |
|
|
|
|
We forecast local IA demand in 4Q to be +14% vs. +17% YoY previously
Source: Deutsche Bank estimates, Gongkong
Deutsche Bank AG/Hong Kong |
Page 3 |
vk.com/id446425943
13 November 2018 Manufacturing
China Industrial Automation
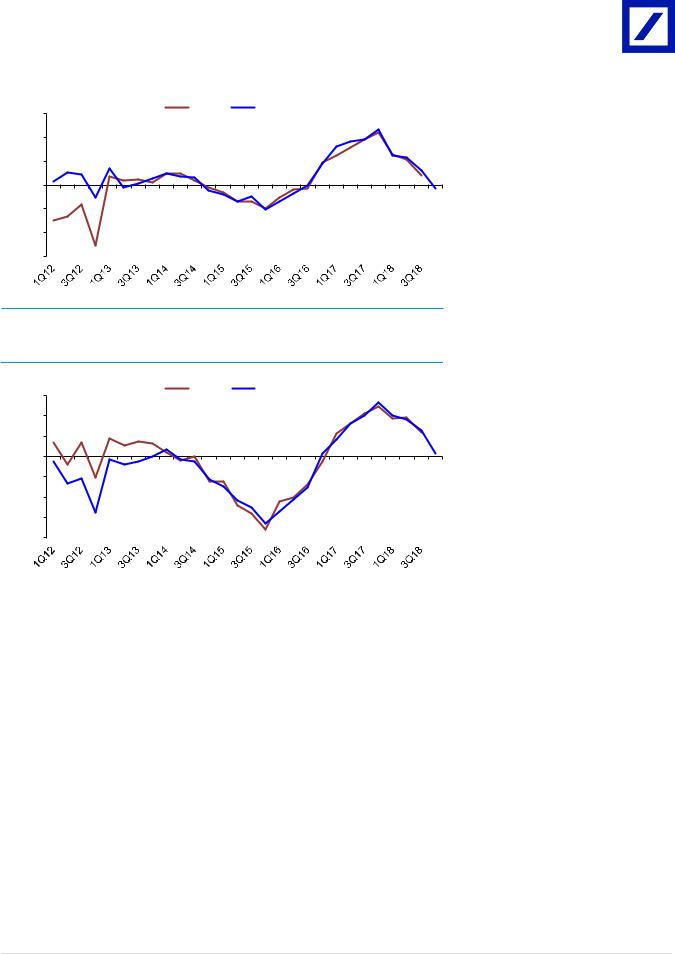
Figure 8: Deutsche Bank's IA forecast model IV - OEM
30% |
Actual |
Forecast |
|
|
|
||
20% |
R square = 98% |
|
|
Significance F < 0.01% |
|||
|
|||
10% |
|
|
|
0% |
|
|
|
-10% |
|
|
|
-20% |
|
|
|
-30% |
|
|
|
OEM IA demand = -14% + 97% A + 90% B + 17% C + 13% D +E
Variable A = M1 growth
Variable B = power consumption growth of light industry
Variable C = total profit growth of industrial enterprises
Variable D = total equipment procurement and investment growth
Variable E = adjusted MNCs' confidence index
We forecast OEM market's IA demand in 4Q to be -1.4% YoY
Source: Deutsche Bank estimates, Gongkong
Figure 9: Deutsche Bank's IA forecast model V - project
15% |
Actual |
Forecast |
|
|
|
10% |
R square = 98% |
|
Significance F < 0.01% |
|
|
|
|
|
5% |
|
|
0% |
|
|
-5% |
|
|
-10% |
|
|
-15% |
|
|
-20% |
|
|
Source: Deutsche Bank estimates, Gongkong
Project IA demand = -8% + 19% A + 18% B + 31%C + 2% D
Variable A = M1 growth
Variable B = total revenue growth of industrial enterprises
Variable C = power consumption growth of heavy industry
Variable D = adjusted MNCs confidence index
We forecast project market's IA demand in 4Q to be +0.8% YoY
Page 4 |
Deutsche Bank AG/Hong Kong |
vk.com/id44642594313 November 2018
Manufacturing
China Industrial Automation
Stock picks
Hollysys Automation (HOLI.OQ), Buy, target price US$29)
Investment thesis
Hollysys Automation (HOLI) is one of China's leading providers of industrial automation and rail automation solutions. Despite the near-term slowdown in China's overall automation market, Hollysys's exposure mainly to the project market should ensure more resilient growth than its overseas peers. With surging railway length completion and manufacturing further gaining momentum, we think Hollysys will maintain a multi-year robust recovery trajectory (16% EPS CAGR over FY18-20E). This should drive a further re-rating in the shares, in our view. We rate the stock Buy, based on the attractive risk-reward profile.
Valuation
We use DCF to value HOLI, given its stable cash flow. Our TP is based on a WACC of 12.3% and conservatively assumes terminal growth of 0% (given its exposure to the railway business). Our cost of equity assumption incorporates a risk-free rate of 3.9%, an equity risk premium of 5.6% and a beta of 1.5x. Our target price corresponds to a non-GAAP-based P/E of 14x/12x and a P/B of 1.8x/1.6x on FY19E/FY20E. In the previous earnings upcycle (FY14-16), during which earnings accelerated significantly on rail recovery, the stock traded at 12x on average and its P/E multiple expanded to 14-16x at the later stage.
Risk
Key downside risks include: 1) an unexpected slowdown in China's economic growth and capex spending on automation upgrades; 2) an unexpected slowdown in China's railway investment and demand for high-speed rail trains; and 3) poor execution of investments.
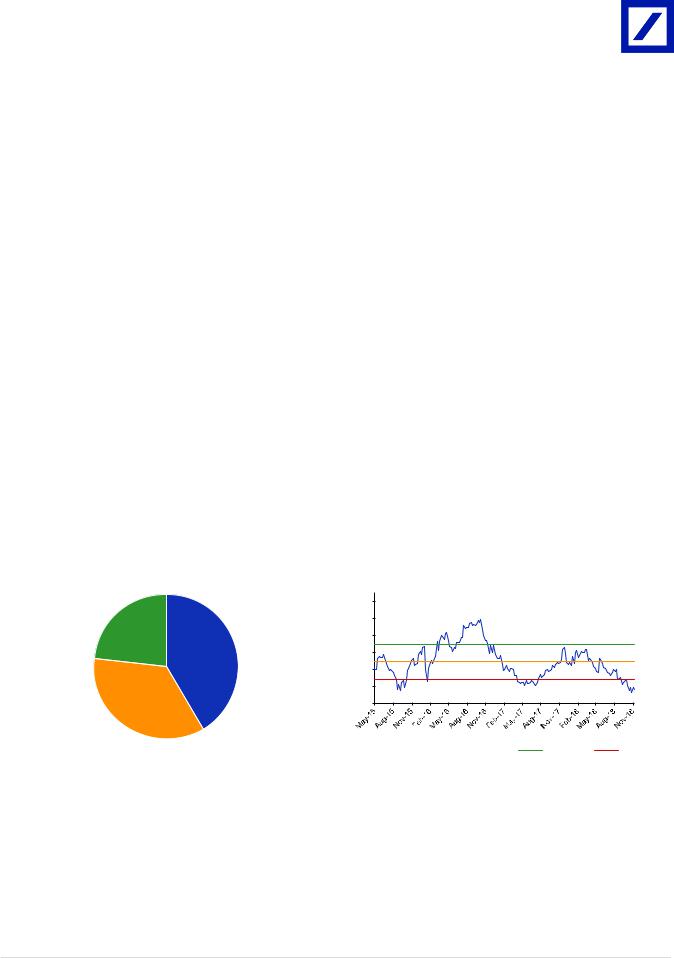
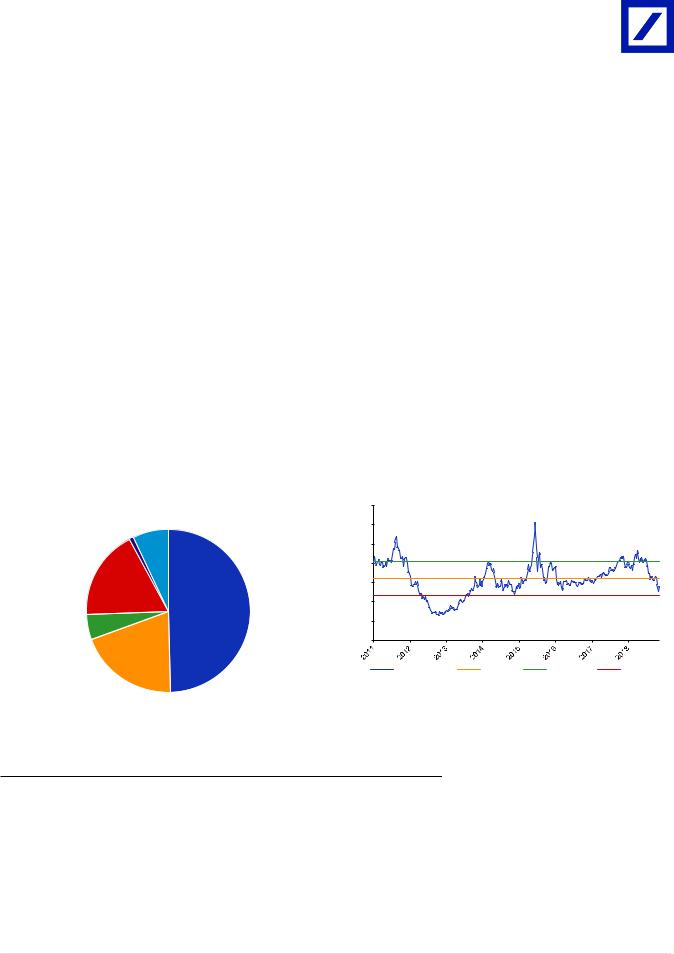
Figure 10: HOLI - revenue breakdown (FY18) |
|
Figure 11: HOLI - one-year forward P/E chart |
M&E (Concord
and Bond)
23% Industrial
Automation
42%
Rail transportation 35%
|
19.0 |
|
|
17.0 |
|
) |
15.0 |
13.9X |
(X |
|
|
P/E |
13.0 |
11.9X |
|
||
|
|
|
|
11.0 |
9.8X |
|
9.0 |
|
|
7.0 |
|
|
|
|
|
|
1yr fwd P/E (x) |
|
Avg P/E |
+1 STDEV |
-1 STDEV |
|
|
|
|
|
|
||||
Source: Company data, Deutsche Bank |
|
Source: Company data, Bloomberg Finance LP, Deutsche Bank |
|
|
|||||
|
|
|
|||||||
|
|
|
|
|
|
|
|
|
|
Shenzhen Inovance (300124.SZ, Buy, target price RMB32)
Investment thesis
As a leading Chinese industrial automation provider, Shenzhen Inovance currently provides the best investment exposure to China's manufacturing upgrades and robotics themes, in our view. Leveraging its advanced technology know-how and market insights, Inovance is likely to lead the ongoing import substitution in China's IA market, which should support a 23% earnings CAGR in 2017-20E. Specifically, after multi-year positioning via internal R&D and acquisitions,
Deutsche Bank AG/Hong Kong |
Page 5 |
vk.com/id446425943
13 November 2018 Manufacturing
China Industrial Automation
Inovance has developed the widest range of products in the IA field of all the domestic players, which should allow it to capture the major change in customers' buying behaviour, from product adopters to solution seekers. In the medium term, we expect its passenger NEV drive business to emerge as a significant growth driver, which, along with continued strength in the IA segment, should enable the company to sustain its high growth. In the long term, we remain optimistic about Inovance's expansion into industrial robots. Hence, we rate the shares Buy.
Valuation
We use DCF to value Inovance, given its stable cash flow. We lower our earnings forecast for 2018-20E by an average of 7% factoring in the slowing IA demand. Our target price is based on a WACC of 8.0% and a terminal growth assumption of 2%. Our cost of equity assumption incorporates a risk-free rate of 3.9%, an equity risk premium of 5.6% and a beta of 0.95x. Our target price corresponds to a P/E of 46x/36x on 2018/19E, close to one standard deviation above its long-term mid-cycle level, supported by the long-term growth potential of China's intelligent manufacturing sector, as well as an improving outlook for its passenger NEV drive business.
Risk
Key downside risks include: 1) an unexpected slowdown in China's economic activity; 2) slower-than-expected new energy vehicle sales in China; 3) slower- than-expected development of new products and market penetration; and 4) poor execution of M&A.
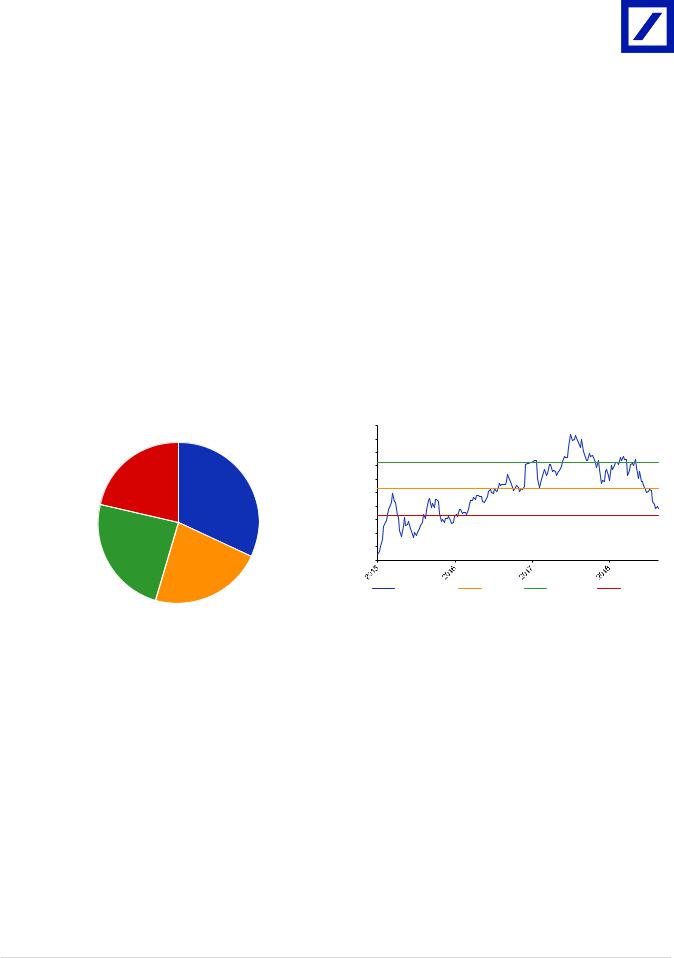
Figure 12: Inovance – revenue breakdown by segment |
|
Figure 13: Inovance – one-year forward P/E chart |
(2017A) |
|
|
|
|
|
Sensor |
Others |
|
7% |
||
1% |
||
|
||
New Energy |
|
|
Products |
|
|
18% |
|
Inverter
49%
Controller
5%
Motion control 20%
|
70.0 |
|
|
|
|
60.0 |
|
|
|
|
50.0 |
|
|
|
|
|
|
|
41.3X |
) |
40.0 |
|
|
|
(X |
|
|
|
|
|
|
|
|
|
P/E |
30.0 |
|
|
32.3X |
|
|
|
||
|
20.0 |
|
|
23.4X |
|
10.0 |
|
|
|
|
0.0 |
|
|
|
|
1yr fwd P/E (x) |
Avg P/E |
+1 STDEV |
-1 STDEV |
Source: Company data, Deutsche Bank |
Source: Company data, Bloomberg Finance LP, Deutsche Bank |
|
|
|
|
Estun Automation (002747.SZ, Buy, target price RMB16)
Investment thesis
The evolution of Estun's business portfolio, centered around motion control technology, closely resembles the development history of Fanuc, which has been a proven path to success in the IA field. With three elements for success — right time, right place and right people — all aligned, Estun, in our view, is well positioned to lead the ongoing import substitution in two of the fastest-growing product categories within China's IA market, namely servo and industrial robots.
Page 6 |
Deutsche Bank AG/Hong Kong |
vk.com/id44642594313 November 2018
Manufacturing
China Industrial Automation
With a projected EPS CAGR of 53% for 2017-20E, the highest among our coverage universe of China industrial automation sector, we rate the shares Buy.
Valuation
In line with our methodology for other Chinese IA names, we use a DCF to value Estun, given its stable cash flow outlook. We cut our 2018-20E earnings by 14% on average, due to the cloudy outlook and higher operating expenses. Our target price is based on a WACC of 9.4% and a terminal growth assumption of 5% (given the long-term growth potential for China's industrial robot market). Our cost of equity assumption incorporates a risk-free rate of 3.9%, an equity risk premium of 5.6% and a beta of 1.3x. Our target price corresponds to a P/E of 40x on 2020E, supported by its robust growth prospects (53% CAGR projected for 2017-20E) and strong positioning in China's industrial robot and servo markets.
Risk
Key downside risks include: 1) an unexpected slowdown in China’s IA market; 2) slower-than-expected import substitution in China's industrial robot and servo markets; 3) an unexpected increase in raw material costs; 4) poor execution of M&A; and 5) key personnel departures.
Figure 14: Estun – revenue breakdown by segment |
|
Figure 15: Estun – one-year forward P/E chart |
(2017A) |
|
|
|
|
|
Intelligent manufacturing 21%
CNC system 32%
Industrial robot 24%
AC servo 23%
|
100.0 |
|
|
|
|
90.0 |
|
|
|
|
80.0 |
|
|
72.4X |
|
|
|
|
|
|
70.0 |
|
|
|
) |
60.0 |
|
|
|
(X |
50.0 |
|
|
|
P/E |
|
|
52.9X |
|
|
|
|
||
40.0 |
|
|
|
|
|
|
|
|
|
|
30.0 |
|
|
33.5X |
|
20.0 |
|
|
|
|
10.0 |
|
|
|
|
0.0 |
|
|
|
|
1yr fwd P/E (x) |
Avg P/E |
+1 STDEV |
-1 STDEV |
Source: Company data, Deutsche Bank |
Source: Company data, Bloomberg Finance LP, Deutsche Bank |
|
|
|
|
Deutsche Bank AG/Hong Kong |
Page 7 |

vk.com/id446425943
Page |
|
Figure 16: Global industrial automation sector – valuation comp sheet |
|
|
|
|
|
|
|
|
|
|
|
|
|||||||
|
|
|
|
|
|
|
|
|
|
|
|
|
|
||||||||
8 |
|
|
|
|
|
|
|
|
|
|
|
|
|
|
|
|
|
|
|||
|
|
|
|
|
|
|
3-mo |
|
|
|
P/E(x) |
P/B(x) |
|
ROE(%) |
EV/EBITDA(x) |
Div.yield(%) |
|
||||
|
|
|
|
|
|
|
|
|
|
|
|
|
|
|
|
|
|
|
|
||
|
|
|
|
|
|
|
Upside/dow |
Market cap |
EPS CAGR |
|
|
|
|
|
|
|
|
|
|
|
|
|
|
Stock name |
Reuters ticker |
DB rating |
Share price |
Target price |
turnover |
|
|
|
|
|
|
|
|
|
|
|
|||
|
|
|
|
|
|
|
|
|
|
|
|
|
|||||||||
|
|
|
|
|
|
|
nside (%) |
(US$mn) |
(US$ mn) |
% (17-19) |
|
|
|
|
|
|
|
|
|
|
|
|
|
|
|
|
|
|
|
|
|
2018E |
2019E |
2018E |
2019E |
2018E |
2019E |
2018E |
2019E |
2018E |
2019E |
|
|
|
|
|
|
|
|
|
|
|
|
|
|
||||||||||
|
|
|
|
|
|
|
|
|
|
|
|
|
|
|
|
|
|
|
|
|
|
|
|
Asia |
|
|
|
|
|
|
|
|
|
|
|
|
|
|
|
|
|
|
|
|
|
|
|
|
|
|
|
|
|
|
|
|
|
|
|
|
|
|
|
|
|
|
|
HK/China |
|
|
|
|
|
|
|
|
|
|
|
|
|
|
|
|
|
|
|
|
|
Shenzhen Inovance |
300124.SZ |
Buy |
CNY24.3 |
CNY32 |
32% |
27 |
5,921 |
23.2 |
34.5 |
27.4 |
6.6 |
5.7 |
20.3 |
22.3 |
38.7 |
31.0 |
1.16 |
1.46 |
|
|
|
Focused Photonics |
300203.SZ |
Buy |
CNY25.3 |
CNY42 |
66% |
11 |
1,650 |
36.6 |
18.2 |
13.6 |
3.1 |
2.6 |
18.5 |
20.8 |
13.8 |
10.7 |
0.83 |
1.11 |
|
|
|
Hollysys Automation |
HOLI.OQ |
Buy |
USD19.2 |
USD29 |
51% |
6 |
1,142 |
35.2 |
10.8 |
9.1 |
1.4 |
1.2 |
13.7 |
13.6 |
6.7 |
6.2 |
0.94 |
1.07 |
|
|
|
Shenzhen INVT |
002334.SZ |
NC |
CNY4.7 |
n.a. |
n.a. |
4 |
530 |
16.8 |
13.6 |
11.6 |
1.8 |
1.6 |
13.3 |
13.3 |
15.4 |
12.6 |
1.86 |
1.75 |
|
|
|
Shanghai STEP Electric |
002527.SZ |
NC |
CNY5.7 |
n.a. |
n.a. |
1 |
520 |
4.4 |
27.6 |
23.7 |
1.2 |
1.1 |
4.0 |
4.7 |
19.6 |
17.7 |
1.05 |
1.20 |
|
|
|
Estun Automation |
002747.SZ |
Buy |
CNY9.3 |
CNY16 |
72% |
9 |
1,154 |
52.5 |
66.2 |
37.9 |
5.0 |
4.6 |
7.7 |
12.6 |
54.1 |
33.4 |
0.90 |
1.60 |
|
|
|
Siasun Robot |
300024.SZ |
NC |
CNY14.7 |
n.a. |
n.a. |
18 |
3,339 |
22.1 |
42.9 |
35.6 |
3.6 |
3.3 |
8.6 |
9.5 |
39.3 |
32.7 |
0.41 |
0.48 |
|
|
|
|
|
|
|
|
|
|
|
|
|
|
|
|
|
|
|
|
|
|
|
|
|
HK/China Average |
|
|
|
|
|
|
|
27.3 |
30.5 |
22.7 |
3.2 |
2.9 |
12.3 |
13.8 |
26.8 |
20.6 |
1.0 |
1.2 |
|
|
|
Taiwan |
|
|
|
|
|
|
|
|
|
|
|
|
|
|
|
|
|
|
|
|
|
Hiwin |
2049.TW |
Buy |
TWD220 |
TWD285 |
30% |
55 |
2,127 |
38.3 |
11.1 |
11.8 |
3.1 |
2.7 |
31.9 |
24.8 |
8.6 |
8.8 |
2.89 |
2.72 |
|
|
|
Delta |
2308.TW |
Buy |
TWD128.5 |
TWD136 |
6% |
39 |
10,853 |
3.5 |
18.6 |
16.9 |
2.6 |
2.5 |
14.6 |
15.1 |
11.2 |
10.1 |
4.04 |
4.43 |
|
|
|
Airtac |
1590.TW |
Hold |
TWD287 |
TWD248 |
-14% |
19 |
1,769 |
(2.8) |
18.8 |
17.4 |
2.9 |
2.7 |
16.8 |
16.0 |
12.7 |
12.0 |
2.93 |
3.16 |
|
|
|
|
|
|
|
|
|
|
|
|
|
|
|
|
|
|
|
|
|
|
|
|
|
Taiwan Average |
|
|
|
|
|
|
|
13.0 |
16.1 |
15.4 |
2.9 |
2.6 |
21.1 |
18.7 |
10.8 |
10.3 |
3.3 |
3.4 |
|
|
|
Japan |
|
|
|
|
|
|
|
|
|
|
|
|
|
|
|
|
|
|
|
|
|
Yaskawa Electric |
6506.T |
Hold |
JPY3345 |
JPY4000 |
20% |
117 |
7,816 |
20.8 |
16.8 |
15.4 |
3.4 |
3.0 |
21.2 |
20.9 |
11.0 |
9.6 |
1.79 |
2.09 |
|
|
|
Fanuc |
6954.T |
Hold |
JPY20085 |
JPY21000 |
5% |
236 |
34,431 |
(0.6) |
23.9 |
21.7 |
2.6 |
2.6 |
11.0 |
11.9 |
13.2 |
11.9 |
2.51 |
2.77 |
|
|
|
Keyence |
6861.T |
Buy |
JPY60840 |
JPY71000 |
17% |
221 |
63,864 |
12.9 |
30.8 |
27.5 |
4.6 |
4.0 |
16.1 |
15.6 |
18.6 |
16.6 |
0.25 |
0.29 |
|
|
|
Yokogawa |
6841.T |
NC |
JPY2284 |
n.a. |
n.a. |
23 |
5,266 |
13.2 |
19.1 |
17.4 |
2.0 |
1.8 |
10.6 |
10.9 |
8.9 |
8.4 |
1.64 |
1.82 |
|
|
|
SMC |
6273.T |
Buy |
JPY36930 |
JPY40000 |
8% |
105 |
21,719 |
11.5 |
15.7 |
14.6 |
2.0 |
1.8 |
13.1 |
12.7 |
8.6 |
8.0 |
1.35 |
1.49 |
|
|
|
|
|
|
|
|
|
|
|
|
|
|
|
|
|
|
|
|
|
|
|
|
|
Japan Average |
|
|
|
|
|
|
|
11.6 |
21.3 |
19.3 |
2.9 |
2.6 |
14.4 |
14.4 |
12.1 |
10.9 |
1.5 |
1.7 |
|
|
|
Asia average |
|
|
|
|
|
|
|
19.2 |
24.6 |
20.1 |
3.1 |
2.7 |
14.7 |
15.0 |
18.7 |
15.3 |
1.6 |
1.8 |
|
|
|
|
|
|
|
|
|
|
|
|
|
|
|
|
|
|
|
|
|
|
|
|
|
U.S./Europe |
|
|
|
|
|
|
|
|
|
|
|
|
|
|
|
|
|
|
|
|
|
|
|
|
|
|
|
|
|
|
|
|
|
|
|
|
|
|
|
|
|
|
|
Rockwell |
ROK.N |
NC |
USD169.3 |
n.a. |
n.a. |
191 |
20,030 |
24.1 |
18.7 |
17.1 |
14.5 |
14.0 |
65.7 |
74.5 |
12.9 |
12.2 |
2.24 |
2.36 |
|
|
|
Emerson |
EMR.N |
Buy |
USD68.5 |
USD79 |
15% |
226 |
42,113 |
20.0 |
20.2 |
18.7 |
4.8 |
4.7 |
24.9 |
25.3 |
12.8 |
11.2 |
2.82 |
2.86 |
|
|
|
Honeywell |
HON.N |
Buy |
USD150.3 |
USD169 |
12% |
465 |
109,659 |
(3.3) |
18.9 |
19.9 |
6.1 |
5.9 |
36.1 |
30.1 |
12.8 |
13.3 |
2.03 |
2.24 |
|
|
|
ABB |
ABBN.S |
Buy |
CHF20.3 |
CHF25 |
23% |
125 |
42,704 |
16.4 |
14.6 |
13.3 |
2.8 |
2.6 |
16.4 |
18.3 |
10.1 |
8.7 |
4.17 |
4.42 |
|
|
|
Schneider |
SCHN.PA |
Buy |
EUR63.9 |
EUR82 |
28% |
132 |
40,883 |
11.9 |
14.2 |
12.5 |
1.7 |
1.6 |
11.7 |
12.9 |
10.3 |
9.3 |
3.72 |
4.02 |
|
KongAG/HongBankDeutsche |
|
|
|
|
|
|
|
|
|
|
|
|
|
|
|
|
|
|
|
|
|
|
U.S./Europe average |
|
|
|
|
|
|
|
13.8 |
17.3 |
16.3 |
6.0 |
5.8 |
30.9 |
32.2 |
11.8 |
10.9 |
3.0 |
3.2 |
|
|
|
|
Source: Company data, Bloomberg Finance LP, Deutsche Bank estimates. Note: All prices are as of 12/11/2018. For Japanese players, numbers for the next fiscal year are taken as fiscal years ending in March |
|
|
|
|
|
|
|||||||||||||
|
|
|
|
|
|
|
|
||||||||||||||
|
|
|
|
|
|
|
|
|
|
|
|
|
|
|
|
|
|
|
|
|
|
|
|
|
|
|
|
|
|
|
|
|
|
|
|
|
|
|
|
|
|
|
|
2018 November 13 Manufacturing Automation Industrial China
vk.com/id44642594313 November 2018
Manufacturing
China Industrial Automation
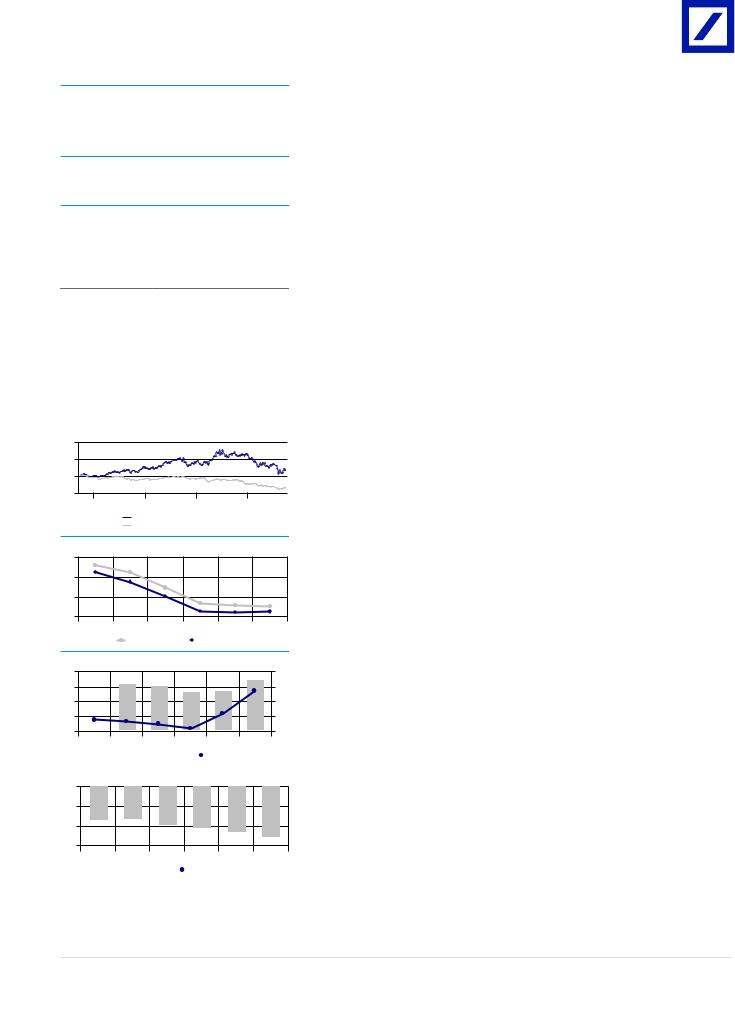
Model updated: 13 November 2018
Running the numbers
Asia
China
Manufacturing
Shenzhen Inovance Technolog
Reuters: 300124.SZ Bloomberg: 300124 CH
Buy
Price (12 Nov 18) |
CNY 24.27 |
Target Price |
CNY 32.00 |
52 Week range |
CNY 21.08 - 35.72 |
Market cap (m) |
CNYm 40,412 |
|
USDm 5,802.0 |
Company Profile
Founded in 2003, Shenzhen Inovance mainly focuses on R&D, manufacture and sales of industrial automation products. The company's product portfolio includes low-voltage inverters, servo systems, PLCs, HMIs, specialized control & drive system for elevators, new energy vehicle controllers and traction & control system for rail.
Price Performance
40 |
|
|
|
30 |
|
|
|
20 |
|
|
|
10 |
|
|
|
Jan '17 |
Jul '17 |
Jan '18 |
Jul '18 |
Shenzhen Inovance Technolog
Shenzhen Index (Rebased)
Margin Trends
35 |
|
|
|
|
|
30 |
|
|
|
|
|
25 |
|
|
|
|
|
20 |
|
|
|
|
|
15 |
16 |
17 |
18E |
19E |
20E |
EBITDA Margin |
|
EBIT Margin |
|
Growth & Profitibility
40 |
|
|
|
|
28 |
30 |
|
|
|
|
26 |
20 |
|
|
|
|
24 |
10 |
|
|
|
|
22 |
0 |
|
|
|
|
20 |
15 |
16 |
17 |
18E |
19E |
20E |
|
Sales growth (LHS) |
|
ROE (RHS) |
|
|
||
|
|
|
|
Solvency |
|
|
|
|
|
0 |
|
|
|
|
|
-20 |
|
|
|
|
|
-40 |
|
|
|
|
|
-60 |
|
|
|
|
|
15 |
16 |
17 |
18E |
19E |
20E |
|
|
Net debt/equity (LHS) |
|
|
Net interest cover (RHS) |
|
|
|
|
||
Sky Hong, CFA |
|
|
|
||
+852 2203 6131 |
sky.hong@db.com |
||||
Fiscal year end 31-Dec |
2015 |
2016 |
2017 |
2018E |
2019E |
2020E |
|
|
|
|
|
|
|
Financial Summary |
|
|
|
|
|
|
DB EPS (CNY) |
0.51 |
0.58 |
0.64 |
0.70 |
0.89 |
1.19 |
Reported EPS (CNY) |
0.51 |
0.58 |
0.64 |
0.70 |
0.89 |
1.19 |
DPS (CNY) |
0.50 |
0.28 |
0.30 |
0.28 |
0.35 |
0.48 |
BVPS (CNY) |
5.1 |
2.9 |
3.3 |
3.7 |
4.3 |
5.1 |
Weighted average shares (m) |
1,578 |
1,579 |
1,665 |
1,665 |
1,665 |
1,665 |
Average market cap (CNYm) |
34,216 |
29,913 |
41,436 |
40,412 |
40,412 |
40,412 |
Enterprise value (CNYm) |
33,051 |
28,382 |
39,242 |
37,841 |
37,119 |
36,021 |
|
|
|
|
|
|
|
Valuation Metrics |
|
|
|
|
|
|
P/E (DB) (x) |
42.3 |
32.7 |
39.1 |
34.5 |
27.4 |
20.4 |
P/E (Reported) (x) |
42.3 |
32.7 |
39.1 |
34.5 |
27.4 |
20.4 |
P/BV (x) |
4.56 |
6.94 |
8.91 |
6.63 |
5.69 |
4.75 |
FCF Yield (%) |
1.7 |
0.9 |
0.8 |
2.1 |
2.8 |
4.1 |
Dividend Yield (%) |
2.3 |
1.5 |
1.2 |
1.2 |
1.5 |
2.0 |
EV/Sales (x) |
11.9 |
7.8 |
8.2 |
6.2 |
4.8 |
3.5 |
EV/EBITDA (x) |
36.2 |
24.9 |
30.2 |
26.9 |
21.2 |
15.4 |
EV/EBIT (x) |
38.4 |
27.1 |
32.9 |
29.5 |
23.0 |
16.5 |
|
|
|
|
|
|
|
Income Statement (CNYm) |
|
|
|
|
|
|
Sales revenue |
2,771 |
3,660 |
4,777 |
6,060 |
7,718 |
10,384 |
Gross profit |
1,343 |
1,761 |
2,155 |
2,659 |
3,364 |
4,431 |
EBITDA |
912 |
1,141 |
1,300 |
1,405 |
1,752 |
2,337 |
Depreciation |
32 |
59 |
70 |
79 |
91 |
104 |
Amortisation |
19 |
32 |
36 |
41 |
44 |
47 |
EBIT |
862 |
1,049 |
1,194 |
1,284 |
1,617 |
2,187 |
Net interest income(expense) |
45 |
11 |
31 |
47 |
69 |
91 |
Associates/affiliates |
-1 |
-14 |
-18 |
0 |
0 |
0 |
Exceptionals/extraordinaries |
0 |
0 |
0 |
0 |
0 |
0 |
Other pre-tax income/(expense) |
0 |
-2 |
-5 |
-5 |
-5 |
-5 |
Profit before tax |
905 |
1,044 |
1,202 |
1,327 |
1,681 |
2,273 |
Income tax expense |
71 |
63 |
111 |
119 |
160 |
227 |
Minorities |
25 |
48 |
31 |
36 |
46 |
61 |
Other post-tax income/(expense) |
0 |
0 |
0 |
0 |
0 |
0 |
Net profit |
809 |
932 |
1,060 |
1,171 |
1,475 |
1,984 |
DB adjustments (including dilution) |
0 |
0 |
0 |
0 |
0 |
0 |
DB Net profit |
809 |
932 |
1,060 |
1,171 |
1,475 |
1,984 |
|
|
|
|
|
|
|
Cash Flow (CNYm) |
|
|
|
|
|
|
Cash flow from operations |
802 |
420 |
492 |
1,045 |
1,354 |
1,854 |
Net Capex |
-207 |
-136 |
-160 |
-199 |
-207 |
-215 |
Free cash flow |
594 |
284 |
332 |
846 |
1,148 |
1,639 |
Equity raised/(bought back) |
190 |
584 |
124 |
0 |
0 |
0 |
Dividends paid |
-411 |
-415 |
-500 |
-499 |
-468 |
-590 |
Net inc/(dec) in borrowings |
-5 |
91 |
91 |
-219 |
0 |
0 |
Other investing/financing cash flows |
-495 |
173 |
-690 |
67 |
89 |
111 |
Net cash flow |
-127 |
717 |
-643 |
195 |
768 |
1,160 |
Change in working capital |
-30 |
-631 |
-659 |
-216 |
-213 |
-231 |
|
|
|
|
|
|
|
Balance Sheet (CNYm) |
|
|
|
|
|
|
Cash and other liquid assets |
1,408 |
1,708 |
2,411 |
2,606 |
3,374 |
4,534 |
Tangible fixed assets |
595 |
646 |
789 |
864 |
934 |
1,000 |
Goodwill/intangible assets |
459 |
599 |
611 |
619 |
624 |
624 |
Associates/investments |
3 |
218 |
301 |
301 |
301 |
301 |
Other assets |
3,483 |
4,803 |
4,935 |
6,016 |
7,299 |
9,329 |
Total assets |
5,947 |
7,974 |
9,047 |
10,406 |
12,531 |
15,787 |
Interest bearing debt |
15 |
128 |
219 |
0 |
0 |
0 |
Other liabilities |
1,642 |
2,863 |
3,103 |
3,972 |
5,045 |
6,846 |
Total liabilities |
1,657 |
2,992 |
3,322 |
3,972 |
5,045 |
6,846 |
Shareholders' equity |
4,060 |
4,716 |
5,426 |
6,098 |
7,105 |
8,499 |
Minorities |
230 |
267 |
299 |
335 |
381 |
442 |
Total shareholders' equity |
4,290 |
4,982 |
5,725 |
6,434 |
7,486 |
8,941 |
Net debt |
-1,393 |
-1,580 |
-2,192 |
-2,606 |
-3,374 |
-4,534 |
|
|
|
|
|
|
|
Key Company Metrics |
|
|
|
|
|
|
Sales growth (%) |
nm |
32.1 |
30.5 |
26.9 |
27.4 |
34.5 |
DB EPS growth (%) |
na |
13.1 |
9.8 |
10.5 |
26.0 |
34.5 |
EBITDA Margin (%) |
32.9 |
31.2 |
27.2 |
23.2 |
22.7 |
22.5 |
EBIT Margin (%) |
31.1 |
28.7 |
25.0 |
21.2 |
20.9 |
21.1 |
Payout ratio (%) |
97.5 |
48.2 |
47.1 |
40.0 |
40.0 |
40.0 |
ROE (%) |
21.5 |
21.2 |
20.9 |
20.3 |
22.3 |
25.4 |
Capex/sales (%) |
7.5 |
3.7 |
3.5 |
3.3 |
2.7 |
2.1 |
Capex/depreciation (x) |
4.1 |
1.5 |
1.6 |
1.7 |
1.5 |
1.4 |
Net debt/equity (%) |
-32.5 |
-31.7 |
-38.3 |
-40.5 |
-45.1 |
-50.7 |
Net interest cover (x) |
nm |
nm |
nm |
nm |
nm |
nm |
Source: Company data, Deutsche Bank estimates
Deutsche Bank AG/Hong Kong |
Page 9 |

vk.com/id446425943
13 November 2018 Manufacturing
China Industrial Automation
Model updated: 13 November 2018
Running the numbers
Asia
China
Manufacturing
Estun Automation
Reuters: 002747.SZ Bloomberg: 002747 CH
Buy
Price (12 Nov 18) |
CNY 9.28 |
Target Price |
CNY 16.00 |
52 Week range |
CNY 8.69 - 16.35 |
Market cap (m) |
CNYm 7,758.9 |
|
USDm 1,114.0 |
Company Profile
Founded in 1993 and headquartered in Nanjing, Estun Automation Co. Ltd (002747.SZ) specializes in CNC systems, AC servos, industrial robots and intelligent manufacturing. The company has not only become one of the leading domestic enterprises in manufacturing core controlling parts for highend intelligent equipment, but has also transformed itself into a major enterprise engaged in the domestic robot industry in
Price Performance
20 |
|
|
|
17.5 |
|
|
|
15 |
|
|
|
12.5 |
|
|
|
10 |
|
|
|
7.5 |
|
|
|
Jan '17 |
Jul '17 |
Jan '18 |
Jul '18 |
Estun Automation |
HANG SENG INDEX (Rebased) |
||
Margin Trends
16 |
|
|
|
|
|
14 |
|
|
|
|
|
12 |
|
|
|
|
|
10 |
|
|
|
|
|
8 |
|
|
|
|
|
15 |
16 |
17 |
18E |
19E |
20E |
EBITDA Margin |
|
EBIT Margin |
|
Growth & Profitibility
80 |
|
|
|
|
25 |
60 |
|
|
|
|
20 |
40 |
|
|
|
|
15 |
20 |
|
|
|
|
10 |
0 |
|
|
|
|
5 |
15 |
16 |
17 |
18E |
19E |
20E |
|
Sales growth (LHS) |
|
ROE (RHS) |
|
|
||
|
|
|
|
Solvency |
|
|
|
|
|
60 |
|
|
|
|
40 |
40 |
|
|
|
|
30 |
20 |
|
|
|
|
20 |
0 |
|
|
|
|
10 |
-20 |
|
|
|
|
0 |
15 |
16 |
17 |
18E |
19E |
20E |
|
|
Net debt/equity (LHS) |
|
|
Net interest cover (RHS) |
|
|
|
|
||
Sky Hong, CFA |
|
|
|
||
+852 2203 6131 |
sky.hong@db.com |
||||
Fiscal year end 31-Dec |
2015 |
2016 |
2017 |
2018E |
2019E |
2020E |
|
|
|
|
|
|
|
Financial Summary |
|
|
|
|
|
|
DB EPS (CNY) |
0.07 |
0.08 |
0.11 |
0.14 |
0.25 |
0.39 |
Reported EPS (CNY) |
0.07 |
0.08 |
0.11 |
0.14 |
0.25 |
0.39 |
DPS (CNY) |
0.40 |
0.20 |
0.07 |
0.09 |
0.15 |
0.24 |
BVPS (CNY) |
4.1 |
5.3 |
1.8 |
1.9 |
2.1 |
2.3 |
Weighted average shares (m) |
729 |
827 |
836 |
838 |
838 |
838 |
Average market cap (CNYm) |
7,451 |
8,373 |
9,951 |
7,759 |
7,759 |
7,759 |
Enterprise value (CNYm) |
7,426 |
8,203 |
10,198 |
8,212 |
8,356 |
8,491 |
|
|
|
|
|
|
|
Valuation Metrics |
|
|
|
|
|
|
P/E (DB) (x) |
145.6 |
122.1 |
106.9 |
64.6 |
37.0 |
23.5 |
P/E (Reported) (x) |
145.6 |
122.1 |
106.9 |
64.6 |
37.0 |
23.5 |
P/BV (x) |
2.85 |
2.05 |
6.05 |
4.87 |
4.48 |
4.01 |
FCF Yield (%) |
nm |
nm |
nm |
nm |
nm |
0.6 |
Dividend Yield (%) |
3.9 |
2.0 |
0.6 |
0.9 |
1.6 |
2.6 |
EV/Sales (x) |
15.4 |
12.1 |
9.5 |
4.8 |
3.4 |
2.5 |
EV/EBITDA (x) |
102.9 |
78.8 |
63.9 |
39.3 |
24.7 |
16.8 |
EV/EBIT (x) |
131.6 |
96.1 |
77.8 |
49.3 |
29.5 |
19.5 |
|
|
|
|
|
|
|
Income Statement (CNYm) |
|
|
|
|
|
|
Sales revenue |
483 |
678 |
1,077 |
1,699 |
2,457 |
3,453 |
Gross profit |
167 |
215 |
360 |
595 |
844 |
1,206 |
EBITDA |
72 |
104 |
160 |
209 |
338 |
506 |
Depreciation |
14 |
15 |
18 |
26 |
39 |
54 |
Amortisation |
2 |
4 |
10 |
16 |
16 |
17 |
EBIT |
56 |
85 |
131 |
167 |
283 |
435 |
Net interest income(expense) |
-2 |
-3 |
-7 |
-19 |
-25 |
-28 |
Associates/affiliates |
0 |
0 |
-1 |
0 |
0 |
0 |
Exceptionals/extraordinaries |
0 |
0 |
0 |
0 |
0 |
0 |
Other pre-tax income/(expense) |
-1 |
-2 |
-8 |
0 |
0 |
0 |
Profit before tax |
54 |
80 |
115 |
148 |
258 |
407 |
Income tax expense |
2 |
4 |
14 |
16 |
28 |
45 |
Minorities |
1 |
8 |
9 |
11 |
20 |
31 |
Other post-tax income/(expense) |
0 |
0 |
0 |
0 |
0 |
0 |
Net profit |
51 |
69 |
93 |
120 |
210 |
331 |
DB adjustments (including dilution) |
0 |
0 |
0 |
0 |
0 |
0 |
DB Net profit |
51 |
69 |
93 |
120 |
210 |
331 |
|
|
|
|
|
|
|
Cash Flow (CNYm) |
|
|
|
|
|
|
Cash flow from operations |
8 |
-65 |
-22 |
4 |
123 |
220 |
Net Capex |
-109 |
-115 |
-235 |
-120 |
-150 |
-170 |
Free cash flow |
-101 |
-181 |
-258 |
-116 |
-27 |
50 |
Equity raised/(bought back) |
223 |
941 |
71 |
0 |
0 |
0 |
Dividends paid |
-14 |
-54 |
-65 |
-60 |
-72 |
-126 |
Net inc/(dec) in borrowings |
-36 |
-4 |
607 |
366 |
160 |
112 |
Other investing/financing cash flows |
-57 |
-590 |
-144 |
-19 |
-25 |
-28 |
Net cash flow |
15 |
112 |
212 |
171 |
36 |
8 |
Change in working capital |
-65 |
-170 |
-152 |
-188 |
-187 |
-241 |
|
|
|
|
|
|
|
Balance Sheet (CNYm) |
|
|
|
|
|
|
Cash and other liquid assets |
33 |
147 |
370 |
541 |
577 |
585 |
Tangible fixed assets |
170 |
246 |
368 |
442 |
533 |
629 |
Goodwill/intangible assets |
104 |
202 |
794 |
799 |
803 |
806 |
Associates/investments |
32 |
74 |
149 |
149 |
149 |
149 |
Other assets |
404 |
1,211 |
1,548 |
2,131 |
2,846 |
3,746 |
Total assets |
743 |
1,881 |
3,229 |
4,061 |
4,908 |
5,914 |
Interest bearing debt |
39 |
35 |
674 |
1,040 |
1,200 |
1,312 |
Other liabilities |
204 |
376 |
926 |
1,321 |
1,850 |
2,508 |
Total liabilities |
243 |
411 |
1,600 |
2,361 |
3,050 |
3,820 |
Shareholders' equity |
498 |
1,453 |
1,537 |
1,597 |
1,735 |
1,940 |
Minorities |
2 |
17 |
92 |
103 |
123 |
154 |
Total shareholders' equity |
500 |
1,470 |
1,629 |
1,700 |
1,858 |
2,094 |
Net debt |
6 |
-112 |
304 |
499 |
623 |
727 |
|
|
|
|
|
|
|
Key Company Metrics |
|
|
|
|
|
|
Sales growth (%) |
nm |
40.4 |
58.7 |
57.8 |
44.7 |
40.5 |
DB EPS growth (%) |
na |
18.0 |
34.3 |
29.0 |
74.5 |
57.6 |
EBITDA Margin (%) |
14.9 |
15.4 |
14.8 |
12.3 |
13.8 |
14.7 |
EBIT Margin (%) |
11.7 |
12.6 |
12.2 |
9.8 |
11.5 |
12.6 |
Payout ratio (%) |
570.0 |
241.3 |
64.9 |
60.0 |
60.0 |
60.0 |
ROE (%) |
10.3 |
7.0 |
6.2 |
7.7 |
12.6 |
18.0 |
Capex/sales (%) |
22.6 |
17.2 |
21.9 |
7.1 |
6.1 |
4.9 |
Capex/depreciation (x) |
7.0 |
6.2 |
8.3 |
2.8 |
2.7 |
2.4 |
Net debt/equity (%) |
1.2 |
-7.7 |
18.7 |
29.3 |
33.5 |
34.7 |
Net interest cover (x) |
34.5 |
28.7 |
19.0 |
9.0 |
11.5 |
15.4 |
Source: Company data, Deutsche Bank estimates
Page 10 |
Deutsche Bank AG/Hong Kong |