

DB European Pharmaceuticals 2019 Outlook_watermark
.pdfvk.com/id446425943
Deutsche |
Summary model |
|
|
|
|
|
|
|
|
|
|
|
|
|
|
|
|
|
|
Figure 89 : Genmab summary P&L |
|
|
|
|
|
|
|
|
|
Bank |
DKKm ex-per share |
2016A |
2017A |
2018E |
2019E |
2020E |
2021E |
2022E |
2023E |
|
|||||||||
|
|
|
|
|
|
|
|
|
|
AG/London |
Revenues |
1,816 |
2,365 |
2,903 |
3,915 |
5,172 |
7,053 |
8,623 |
9,635 |
EBIT |
1,053 |
1,344 |
1,333 |
1,770 |
2,549 |
4,055 |
5,318 |
5,985 |
|
|
Growth |
60% |
30% |
23% |
35% |
32% |
36% |
22% |
12% |
|
Total operating expenses |
(763) |
(1,021) |
(1,570) |
(2,145) |
(2,623) |
(2,973) |
(3,241) |
(3,535) |
|
Margin |
58% |
57% |
46% |
45% |
49% |
57% |
62% |
62% |
|
Net financial income |
77 |
(280) |
250 |
202 |
247 |
323 |
411 |
513 |
|
Profit before tax |
1,130 |
1,064 |
1,583 |
1,972 |
2,796 |
4,378 |
5,729 |
6,498 |
|
Taxes |
57 |
40 |
(348) |
(434) |
(615) |
(963) |
(1,260) |
(1,430) |
|
Tax rate |
-5% |
-4% |
22% |
22% |
22% |
22% |
22% |
22% |
|
Net Income |
1,187 |
1,104 |
1,235 |
1,538 |
2,181 |
3,415 |
4,469 |
5,068 |
|
Wtd Average Shares |
59.9 |
60.8 |
61.3 |
61.7 |
62.0 |
62.3 |
62.6 |
62.9 |
|
Basic EPS |
19.8 |
18.1 |
20.2 |
24.9 |
35.2 |
54.8 |
71.4 |
80.6 |
|
Source: Deutsche Bank, Company data |
|
|
|
|
|
|
|
|
|
|
|
|
|
|
|
|
|
|
|
|
|
|
|
|
|
|
|
|
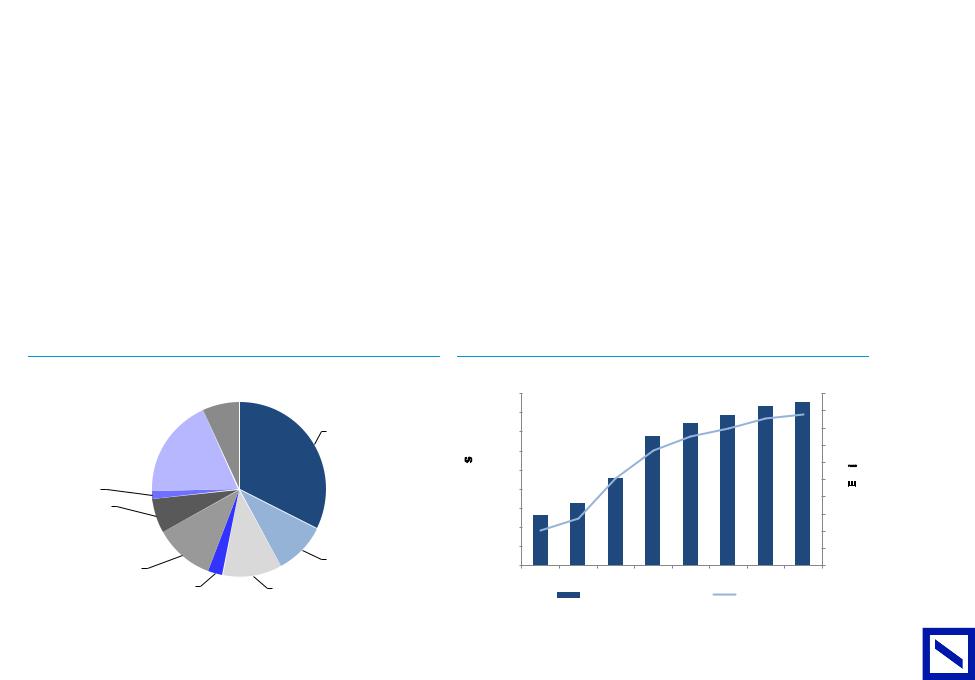
Figure 90 : 2019E divisional revenue split |
|
Figure 91 : Sales and EPS growth 2016A-2023E |
|
|
|
||||||
Reimbursement |
Arzerra royalty |
|
12,000 |
|
|
|
|
|
|
90 |
|
inc. |
|
|
|
|
|
|
|
|
|||
|
|
|
|
|
|
|
|
|
|
||
1% |
|
|
|
|
|
|
|
|
|
|
|
5% |
|
|
|
|
|
|
|
|
80 |
|
|
|
|
|
|
|
|
|
|
|
|
||
Milestone payments |
|
|
10,000 |
|
|
|
|
|
|
|
|
|
|
|
|
|
|
|
|
|
70 |
|
|
21% |
|
M |
|
|
|
|
|
|
|
|
(DKK)EPS |
|
|
DKKEUNEVE |
8,000 |
|
|
|
|
|
|
60 |
|
|
|
|
|
|
|
|
|
|
|
||
|
|
|
|
|
|
|
|
|
|
50 |
|
|
|
|
6,000 |
|
|
|
|
|
|
|
|
|
|
|
|
|
|
|
|
|
|
40 |
|
|
|
R |
|
|
|
|
|
|
|
|
|
|
|
|
4,000 |
|
|
|
|
|
|
30 |
|
|
|
|
|
|
|
|
|
|
|
20 |
|
|
|
|
2,000 |
|
|
|
|
|
|
|
|
|
|
|
|
|
|
|
|
|
|
10 |
|
|
Darzalex royalty |
|
- |
|
|
|
|
|
|
0 |
|
|
|
2016A |
2017A |
2018E |
2019E |
2020E |
2021E |
2022E |
2023E |
|
|
|
73% |
|
|
||||||||
|
|
|
|
|
|
|
|
|
|
|
|
|
|
|
|
REVENUE |
|
|
|
EPS |
|
|
|
Source: Deutsche Bank |
|
Source: Deutsche Bank, Company data |
|
|
|
|
|
|
|
||
51 Page
2018 December 10 Pharmaceuticals Pharmaceuticals European

vk.com/id446425943
Page |
Swedish Orphan Biovitrum (Upgrade to Buy; PT |
52 |
SEK245) |
|
Sobi is undergoing a strategic transformation
■We are upgrading Sobi to Buy as we believe the transformational nature of recent acquisitions is yet to be fully reflected in the shares. The acquisitions of Synagis and Gamifant build scale and critical mass to Sobi's US specialty business, diversify its profits from hemophilia and give it the P&L flexibility to reinvest in building its pipeline. We continue to believe its hemophilia franchise o ers durable growth potential in the medium term even with increased competition. In our view the shares 15x 2019 PER does not fairly reflect the company's solid near-term growth prospects ('18-22 EPS CAGR =14%) or the opportunity for management to leverage its strengthened platform through further business development.
■Continued Hemophilia franchise rollout and Gamifant should drive solid medium term growth. With Elocta market share still only in low double digits, we believe European sales of Sobi's long acting hemophilia franchise can easily still grow by >50% in the coming years. We remain optimistic that a potential launch of BIVV001 and use of Elocta in immune tolerance induction (ITI) could help Sobi defend these sales in the face of competition in the longer term. Importantly, the expected launch of Gamifant and the acquisition of Synagis rights means that ~45% of our 2024E profits are derived from durable franchises less exposed to competitive risks.
■Increasing PT to SEK245 (up from SEK200). We have increased our Core EPS forecasts by 1-5%, reflecting increases to our Gamifant forecasts. Given increased confidence in the sustainability of Sobi's growth prospects we now base our price target solely on our DCF with an increased terminal growth rate (2% vs 0%). This TGR is in-line with the assumption for the majority of our research coverage. Key risks include a weaker switch to longacting clotting factors, greater competition from new hemophilia therapies and disappointing sales of Gamifant.
|
Figure 92 : Bull/bear target price impact (SEK/share) |
|
|
Figure 93 : Sobi NPV valuation |
|
|
|
|
|
||||||||
|
|
|
|
|
|
|
|
|
Product |
Phase |
Launch |
Peak sales |
Probability |
NPV (SEKm) |
NPV (US$m) |
NPV/Share |
% of total |
|
320 |
|
|
|
|
|
|
|
|
|
|
(SEKm) |
|
|
|
(SEK) |
|
|
|
|
|
|
|
|
|
|
|
|
|
|
|
|
|
|
|
|
|
|
|
|
|
|
13 |
280 |
Kineret |
Approved |
Launched |
1,654.2 |
100% |
6,959.4 |
814.4 |
23.56 |
10% |
|
|
|
|
|
|
|
|
||||||||||
|
|
|
|
|
|
5 |
|
|
Other |
Approved |
Launched |
964.0 |
100% |
1,523.6 |
178.3 |
5.16 |
2% |
|
270 |
|
24 |
|
17 |
|
|
|
Orfadin |
Approved |
Launched |
905.1 |
100% |
1,886.3 |
220.7 |
6.39 |
3% |
|
|
|
245 |
|
|
|
|
Refacto |
Approved |
Launched |
656.2 |
100% |
819.1 |
95.9 |
2.77 |
1% |
|
|
|
|
|
|
|
|
|
||||||||||
|
|
|
|
|
|
|
|
|
Synagis franchise |
Approved |
Launched |
2,833.5 |
100% |
14,140.7 |
1,654.8 |
47.87 |
19% |
|
|
33 |
|
|
|
|
|
|
Gamifant |
Approved |
2019 |
2,750.0 |
100% |
9,609.9 |
1,124.6 |
32.54 |
13% |
|
220 |
|
|
|
|
|
|
|
Core business NPV |
|
|
|
|
34,939.0 |
4,088.8 |
118.3 |
48% |
|
|
|
|
|
|
|
|
|
|
|
|
|
|||||
|
188 |
|
|
|
|
|
|
|
Eloctate |
Approved |
Launched |
5,152.6 |
100% |
25,185.4 |
2,947.4 |
85.27 |
35% |
|
|
|
|
|
|
|
|
|
|
|
|
|
|
|
|
|
|
|
|
|
|
|
|
|
|
|
Alprolix |
Approved |
Launched |
1,516.5 |
100% |
10,106.6 |
1,182.7 |
34.22 |
14% |
|
170 |
|
|
|
|
|
|
|
Hemophilia NPV |
|
|
|
|
35,292.0 |
4,130.1 |
119.5 |
49% |
|
|
|
|
|
|
|
|
Technology/pipeline value |
|
|
|
9,838.3 |
1,151.3 |
33.3 |
14% |
||
Deutsche |
|
|
|
|
|
|
|
|
|
|
|
||||||
|
|
|
|
|
|
|
|
Net cash (debt) |
|
|
|
|
-7,543.9 |
-882.8 |
(25.54) |
-10% |
|
|
|
|
|
|
|
|
|
|
|
|
|
|
|||||
|
|
|
|
|
|
|
|
|
Total |
|
|
|
|
72,525.4 |
8,487.4 |
245.5 |
100% |
|
120 |
|
|
|
|
|
|
|
|
|
|
|
|
|
|
|
|
Bank |
70 |
|
|
|
|
|
|
|
|
|
|
|
|
|
|
|
|
Bear |
No pipeline |
Elocta |
Base |
Elocta better |
Better |
Better |
Bull |
|
|
|
|
|
|
|
|
|
|
AG/London |
|
|
erosion from |
|
LT outlook |
Synagis |
Gamifant |
|
|
|
|
|
|
|
|
|
|
|
|
2020 |
|
|
|
|
|
|
|
|
|
|
|
|
|
|
|
|
Source: Deutsche Bank, * - current share price |
|
|
|
|
|
Source: Deutsche Bank |
|
|
|
|
|
|
|
|
||
2018 December 10 Pharmaceuticals Pharmaceuticals European

vk.com/id446425943
Deutsche |
|
Support for change in recommendation |
||||
|
■ |
Launch of Gamifant in early 2019 diversifies Sobi's growth prospects. We expect Sobi to launch its new treatment for primary haemophagocytic |
||||
|
|
|||||
Bank |
|
|
lymphohistiocytosis (HLH) in early 2019. Sobi has yet to disclose its pricing strategy. Although the initial US sales opportunity in refractory cases |
|||
|
|
of primary HLH is in theory modest, expert feedback suggests positive experiences with the drug and suggests it is likely to ultimately become |
||||
AG/London |
|
|
established as treatment option for all primary and secondary HLH cases. It seems unlikely that reimbursement will be limiting to this uptake given lack |
|||
|
|
|
||||
|
|
|
of clear standard-of-care and poor outcomes with current treatment. We expect Sobi to instigate e orts to improve currently poor rates of diagnosis |
|||
|
|
|
and expand the drug's potential into other settings where interferon gamma has a key role in hyperinflammation. Our model assumes Sobi's target |
|||
|
|
|
of $300m in sales is achieved by 2024E contributing to 13% of NPV. |
|||
|
|
■ |
Limited impact from Hemlibra launch expected; meaningful growth potential remains. The potential for paradigm change in the treatment of |
|||
|
|
|
hemophilia remains a risk to consensus forecasts for Sobi's long acting Factor VIII franchise. The recent expanded approval of Hemlibra could begin |
|||
|
|
|
to have impact on US sales in 2019 (and impact Sobi royalties). However, expert feedback continues to suggest the transition to new therapies in |
|||
|
|
|
hemophilia will take time given caution over safety and the fact that the majority of patients are well controlled on current therapy (see notes here and |
|||
|
|
|
here ). We expect limited direct impact from Hemlibra launches in Sobi's core European markets before 2020 given need for further reimbursement |
|||
|
|
|
access negotiations following an expected expanded approval in 1H19. In addition, we estimate that Elocta currently has only a modest ~12% market |
|||
|
|
|
share leaving significant opportunity for growth even with new competition. We remain optimistic that recent impressive data from a Phase I/II trial |
|||
|
|
|
of BIVV001 and first data from trials of Elocta in immune tolerance induction (ReITIrate due 4Q19) will help improve confidence that Sobi defend/ |
|||
|
|
|
grow its hemophilia sales in the face of competition in the longer term. |
|||
|
|
■ |
Further business development seems likely. Since joining Sobi in early 2017, CEO Guido Oelkers has made it a priority to build critical mass in the |
|||
|
|
|
Company's US specialty business and ultimately strengthen the company's pipeline. We believe execution on these plans has been impressive to date |
|||
|
|
|
with the in-licensing of Gamifant and acquisition of Synagis giving scale to the US business and reducing the company's reliance on its hemophilia |
|||
|
|
|
portfolio. We suspect that this is not likely to be the end of management's business development plans. Further deals could seek to leverage this |
|||
|
|
|
strong foundation to drive shareholder value by expanding the company's pipeline. |
|||
|
|
|
|
|
||
|
|
Figure 94 : Potential news flow |
|
|
||
|
|
Timing |
|
Event |
Description |
|
|
2018 |
|
Corporate |
Possible business development or M&A activity |
||
|
2018 |
|
Orfadin |
Impact of expected Orfadin generic launches in Europe and US |
||
|
2018 |
|
C5 inhibitor |
Possible start of clinical trials of novel long-acting C5 inhibitor using Fc fusion technology |
||
|
|
November 20th |
Emapalumab |
FDA PDUFA action date |
||
|
|
4Q18/1Q19 |
BIVV001 |
Final results of Phase I/II trial of once-weekly Factor VIII |
||
|
2019 |
|
Kineret |
Update on plans for Phase III trial in acute gout |
||
|
2019-20 |
SOBI003 |
First results from Phase I trial of SOBI003 in Sanfilippo A syndrome (MPS IIIA) |
|||
|
2019 |
|
Kineret |
Results from Phase III trial in Still's disease |
||
|
|
4Q18/1Q19 |
Elocta |
Results of 'Rescue ITI' trial (ReITIrate) in haemophilia A with inhibitors post ITI |
||
|
|
Source: Deutsche Bank |
|
|
|
|
|
|
|
|
|
||
53 Page |
|
|
|
|
|
|
|
|
|
|
|
|
|
2018 December 10 Pharmaceuticals Pharmaceuticals European
vk.com/id446425943
54 Page |
Summary model |
|
|
|
|
|
|
|
|
|
|
|
|
|
|
|
|
|
|
Figure 95 : SOBI summary P&L |
|
|
|
|
|
|
|
|
|
|
|
|
|
|
|
|
|
|
|
|
SEKm ex-per share |
2016A |
2017A |
2018E |
2019E |
2020E |
2021E |
2022E |
2023E |
|
|
|
|
|
|
|
|
|
|
|
Revenues |
5,204 |
6,511 |
9,091 |
13,571 |
14,865 |
15,713 |
16,710 |
17,096 |
|
Gross profit |
3,651 |
4,657 |
6,686 |
10,071 |
11,121 |
11,784 |
12,581 |
12,897 |
|
% of sales |
70% |
72% |
74% |
74% |
75% |
75% |
75% |
75% |
|
SG&A (excl. amortisation) |
(1,366) |
(1,643) |
(2,000) |
(2,852) |
(3,149) |
(3,366) |
(3,577) |
(3,666) |
|
R&D |
(778) |
(908) |
(1,170) |
(1,696) |
(1,932) |
(2,043) |
(2,172) |
(2,222) |
|
Amortisation |
(410) |
(453) |
(444) |
(1,443) |
(1,443) |
(1,443) |
(1,443) |
(1,443) |
|
EBITA |
1,543 |
2,054 |
3,528 |
5,523 |
6,040 |
6,376 |
6,832 |
7,008 |
|
Margin (%) |
30% |
32% |
39% |
41% |
41% |
41% |
41% |
41% |
|
PBT |
1,048 |
1,533 |
3,064 |
3,656 |
4,183 |
4,541 |
5,023 |
5,226 |
|
Tax (expense)/benefit |
(239) |
(384) |
(659) |
(804) |
(862) |
(936) |
(1,035) |
(1,076) |
|
Tax rate |
23% |
25% |
22% |
22% |
21% |
21% |
21% |
21% |
|
Net Income |
809 |
1,149 |
2,405 |
2,852 |
3,321 |
3,606 |
3,988 |
4,149 |
|
Basic EPS |
3.02 |
4.27 |
8.90 |
9.66 |
11.20 |
12.11 |
13.34 |
13.82 |
|
Core EPS |
4.08 |
5.51 |
10.16 |
13.42 |
15.01 |
15.91 |
17.12 |
17.58 |
|
Source: Deutsche Bank, Company data |
|
|
|
|
|
|
|
|
|
|
|
|
|
|
|
|
|
|
|
|
|
|
|
|
|
|
|
|
|
Figure 96 : 2019E revenue split |
|
Figure 97 : Sales and EPS growth 2016A-2023E |
|
|
|
|||||
|
Other |
|
|
|
|
|
|
|
|
|
|
|
7% |
|
18,000 |
|
|
|
|
|
|
20 |
|
|
|
|
16,000 |
|
|
|
|
|
|
18 |
|
|
Synagis |
Elocta (EU) |
14,000 |
|
|
|
|
|
|
16 |
|
|
19% |
32% |
|
|
|
|
|
|
|
|
|
|
SEKRENUEVEM |
|
|
|
|
|
|
14 |
(SEK)EPSERO |
||
|
|
|
|
|
|
|
|
|
|||
|
|
|
12,000 |
|
|
|
|
|
|
|
|
|
|
|
10,000 |
|
|
|
|
|
|
12 |
|
|
|
|
|
|
|
|
|
|
|
|
|
|
Gamifant |
|
|
|
|
|
|
|
|
10 |
|
|
1% |
|
8,000 |
|
|
|
|
|
|
8 |
|
|
Orfadin |
|
|
|
|
|
|
|
|
|
|
|
|
6,000 |
|
|
|
|
|
|
|
C |
|
|
6% |
|
|
|
|
|
|
|
6 |
|
|
|
|
|
|
|
|
|
|
|
|
||
|
|
|
4,000 |
|
|
|
|
|
|
4 |
|
|
|
|
|
|
|
|
|
|
|
|
|
Deutsche |
|
|
2,000 |
|
|
|
|
|
|
2 |
|
|
Alprolix (EU) |
- |
|
|
|
|
|
|
0 |
|
|
|
|
|
|
|
|
|
|
|
|||
|
Kineret |
10% |
|
|
|
|
|
|
|
||
|
11% |
|
2016A |
2017A |
2018E |
2019E |
2020E |
2021E |
2022E |
2023E |
|
|
Refacto |
Hemophilia |
|
|
|
|
|
|
|
|
|
Bank |
3% |
royallties… |
|
REVENUE |
|
|
CORE EPS |
|
|
||
Source: Deutsche Bank |
|
Source: Deutsche Bank, Company data |
|
|
|
|
|
|
|
||
AG/London |
|
|
|
|
|
|
|
|
|||
|
|
|
|
|
|
|
|
|
|
|
|
2018 December 10 Pharmaceuticals Pharmaceuticals European

vk.com/id446425943
Bank Deutsche |
MorphoSys (Upgrading to Buy, PT €130) |
|
|
||
MORe to come |
||
AG/London |
|
market (Tremfya, partnered with J&J) looks poised to become a multi-billion blockbuster and we believe that late stage data for its proprietary lead |
|
■ |
We are upgrading to Buy as we believe the pipeline can continue to produce positive surprises. With 115 antibody drug candidates currently in |
|
|
development (103 partnered, 12 proprietary) we see best-in-class risk diversification and value creation potential. The company’s first product on the |
|
|
candidate MOR208 are very encouraging. In addition, we see multiple potential catalysts across the remainder of the portfolio, including a potential |
|
|
near-term settlement of the MOR202 patent case. Shares are currently trading around 20% below all-time highs, while prospects look stronger than |
|
|
ever before; Buy. |
|
■ |
Tremfya taking up strongly, MOR208 data very encouraging, and further catalysts ahead. 2018 revenue guidance has been recently raised to the |
|
|
higher end of the corridor (€67-72m) given strong uptake of Tremfya and corresponding royalty income, while the upcoming ECLIPSE read-out could |
|
|
result in further upside to peak sales estimates. Meanwhile, the latest L-MIND data for MOR208 (esp. median progression free survival of 16.2 months) |
|
|
look highly encouraging, suggesting scope not only for a successful launch in 2L DLBCL in 2020 as planned, but also for broadening of development |
|
|
in 1L DLBCL. Other potential catalysts include settlement of the MOR202 patent case, PIII start for MOR103, PI/II data and further broadening of |
|
|
development of MOR106, and up to 20 PII and III read-outs from the partnered pipeline to the end of next year. |
|
■ |
Raising target price to €130 (€120). We have raised our DCF-derived target price, mainly on increased confidence in MOR208 and inclusion of a |
|
|
potential settlement of the MOR202 patent case on conservative assumptions (please see overleaf for further details). Our earnings forecasts remain |
|
|
broadly unchanged, but we see upside to our forecasts and target price on further pipeline de-risking. The main downside risks to relate to setbacks |
|
|
regarding Tremfya, clinical MOR, and late-stage partnered programs as well as proprietary pipeline overspend and value-dilutive M&A and/or in- |
|
|
licensing. |
Figure 98 : MorphoSys valuation overview (EUR/share) |
|
|
Figure 99 : MorphoSys NPV valuation |
|
|
|
|
||||||
140 |
|
|
|
|
|
Product |
Phase |
Launch |
Peak sales |
Probability |
NPV |
NPV/share |
% of total |
|
|
|
|
|
|
|
|
|
(EURm) |
|
(EURm) |
(EUR) |
|
120 |
|
|
|
0.1 |
11.3 |
|
|
|
|
|
|
|
|
|
|
6.7 |
|
Partnered programs |
|
|
|
|
1,924 |
60.5 |
47% |
||
|
|
|
|
|
|
|
|
||||||
|
|
|
|
|
Novartis (n=54) |
pre PIII |
pre 2026 |
48,000 |
11-33% |
666 |
21.0 |
16% |
|
|
|
|
15.2 |
|
|
||||||||
100 |
|
Tremfya |
|
|
Other (n=47) |
pre PIII |
pre 2026 |
42,000 |
11-33% |
642 |
20.2 |
16% |
|
|
|
|
|
||||||||||
|
|
|
5.9 |
|
|
Gantenerumab |
III |
2024 |
10,000 |
10% |
135 |
4.2 |
3% |
|
Gantenerumab |
|
2.5 |
|
|
Tremfya |
marketed |
2017 |
3,000 |
100% |
480 |
15.1 |
12% |
|
|
|
|
|
|||||||||
80 |
|
|
|
|
|
|
|
|
|
|
|
|
|
|
|
|
|
|
MOR porgrams |
|
|
|
|
|
58.3 |
45% |
|
|
|
27.8 |
|
|
|
|
|
|
|
|
|||
|
|
|
|
|
MOR208 |
III |
2020 |
2,000 |
52% |
884 |
27.8 |
21% |
|
|
|
|
|
|
130.0 |
||||||||
60 |
|
|
|
|
MOR202 |
II |
2022 |
500 |
33% |
80 |
2.5 |
2% |
|
|
|
|
|
|
|||||||||
|
|
|
|
|
|
marketed |
2015 |
|
25% |
|
|
|
|
|
|
15.1 |
|
|
|
Darzalex royalties |
7,000 |
188 |
5.9 |
5% |
|||
|
4.2 |
|
|
|
|
MOR103 |
II |
2023 |
1,500 |
65% |
485 |
15.2 |
12% |
40 |
|
|
|
|
MOR106 |
II |
2024 |
2,000 |
30% |
213 |
6.7 |
5% |
|
|
|
|
|
|
|||||||||
|
20.2 |
Other collaborations |
|
|
|
other (n=7) |
pre PII |
tbd |
tbd |
tbd |
3.2 |
0.1 |
0% |
|
|
|
|
|
Net cash |
|
|
|
|
358 |
11.3 |
9% |
|
20 |
|
|
|
|
|
|
|
|
|
||||
|
|
|
|
|
|
|
|
|
|
|
130.0 |
100% |
|
|
21.0 |
Novartis collaboration |
|
|
|
|
|
|
|
|
|
||
|
|
|
|
|
|
|
|
|
|
|
|
||
0 |
|
|
|
|
|
|
|
|
|
|
|
|
|
|
Partnered Partnered Partnered MOR208 MOR202 |
Darzalex |
MOR103 MOR106 other MOR Net cash |
Total |
|||||
|
programs |
programs |
programs |
royalties |
programs |
(DB target |
|||
55Page |
(pre PIII) |
(PIII) |
(marketed) |
|
|
price) |
|||
Source: Deutsche Bank |
|
|
|
|
Source: Deutsche Bank |
|
|||
|
|
|
|
|
|||||
|
|
|
|
|
|
|
|
|
|
2018 December 10 Pharmaceuticals Pharmaceuticals European

vk.com/id446425943
56 Page |
|
Support for change in recommendation |
|
|
|
||
|
■ |
MOR208 profile looks compelling and opportunity could go far beyond 2L DLBCL. MorphoSys’ proprietary lead candidate MOR208 (Fc-enhanced |
|||||
|
|
||||||
|
|
|
anti-CD19 antibody) is developed in various blood cancers (DLBCL, CLL, SLL). The compound received FDA Breakthrough Therapy designation |
||||
|
|
|
in Oct-17, based on strong interim data in combination with lenalidomide for treatment of patients with 2L DLBCL. The latest update from the |
||||
|
|
|
corresponding L-MIND trial has further added to the profile of the compound with an impressive mPFS of 16.2 months among the highlights. This |
||||
|
|
|
compares very favorably to existing/upcoming approaches (3-11 months mPFS) and strongly supports plans for a US launch in 2020. Based on the |
||||
|
|
|
data, we have increased our fair value of MOR208 to E28/share (E21 prev.), assuming higher peak sales (E600m vs. E500m prev.) and probability of |
||||
|
|
|
success (80% vs. 70% prev.) in 2L DLBCL. We have left assumptions for other indications unchanged (E1.5bn peak sales, 33% probability of success), |
||||
|
|
|
but note that these could prove very conservative. Accordingly, we look forward to further updates including the planned broadening of development |
||||
|
|
|
into 1L DLBCL (alone or together with a partner) and a commercial partnership ex the US (where MorphoSys plans to market the product on its own). |
||||
|
|
■ |
Tremfya taking up strongly and peak sales estimates could rise further. In 2017, Tremfya, marketed by J&J for plaque psoriasis, became the first |
||||
|
|
|
drug based on MorphoSys’ antibody technology to receive regulatory approval and since then has taken up strongly with c.€150m sales in 3Q18. We |
||||
|
|
|
have left our €3bn peak sales estimate unchanged for now, but see further upside based on J&J’s strong commercial e orts and further development |
||||
|
|
|
including ongoing PIII studies psoriatic arthritis and Crohn’s disease. Indeed, we believe current market share in psoriasis already support about 2/3 |
||||
|
|
|
of our peak sales estimate, while further share gains are likely and could be accelerated based on the upcoming ECLIPSE read out comparing Tremfya |
||||
|
|
|
and Cosentyx (consensus peak sales ~€5bn). Similarly, psoriatic arthritis and Crohn’s could roughly double the market opportunity for Tremfya with |
||||
|
|
|
first read-outs possible late next year and every €1bn in peak sales worth about €2/share. |
||||
|
|
■ |
MOR202 patent litigation could drive meaningful upside. MorphoSys has filed a lawsuit against J&J and Genmab for infringement of several patents |
||||
|
|
|
by Darzalex (launched in 2015, consensus peak sales ~€6bn). The jury trial is scheduled for 2019 and while the outcome is di cult to predict, we |
||||
|
|
|
wouldn’t be surprised if the parties settle before. We have decided to include this possibility in our valuation, conservatively assuming a 25% probability |
||||
|
|
|
and 2.5% royalty rate on Darzalex sales, which adds €6/share to our model. At the same time we have reduced the fair value of MOR202 to €2/share |
||||
|
|
|
(from €5) to reflect the company’s decision to no longer invest behind it in multiple myeloma without a partner; i.e. we only carry a value for the |
||||
|
|
|
partnership with iMAB in Greater China with upside from further partnerships and/or development in other indications such as autoimmune diseases. |
||||
|
|
|
|
|
|
||
|
|
Figure 100 : Potential news flow |
|
|
|
||
|
|
Timing |
|
Event / Description |
Timing |
Event / Description |
|
|
|
|
|
|
|||
|
|
Corporate / Selected proprietary programs |
Selected partnered programs |
||||
|
|
early Dec 2018 |
MOR208 L-MIND data presentation at Ash and update on further development plans |
early 2019 |
Tremfya - PIII ECLIPSE read-out (vs. Cosentyx in moderate/severe plaque-type psoriasis) |
||
|
|
1Q-19 |
|
MOR202 start of pivotal study in multiple myeloma in China partner by I-MAB |
2H-19 |
Tremfya - PIII Discover-1 read-out (psoriatic arthritis) |
|
|
|
1Q-19 |
|
MOR202 patent case update (jury trial or potential settlement before) |
2H-19 |
Utomilumab - PII read-out in oropharyngeal cancer |
|
|
|
13-Mar-19 |
|
4Q18 results (after US market close) |
2H-19 |
Setrusumab - PII data in osteogenis imperfecta |
|
Deutsche |
|
07-May-19 |
|
1Q19 results (after US market close) |
2019 |
Gantenerumab - PIII data in mild Alzehimer's (open labe extension) |
|
|
1H-19 |
|
MOR103 update on further development plan by partner GSK (i.e. pot'l start of PIII) |
2019 |
Anetumab ravtansine - various PII read-outs in mesothelin expressing cancers |
||
|
1H-19 |
|
MOR202 update on development plans in autoimmune diseases |
2019 |
Bimagrumab - various PII read-outs across Sarcopenia, muscular artrophy, diabetes mellitus |
||
|
mid-2019 |
|
MOR208 final L-MIND data and subsequent filing with the FDA |
2019 |
Ianalumab - PII read-outs in Pemphigus Vulgaris and Primary Sjörgen's syndrome |
||
Bank |
|
06-Aug-19 |
|
2Q19 results (after US market close) |
|
|
|
|
29-Oct-19 |
|
3Q19 results (after US market close) |
|
|
|
|
AG/London |
|
2H-19 |
|
MOR106 PII data from IGUANA trial |
|
|
|
2019 |
|
MOR208 potential partnering (e.g. Europe commercilization, development beyond 1L DLBCL) |
|
|
|
||
|
Source: Deutsche Bank, Company data |
|
|
|
|||
|
|
|
|
||||
|
|
|
|
|
|
|
|
|
|
|
|
|
|
|
|
2018 December 10 Pharmaceuticals Pharmaceuticals European

vk.com/id446425943
Deutsche |
|
Summary model |
|
|
|
|
|
|
|
|
|
|
|
|
|
|
|
|
|
|
|
|
|
|
|
|
|
|
|
|
|
|
|
|
|||||||
|
|
|
|
|
|
|
|
|
|
|
|
|
|
|
|
|
|
|
|
|
|
|
|
|
|
|
|
|
|
|
|
|
|
|
|||||||
|
Figure 101 : MorphoSys summary P&L |
|
|
|
|
|
|
|
|
|
|
|
|
|
|
|
|
|
|
|
|
|
|
|
|
|
|
|
|
||||||||||||
Bank |
|
EURm ex-per share data |
|
|
|
2013A |
2014A |
|
2015A |
|
2016A |
|
|
2017A |
|
2018E |
|
2019E |
|
|
|
2020E |
|
2021E |
2022E |
||||||||||||||||
|
|
|
|
|
|
|
|
|
|
|
|
|
|
|
|
|
|
|
|
|
|
|
|
|
|
|
|
|
|
|
|
|
|
|
|
|
|
|
|
|
|
AG/London |
|
Revenue |
|
|
|
|
|
|
|
|
78 |
|
64 |
|
106 |
|
50 |
67 |
|
71 |
|
37 |
|
|
|
85 |
|
161 |
248 |
||||||||||||
|
Gross margin |
|
|
|
|
|
|
100% |
|
100% |
|
100% |
|
100% |
100% |
|
100% |
|
100% |
|
|
|
94% |
|
94% |
92% |
|||||||||||||||
|
|
Growth |
|
|
|
|
|
|
|
|
|
|
-18% |
|
66% |
|
-53% |
34% |
|
6% |
|
-48% |
|
|
|
130% |
|
91% |
53% |
||||||||||||
|
|
Gross profit |
|
|
|
|
|
|
|
|
78 |
|
64 |
|
106 |
|
50 |
67 |
|
71 |
|
37 |
|
|
|
80 |
|
151 |
228 |
||||||||||||
|
|
SG&A |
|
|
|
|
|
|
|
|
19 |
|
14 |
|
15 |
|
14 |
17 |
|
30 |
|
43 |
|
|
|
60 |
|
|
69 |
71 |
|||||||||||
|
|
R&D |
|
|
|
|
|
|
|
|
49 |
|
56 |
|
79 |
|
96 |
117 |
|
101 |
|
101 |
|
|
|
101 |
|
102 |
102 |
||||||||||||
|
|
EBIT |
|
|
|
|
|
|
|
|
10 |
|
-6 |
|
17 |
|
-60 |
-68 |
|
-60 |
|
-107 |
|
|
|
-82 |
|
-19 |
54 |
||||||||||||
|
|
EBIT margin |
|
|
|
|
|
|
13% |
|
-9% |
|
16% |
|
-121% |
-101% |
|
-85% |
|
-291% |
|
|
|
-96% |
|
-12% |
22% |
||||||||||||||
|
|
Financial result |
|
|
|
|
|
1 |
|
2 |
|
3 |
|
0 |
-1 |
|
-1 |
|
0 |
|
|
|
0 |
|
|
0 |
0 |
||||||||||||||
|
|
Income tax |
|
|
|
|
|
|
|
|
3 |
|
-1 |
|
6 |
|
1 |
1 |
|
0 |
|
0 |
|
|
|
0 |
|
|
0 |
0 |
|||||||||||
|
|
Tax rate |
|
|
|
|
|
|
31% |
|
30% |
|
28% |
|
-1% |
-2% |
|
0% |
|
0% |
|
|
|
0% |
|
0% |
0% |
||||||||||||||
|
|
Net income |
|
|
|
|
|
|
|
|
13 |
|
-3 |
|
15 |
|
-60 |
-70 |
|
-61 |
|
-107 |
|
|
|
-82 |
|
-19 |
54 |
||||||||||||
|
|
EPS |
|
|
|
|
|
|
0.54 |
|
-0.12 |
|
0.57 |
|
-2.28 |
-2.41 |
|
-1.99 |
|
-3.37 |
|
|
|
-2.56 |
|
-0.60 |
1.71 |
||||||||||||||
|
|
Growth |
|
|
|
|
|
|
|
|
|
-123% |
|
-595% |
|
-505% |
16% |
|
-12% |
|
69% |
|
|
|
-24% |
|
-77% |
-384% |
|||||||||||||
|
|
Source: Deutsche Bank, Company data |
|
|
|
|
|
|
|
|
|
|
|
|
|
|
|
|
|
|
|
|
|
|
|
|
|
|
|
|
|
|
|
|
|
||||||
|
|
|
|
|
|
|
|
|
|
|
|
|
|
|
|
|
|
|
|
|
|
|
|
|
|
|
|
|
|
|
|
|
|
|
|||||||
|
|
|
|
|
|
|
|
|
|
|
|
|
|
|
|
|
|
|
|
|
|
|
|
|
|
|
|
||||||||||||||
|
|
|
|
|
|
|
|
|
|
|
|
|
|
|
|
|
|
|
|
|
|
|
|
|
|
|
|
||||||||||||||
|
|
Figure 102 : Maturing pipeline (# of programs) |
|
|
|
|
|
|
Figure 103 : Revenues by segment (EURm) |
|
|
|
|
|
|||||||||||||||||||||||||||
|
100 |
|
|
|
|
|
|
|
|
|
|
|
|
|
|
|
|
|
|
|
|
|
250 |
|
|
|
|
|
|
|
|
|
|
|
|
|
|
|
|
|
|
|
90 |
|
|
|
|
|
|
|
|
|
|
|
|
|
|
|
|
|
|
|
|
|
200 |
|
|
|
|
|
|
|
|
|
|
|
|
|
|
|
|
|
|
|
|
|
|
|
|
|
|
|
|
|
|
|
|
|
|
|
|
|
|
|
|
|
|
|
|
|
|
|
|
|
|
|
|
|
|
|
|
||||
|
80 |
|
|
|
|
|
|
|
|
|
|
|
|
|
|
|
|
|
|
|
|
|
|
|
|
|
|
|
|
|
|
|
|
|
|
|
|
|
|
||
|
|
|
|
|
|
|
|
|
|
|
|
|
|
|
|
|
|
|
|
|
|
|
|
|
|
|
|
|
|
|
|
|
|
|
|
|
|
||||
|
70 |
|
|
|
|
|
|
|
|
|
|
|
|
|
|
|
|
|
|
|
|
|
150 |
|
|
|
|
|
|
|
|
|
|
|
|
|
|
|
|
|
|
|
|
|
|
|
|
|
|
|
|
|
|
|
|
|
|
|
|
|
|
|
|
|
|
|
|
|
|
|
|
|
|
|
|
|
|
|
|
||||
|
60 |
|
|
|
|
|
|
|
|
|
|
|
|
|
|
|
|
|
|
|
|
|
|
|
|
|
|
|
|
|
|
|
|
|
|
|
|
|
|
||
|
|
|
|
|
|
|
|
|
|
|
|
|
|
|
|
|
|
|
|
|
|
|
|
|
|
|
|
|
|
|
|
|
|
|
|
|
|
||||
|
50 |
|
|
|
|
|
|
|
|
|
|
|
|
|
|
|
|
|
|
|
|
|
100 |
|
|
|
|
|
|
|
|
|
|
|
|
|
|
|
|
|
|
|
|
|
|
|
|
|
|
|
|
|
|
|
|
|
|
|
|
|
|
|
|
|
|
|
|
|
|
|
|
|
|
|
|
|
|
|
|
||||
|
40 |
|
|
|
|
|
|
|
|
|
|
|
|
|
|
|
|
|
|
|
|
|
|
|
|
|
|
|
|
|
|
|
|
|
|
|
|
|
|
||
|
|
|
|
|
|
|
|
|
|
|
|
|
|
|
|
|
|
|
|
|
|
|
|
|
|
|
|
|
|
|
|
|
|
|
|
|
|
||||
|
|
|
|
|
|
|
|
|
|
|
|
|
|
|
|
|
|
|
|
|
|
|
|
|
|
|
|
|
|
|
|
|
|
|
|
||||||
|
30 |
|
|
|
|
|
|
|
|
|
|
|
|
|
|
|
|
|
|
|
|
|
50 |
|
|
|
|
|
|
|
|
|
|
|
|
|
|
|
|
|
|
|
|
|
|
|
|
|
|
|
|
|
|
|
|
|
|
|
|
|
|
|
|
|
|
|
|
|
|
|
|
|
|
|
|
|
|
|
|
||||
|
20 |
|
|
|
|
|
|
|
|
|
|
|
|
|
|
|
|
|
|
|
|
|
|
|
|
|
|
|
|
|
|
|
|
|
|
|
|
|
|
||
|
|
|
|
|
|
|
|
|
|
|
|
|
|
|
|
|
|
|
|
|
|
|
|
|
|
|
|
|
|
|
|
|
|
|
|
|
|
||||
|
|
|
|
|
|
|
|
|
|
|
|
|
|
|
|
|
|
|
|
|
|
|
|
|
|
|
|
|
|
|
|
|
|
|
|
||||||
|
10 |
|
|
|
|
|
|
|
|
|
|
|
|
|
|
|
|
|
|
|
|
|
0 |
|
|
|
|
|
|
|
|
|
|
|
|
|
|
|
|
|
|
|
|
|
|
|
|
|
|
|
|
|
|
|
|
|
|
|
|
|
|
|
|
|
|
|
|
|
|
|
|
|
|
|
|
|
|
|
|
||||
|
0 |
|
|
|
|
|
|
|
|
|
|
|
|
|
|
|
|
|
|
|
|
|
|
|
|
|
|
|
|
|
|
|
|
|
|
|
|
|
|
||
|
|
|
|
|
|
|
|
|
|
|
|
|
|
|
|
|
|
|
|
|
|
|
2012A |
2013A |
2014A |
2015A |
2016A |
2017A |
2018E |
2019E |
2020E |
2021E |
2022E |
||||||||
|
|
|
|
|
|
|
|
|
|
|
|
|
|
|
|
|
|
|
|
|
|
|
|
||||||||||||||||||
|
2006 |
2007 |
2008 |
2009 |
2010 |
2011 |
2012 |
2013 |
2014 |
2015 |
2016 |
2017 |
2018 |
|
|
|
|
||||||||||||||||||||||||
|
|
|
|
|
|
|
|
|
|
|
|
|
|
|
|
|
|
|
|
|
|||||||||||||||||||||
|
|
|
|
|
|
|
Pre-clinical programs |
|
Clinical programs |
|
|
Marketed programs |
|
|
|
|
|
|
|
|
|
|
Partnered discovery |
|
|
Proprietary development |
|
|
|
||||||||||||
|
|
|
|
|
|
|
|
|
|
|
|
|
|
|
|
|
|
|
|
|
|
|
|
||||||||||||||||||
|
|
Source: Company data |
|
|
|
|
|
|
|
|
|
|
|
|
|
|
|
|
Source: Deutsche Bank Company data |
|
|
|
|
|
|
|
|
|
|
|
|||||||||||
|
|
|
|
|
|
|
|
|
|
|
|
|
|
|
|
|
|
|
|
|
|
|
|
|
|
|
|
|
|||||||||||||
57 Page |
|
|
|
|
|
|
|
|
|
|
|
|
|
|
|
|
|
|
|
|
|
|
|
|
|
|
|
|
|
|
|
|
|
|
|
|
|
|
|
|
|
|
|
|
|
|
|
|
|
|
|
|
|
|
|
|
|
|
|
|
|
|
|
|
|
|
|
|
|
|
|
|
|
|
|
|
|
|
|
|
|
|
|
2018 December 10 Pharmaceuticals Pharmaceuticals European

10 December 2018
Pharmaceuticals
European Pharmaceuticals
vk.com/id446425943
Page 58
Deutsche Bank AG/London

vk.com/id446425943
Bank Deutsche |
Evotec (Buy, PT €22) |
|
|
||
Still in strong operational shape - further catalysts expected in 2019 |
||
AG/London |
|
partnered compounds continues to mature and carries the potential for significant value creation. With the shares trading at 54x P/E and 29x EV/ |
|
■ |
We believe that growth trends for Evotec’s business are fully intact. The drug discovery and development services business continues to benefit |
|
|
from a strong outsourcing and consolidation trend, and it should grow 10-15% organically in 2019 and beyond. Furthermore, the pipeline of c.100 |
|
|
EBITDA (all 2019) against expected 2017-25E sales and EBITDA CAGRs of 15% and further catalysts expected in 2019 (such as additional partnerships |
|
|
and milestones), we see upside to current share price levels. |
|
■ |
The pipeline of 100 partnered compounds is currently not fully priced in. Our SOTP valuation yields a fair value of €14 for the ‘’EVT Execute’’ services |
|
|
business, which means that at current share price levels, the “EVT Innovate” pipeline is not fully priced in, even though it carries a value of €8, on |
|
|
our estimates. We expect meaningful milestone payments for the pipeline again in 2019 and more compounds should enter into the clinical studies. |
|
|
There is also the potential for additional pipeline partnerships in 2019. |
|
■ |
Evotec is an innovation leader. We expect the company to continue to focus on innovation in 2019. Evotec’s induced pluripotent stem cell (IPSC) |
|
|
platform is unique and aims to perform early-stage drug screening in human derived cell at an earlier point, thereby improving the predictability of |
|
|
a drug’s potential success. It also aims to develop novel therapies. The platform is already partnered with Celgene (in neurodegenerative diseases) |
|
|
and Sanofi (diabetes), and additional partnerships are likely (potentially already in 2019). Also, Evotec took an equity stake in Exscientia in 2017, a |
|
|
UK company that applies artificial intelligence to early stage drug screening. We believe that Evotec should continue to outgrow the competition in |
|
|
2019 due to it's innovative and industry leading platforms. |
Figure 104 : Revenue and adj. EBITDA margin development |
|
Figure 105 : Newsflow |
|
||||||||||
900 |
|
|
|
|
|
|
|
|
|
50.0% |
Timing |
Type |
Description |
800 |
|
|
|
|
|
|
|
|
|
45.0% |
28-Mar-19 |
Results |
FY 2018 |
|
|
|
|
|
|
|
|
|
|
|
|
||
700 |
|
|
|
|
|
|
|
|
|
40.0% |
14-May-19 |
Results |
Q1 2019 |
|
|
|
|
|
|
|
|
|
|
|
|
|
|
600 |
|
|
|
|
|
|
|
|
|
35.0% |
19-Jun-19 |
AGM |
Annual General Meeting |
|
|
|
|
|
|
|
|
|
|
13-Aug-19 |
Results |
Q2 2019 |
|
500 |
|
|
|
|
|
|
|
|
|
30.0% |
|||
|
|
|
|
|
|
|
|
|
|
12-Nov-19 |
Results |
Q3 2019 |
|
|
|
|
|
|
|
|
|
|
|
25.0% |
|||
|
|
|
|
|
|
|
|
|
|
|
|
|
|
400 |
|
|
|
|
|
|
|
|
|
20.0% |
|
|
|
|
|
|
|
|
|
|
|
|
|
|
|
|
|
300 |
|
|
|
|
|
|
|
|
|
15.0% |
|
|
|
|
|
|
|
|
|
|
|
|
|
|
|
|
|
200 |
|
|
|
|
|
|
|
|
|
10.0% |
|
|
|
|
|
|
|
|
|
|
|
|
|
|
|
|
|
100 |
|
|
|
|
|
|
|
|
|
5.0% |
|
|
|
0 |
|
|
|
|
|
|
|
|
|
0.0% |
|
|
|
2015A |
2016A |
2017A |
2018E |
2019E |
2020E |
2021E |
2022E |
2023E |
2024E |
2025E |
|
|
|
|
|
Revenue (lhs, EURm) |
|
|
|
Adj. EBITDA margin (rhs, %) |
|||
Source: Deutsche Bank, Company data |
|
|
|
|
Source: Deutsche Bank, Company data |
|
|||
|
|
|
|
|
|||||
|
|
|
|
|
|
|
|
|
|
59 Page
2018 December 10 Pharmaceuticals Pharmaceuticals European

vk.com/id446425943
Page |
|
|
|
|
|
|
|
|
|
|
|
|
Figure 106 : Evotec summary P&L |
|
|
|
|
|
|
|
|
|
|
|
|
60 |
|
2015A |
2016A |
2017A |
2018E |
2019E |
2020E |
2021E |
2022E |
2023E |
2024E |
2025E |
|
Revenue |
127.7 |
164.5 |
257.6 |
366.1 |
412.7 |
465.2 |
491.5 |
554.3 |
625.2 |
705.1 |
795.3 |
|
Milestones/upfronts/licenses |
12.3 |
18.9 |
27.8 |
|
|
|
|
|
|
|
|
|
Gross profit |
35.1 |
58.6 |
82.6 |
111.1 |
127.4 |
151.0 |
163.9 |
188.7 |
217.2 |
250.2 |
288.3 |
|
margin |
28% |
36% |
32% |
30% |
31% |
32% |
33% |
34% |
35% |
35% |
36% |
|
Total operating costs |
23.5 |
27.2 |
45.1 |
28.9 |
59.1 |
72.2 |
101.8 |
112.7 |
128.1 |
147.1 |
167.5 |
|
Adj. EBITDA |
8.7 |
36.2 |
58.0 |
83.7 |
99.2 |
111.3 |
94.1 |
109.2 |
126.7 |
145.4 |
168.5 |
|
margin |
7% |
22% |
23% |
23% |
24% |
24% |
19% |
20% |
20% |
21% |
21% |
|
EBIT |
11.6 |
31.3 |
37.5 |
66.8 |
68.3 |
78.8 |
62.2 |
76.0 |
89.2 |
103.1 |
120.8 |
|
Non-operating income (expense) |
0.9 |
1.6 |
-11.2 |
-2.3 |
-0.7 |
-0.2 |
0.4 |
0.8 |
1.3 |
1.9 |
2.6 |
|
EBT |
12.5 |
33.0 |
26.3 |
64.5 |
67.6 |
78.6 |
62.5 |
76.8 |
90.5 |
105.0 |
123.3 |
|
Tax |
4.0 |
-6.1 |
-2.3 |
-6.5 |
-15.2 |
-19.6 |
-15.6 |
-19.2 |
-22.6 |
-26.3 |
-30.8 |
|
Net profit |
16.5 |
27.5 |
24.3 |
58.1 |
52.4 |
58.9 |
46.9 |
57.6 |
67.8 |
78.8 |
92.5 |
|
EPS |
0.12 |
0.20 |
0.17 |
0.39 |
0.36 |
0.40 |
0.32 |
0.39 |
0.46 |
0.53 |
0.63 |
|
Source: Deutsche Bank, Company data |
|
|
|
|
|
|
|
|
|
|
|
|
|
|
|
|
|
|
|
|
|
|
|
|
|
|
|
|
|
|
|
|
|
|
|
|
|
Figure 107 : DBe 2019 revenue breakdown |
|
Figure 108 : Sales and EPS 2015-2025E |
|
|
|
|
|
|||||
EVT INNOVATE |
|
900 |
|
|
|
|
|
|
|
|
|
0.80 |
15% |
|
800 |
|
|
|
|
|
|
|
|
|
|
|
|
|
|
|
|
|
|
|
|
|
0.70 |
|
|
|
|
|
|
|
|
|
|
|
|
|
|
|
|
700 |
|
|
|
|
|
|
|
|
|
0.60 |
|
|
|
|
|
|
|
|
|
|
|
|
|
|
|
600 |
|
|
|
|
|
|
|
|
|
0.50 |
|
|
|
|
|
|
|
|
|
|
|
|
|
|
|
500 |
|
|
|
|
|
|
|
|
|
|
|
|
|
|
|
|
|
|
|
|
|
|
0.40 |
|
|
400 |
|
|
|
|
|
|
|
|
|
|
|
|
300 |
|
|
|
|
|
|
|
|
|
0.30 |
|
|
|
|
|
|
|
|
|
|
|
|
|
|
|
200 |
|
|
|
|
|
|
|
|
|
0.20 |
|
|
|
|
|
|
|
|
|
|
|
|
|
|
|
100 |
|
|
|
|
|
|
|
|
|
0.10 |
|
|
|
|
|
|
|
|
|
|
|
|
|
|
EVT EXECUTE |
0 |
|
|
|
|
|
|
|
|
|
0.00 |
|
2015A |
2016A |
2017A |
2018E |
2019E |
2020E |
2021E |
2022E |
2023E |
2024E |
2025E |
|
|
85% |
|||||||||||
|
|
|
|
|
|
|
|
|
|
|
|
|
|
|
|
|
REVENUE (LHS, EURM) |
|
|
EPS (RHS, EUR, DILUTED) |
|
||||
Source: Deutsche Bank, Company data |
|
Source: Deutsche Bank, Company data |
|
|
|
|
|
|
|
|
||
AG/London Bank Deutsche
2018 December 10 Pharmaceuticals Pharmaceuticals European