

DB Global Banks_watermark
.pdfGlobal Banks
vk.com/id446425943 |
|
|
|
|
Deutsche Bank |
|
|
|
|
Research |
|
|
|
|
Europe |
|
Industry |
|
Date |
|
|
|||
Japan |
|
Global Banks |
|
26 November 2018 |
|
|
|
||
Banks |
|
|
|
Industry Update |
Banks |
|
|
|
|
|
|
|
|
|
|
|
|
|
|
Banking on the US - better operating trends
With focus on profitability, returns still remain sub-par
As highlighted in our report Banking on the US: The moment of (stress-test) truth
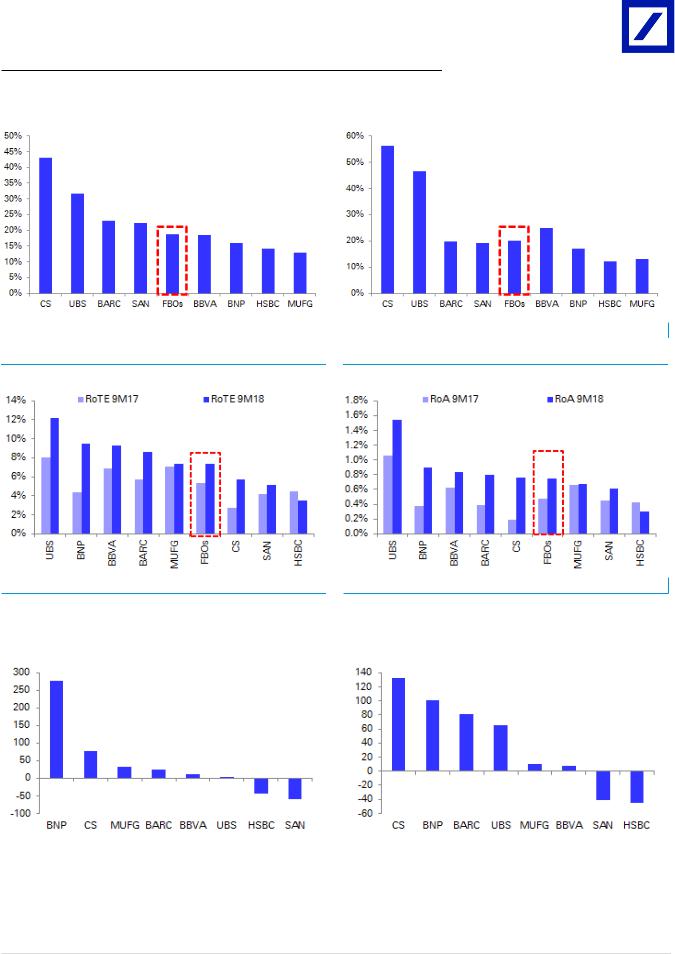
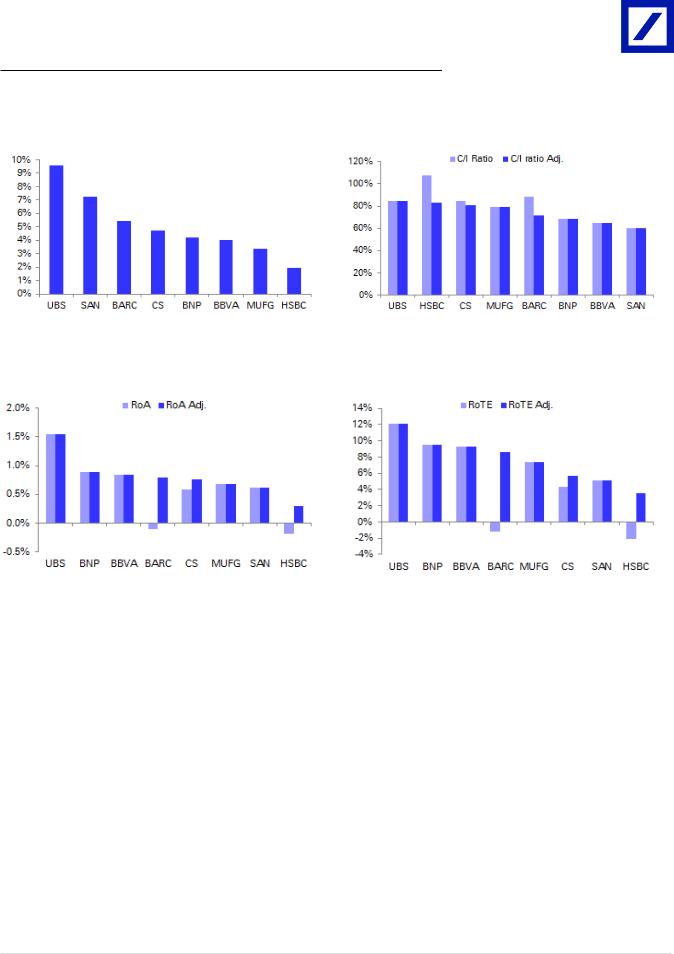
(22-Jun-18), all US IHCs under our coverage had capital cushions in the severely adverse scenario. As such, the focus now shifts to profitability, where most IHCs are still making sub-par returns. In 9M18, on average underlying profitability improved y-o-y to 7.3% RoTE and 74bps of RoA, supported by higher revenues and lower provisions and taxes, while deleveraging also helped RoA. CS, BNP and UBS improved the most (driven by positive operating jaws), while HSBC clearly lagged. Only UBS, BNP and BBVA covered cost of equity in RoTE terms.
US FBOs: Higher revenues supported improvement in profitability
In 9M18, profitability of US IHCs under our coverage improved y-o-y, with average underlying RoTE of 7.3% (5.3% in 9M17, Figure 4 ) and average underlying RoA of 74bps (48bps in 9M17, Figure 5 ), but returns generated are still sub-par and below cost of equity for most banks. For the group as a whole, the improvement in profitability was supported by higher revenues, lower provisions and taxes (deleveraging also helped RoA), while cost-to-income ratios remained stable at 75%.
Which banks improved and which ones lagged?
There were divergent profitability trends among US IHCs in 9M18: CS, BNP and UBS saw the best step-up in profitability y-o-y (supported by positive operating jaws) while, on the other hand, HSBC clearly lagged (negative jaws). SAN and MUFG were impacted by higher adjusted expenses. Only UBS, BNP and BBVA delivered RoTEs above cost of equity in 9M18.
Kinner Lakhani Research Analyst +44-20-754-14140
Amandeep Singh Research Analyst +44-20-7547-4881
Yoshinobu Yamada Research Analyst +81-3-5156-6754
Ignacio Ulargui, CFA Research Analyst +34-91-335-5698
David Lock Research Analyst +44-20-754-11521
Flora Benhakoun Research Analyst +33-1-4495-6617
Benjamin Goy Research Analyst +49-69-910-31946
Figure 1: Underlying RoA 1H18 vs. 1H17
Valuation and Risks
We value banks using DDM and SoTP methodologies. Key upside risks: higher rates; better-than-expected credit growth; further dilution of regulation. Key downside risks: persistently low inflation; weak economic recovery & credit growth; higher LLPs, regulatory risk.
Source: Deutsche Bank, US FED
Deutsche Bank AG/London |
Distributed on: 26/11/2018 04:30:10 GMT |
Deutsche Bank does and seeks to do business with companies covered in its research reports. Thus, investors should be aware that the firm may have a conflict of interest that could a ect the objectivity of this report. Investors should consider this report as only a single factor in making their investment decision. DISCLOSURES AND ANALYST CERTIFICATIONS ARE LOCATED IN APPENDIX 1. MCI (P) 091/04/2018.
7T2se3r0Ot6kwoPa

vk.com/id446425943
26 November 2018 Banks
Global Banks
Page 2 |
Deutsche Bank AG/London |

vk.com/id446425943 |
|
26 November 2018 |
|
Banks |
|
Global Banks |
|
Table Of Contents |
|
Key Charts.......................................................................................................... |
4 |
Capitalisation Charts........................................................................................... |
5 |
Profitability Charts.............................................................................................. |
6 |
Barclays............................................................................................................... |
7 |
BBVA................................................................................................................... |
8 |
BNP Paribas........................................................................................................ |
9 |
Credit Suisse..................................................................................................... |
10 |
HSBC................................................................................................................. |
11 |
MUFG................................................................................................................ |
12 |
Santander.......................................................................................................... |
13 |
UBS................................................................................................................... |
14 |
Deutsche Bank AG/London |
Page 3 |
vk.com/id446425943
26 November 2018 Banks
Global Banks
Key Charts
Figure 2: US IHC CET1 as a % of Group CET1 |
|
Figure 3: US IHC Equity as a % of Group Equity |
|
|
|
Source: Deutsche Bank, US FED
Figure 4: US IHC Underlying RoTE
Source: Deutsche Bank, US FED
Figure 5: US IHC Underlying RoA
Source: Deutsche Bank, US FED
Figure 6: US IHC CET1 Ratio Evolution (Bps, QoQ)
Source: Deutsche Bank, US FED
Figure 7: US IHC Tier 1 Leverage Ratio Evolution (Bps,
QoQ)
Source: Deutsche Bank, US FED |
Source: Deutsche Bank, US FED |
|
|
|
|
Page 4 |
Deutsche Bank AG/London |
vk.com/id44642594326 November 2018
Banks Global Banks
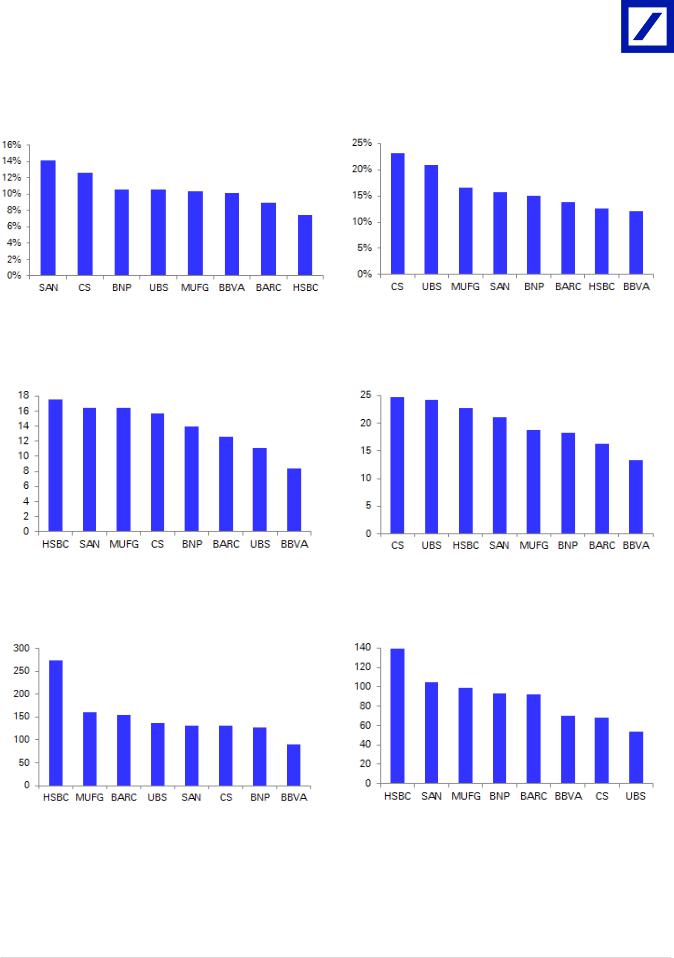
Capitalisation Charts
Figure 8: US IHC – Tier 1 Leverage Ratio – 9M18 |
|
Figure 9: US IHC – CET1 Capital Ratio – 9M18 |
|
|
|
Source: Deutsche Bank, US FED |
Source: Deutsche Bank, US FED |
|
|
|
|
Figure 10: US IHC – CET1 Capital USD Bn – 9M18 |
|
Figure 11: US IHC – Equity USD Bn – 9M18 |
|
|
|
Source: Deutsche Bank, US FED |
Source: Deutsche Bank, US FED |
|
|
|
|
Figure 12: US IHC – Total Assets* USD Bn – 9M18 |
|
Figure 13: US IHC – RWA USD Bn – 9M18 |
|
|
|
Source: Deutsche Bank, US FED |
Source: Deutsche Bank, US FED |
|
|
|
|
Deutsche Bank AG/London |
Page 5 |
vk.com/id446425943
26 November 2018 Banks
Global Banks
Profitability Charts
Figure 14: US IHC – Revenue on Assets – 9M18 |
|
Figure 15: US IHC – Cost to Income Ratio – 9M18 |
|
|
|
Source: Deutsche Bank, US FED |
Source: Deutsche Bank, US FED |
|
|
|
|
Figure 16: US IHC – Return on Assets – 9M18 |
|
Figure 17: US IHC – Return on Tangible Equity – 9M18 |
|
|
|
Source: Deutsche Bank, US FED |
Source: Deutsche Bank, US FED |
|
|
|
|
Page 6 |
Deutsche Bank AG/London |

vk.com/id44642594326 November 2018
Banks Global Banks
Barclays
Figure 18:Barclays US LLC – Key Financials & Ratios
|
Barclays US LLC Barclays US LLC Barclays US LLC Barclays US LLC Barclays US LLC |
||||
(US$'m) |
9M17 |
2017 |
1Q18 |
1H18 |
9M18 |
P&L |
|
|
|
|
|
Net interest income |
2,378 |
3,184 |
833 |
1,671 |
2,545 |
Total noninterest income |
4,358 |
5,687 |
1,536 |
3,092 |
4,431 |
Revenue |
6,736 |
8,871 |
2,369 |
4,763 |
6,976 |
Expenses |
-4,896 |
-6,434 |
-2,832 |
-4,573 |
-6,164 |
ow - Employee expenses |
-1,955 |
-2,662 |
-753 |
-1,461 |
-2,099 |
GOP |
1,840 |
2,437 |
-463 |
190 |
812 |
Provision |
-869 |
-1,259 |
-254 |
-534 |
-790 |
PBT |
971 |
1,178 |
-717 |
-344 |
22 |
Securities and other income |
7 |
8 |
0 |
4 |
4 |
Tax |
-224 |
-873 |
-15 |
-115 |
-163 |
Minority & others |
0 |
0 |
0 |
0 |
3 |
Net Income |
754 |
313 |
-732 |
-455 |
-134 |
Underlying net income |
630 |
981 |
413 |
666 |
1,017 |
|
|
|
|
|
|
Balance Sheet |
|
|
|
|
|
Total assets |
175,284 |
157,927 |
166,157 |
153,409 |
154,641 |
Net loans & leases |
36,746 |
36,466 |
36,030 |
33,928 |
34,076 |
Total bank equity capital |
15,834 |
16,628 |
15,906 |
16,023 |
16,348 |
Average Tang Equity |
14,680 |
15,089 |
15,516 |
15,586 |
15,705 |
|
|
|
|
|
|
Profitability Ratios |
|
|
|
|
|
Reported |
|
|
|
|
|
Non-interest income to total income |
65% |
64% |
65% |
65% |
64% |
Revenue on assets (ReOA) |
4.21% |
4.63% |
4.84% |
5.21% |
5.43% |
Efficiency ratio |
73% |
73% |
120% |
96% |
88% |
Return on assets (ROA) |
0.47% |
0.16% |
-1.49% |
-0.50% |
-0.10% |
Return on equity (ROE) |
6.31% |
1.94% |
-17.61% |
-5.69% |
-1.10% |
RoTE |
6.85% |
2.07% |
-18.87% |
-5.84% |
-1.14% |
Underlying |
|
|
|
|
|
Return on assets (ROA) |
0.39% |
0.51% |
0.84% |
0.73% |
0.79% |
Return on equity (ROE) |
5.28% |
6.06% |
9.94% |
8.33% |
8.38% |
RoTE |
5.73% |
6.50% |
10.65% |
8.55% |
8.63% |
|
|
|
|
|
|
Capital & Leverage |
|
|
|
|
|
Equity capital to assets |
9.0% |
10.5% |
9.6% |
10.4% |
10.6% |
Core capital (leverage) ratio |
6.12% |
6.80% |
6.15% |
6.72% |
7.43% |
Tier 1 leverage ratio |
6.73% |
8.15% |
7.50% |
8.16% |
8.96% |
Common equity tier 1 capital ratio |
12.06% |
13.05% |
11.81% |
13.51% |
13.75% |
Tier 1 risk-based capital ratio |
13.26% |
15.66% |
14.40% |
16.40% |
16.59% |
Total risk-based capital ratio |
16.13% |
18.77% |
16.66% |
18.68% |
18.84% |
Source:Deutsche Bank, FED
Deutsche Bank AG/London |
Page 7 |

vk.com/id446425943
26 November 2018 Banks
Global Banks
BBVA
Figure 19: BBVA Compass Bancshare Inc – Key Financials & Ratios
|
BBVA Compass |
BBVA Compass |
BBVA Compass |
BBVA Compass |
BBVA Compass |
|
Bancshare Inc |
Bancshare Inc |
Bancshare Inc |
Bancshare Inc |
Bancshare Inc |
(US$'m) |
9M17 |
2017 |
1Q18 |
1H18 |
9M18 |
P&L |
|
|
|
|
|
Net interest income |
1,727 |
2,330 |
623 |
1,266 |
1,925 |
Total noninterest income |
744 |
1,041 |
259 |
529 |
787 |
Revenue |
2,471 |
3,371 |
881 |
1,795 |
2,711 |
Expenses |
-1,694 |
-2,309 |
-563 |
-1,143 |
-1,747 |
ow - Employee expenses |
-838 |
-1,135 |
-290 |
-579 |
-874 |
GOP |
777 |
1,062 |
318 |
652 |
964 |
Provision |
-229 |
-288 |
-57 |
-148 |
-243 |
PBT |
548 |
774 |
261 |
504 |
720 |
Securities and other income |
3 |
3 |
0 |
0 |
-1 |
Tax |
-142 |
-316 |
-52 |
-110 |
-152 |
Minority & others |
-1 |
-2 |
0 |
-1 |
-2 |
Net Income |
407 |
459 |
208 |
392 |
566 |
Underlying net income |
407 |
534 |
208 |
392 |
566 |
|
|
|
|
|
|
Balance Sheet |
|
|
|
|
|
Total assets |
85,684 |
87,321 |
87,609 |
88,755 |
90,048 |
Net loans & leases |
59,466 |
60,781 |
61,376 |
62,431 |
63,582 |
Total bank equity capital |
13,086 |
12,984 |
13,115 |
13,162 |
13,313 |
Average Tang Equity |
7,859 |
7,809 |
8,011 |
8,034 |
8,110 |
|
|
|
|
|
|
Profitability Ratios |
|
|
|
|
|
Reported |
|
|
|
|
|
Non-interest income to total income |
30% |
31% |
29% |
29% |
29% |
Revenue on assets (ReOA) |
3.77% |
3.87% |
4.01% |
4.02% |
4.00% |
Efficiency ratio |
69% |
69% |
64% |
64% |
64% |
Return on assets (ROA) |
0.62% |
0.53% |
0.95% |
0.88% |
0.83% |
Return on equity (ROE) |
4.14% |
3.50% |
6.38% |
5.95% |
5.67% |
RoTE |
6.91% |
5.88% |
10.41% |
9.76% |
9.31% |
Underlying |
|
|
|
|
|
Return on assets (ROA) |
0.62% |
0.61% |
0.95% |
0.88% |
0.83% |
Return on equity (ROE) |
4.14% |
4.07% |
6.38% |
5.95% |
5.67% |
RoTE |
6.91% |
6.84% |
10.41% |
9.76% |
9.31% |
|
|
|
|
|
|
Capital & Leverage |
|
|
|
|
|
Equity capital to assets |
15.3% |
14.9% |
15.0% |
14.8% |
14.8% |
Core capital (leverage) ratio |
9.72% |
9.70% |
9.84% |
9.77% |
9.84% |
Tier 1 leverage ratio |
10.00% |
9.98% |
10.12% |
10.05% |
10.12% |
Common equity tier 1 capital ratio |
12.07% |
11.80% |
12.07% |
11.97% |
12.07% |
Tier 1 risk-based capital ratio |
12.42% |
12.15% |
12.42% |
12.31% |
12.41% |
Total risk-based capital ratio |
14.63% |
14.36% |
14.66% |
14.49% |
14.58% |
Source: Deutsche Bank, FED
Page 8 |
Deutsche Bank AG/London |

vk.com/id446425943 |
|
|
|
|
|
|
|
|
26 November 2018 |
|
|
|
|
|
|
|
Banks |
|
|
|
|
|
|
|
Global Banks |
|
|
|
|
|
|
|
|
|
|
|
|
|
|
|
BNP Paribas |
|
|
|
|
|
|
|
|
|
|
|
|
|
|
|
Figure 20: BNP Paribas USA – Key Financials & Ratios |
|
|
|
|
|
|
|
|
BNP Paribas |
BNP Paribas |
BNP Paribas |
BNP Paribas |
BNP Paribas |
|
|
|
USA |
USA |
USA |
USA |
USA |
|
|
(US$'m) |
9M17 |
2017 |
1Q18 |
1H18 |
9M18 |
|
|
P&L |
|
|
|
|
|
|
|
Net interest income |
2,265 |
3,057 |
779 |
1,570 |
2,267 |
|
|
Total noninterest income |
1,493 |
2,049 |
471 |
996 |
2,043 |
|
|
Revenue |
3,758 |
5,106 |
1,250 |
2,566 |
4,311 |
|
|
Expenses |
-2,963 |
-3,976 |
-988 |
-1,996 |
-2,940 |
|
|
ow - Employee expenses |
-1,700 |
-2,254 |
-581 |
-1,162 |
-1,710 |
|
|
GOP |
795 |
1,129 |
262 |
569 |
1,371 |
|
|
Provision |
-117 |
-160 |
-42 |
-52 |
-82 |
|
|
PBT |
678 |
970 |
220 |
518 |
1,289 |
|
|
Securities and other income |
4 |
10 |
10 |
0 |
0 |
|
|
Tax |
-256 |
-622 |
-40 |
-103 |
-302 |
|
|
Minority & others |
-63 |
-69 |
-27 |
-54 |
-70 |
|
|
Net Income |
363 |
288 |
164 |
360 |
916 |
|
|
Underlying net income |
402 |
643 |
177 |
360 |
916 |
|
|
|
|
|
|
|
|
|
|
Balance Sheet |
|
|
|
|
|
|
|
Total assets |
146,032 |
139,136 |
142,266 |
147,840 |
127,519 |
|
|
Net loans & leases |
75,382 |
75,825 |
77,516 |
78,456 |
66,859 |
|
|
Total bank equity capital |
18,131 |
17,555 |
17,376 |
17,628 |
18,202 |
|
|
Average Tang Equity |
12,328 |
12,036 |
11,963 |
12,091 |
12,885 |
|
|
|
|
|
|
|
|
|
|
Profitability Ratios |
|
|
|
|
|
|
|
Reported |
|
|
|
|
|
|
|
Non-interest income to total income |
40% |
40% |
38% |
39% |
47% |
|
|
Revenue on assets (ReOA) |
3.53% |
3.53% |
3.35% |
3.50% |
4.20% |
|
|
Efficiency ratio |
79% |
78% |
79% |
78% |
68% |
|
|
Return on assets (ROA) |
0.34% |
0.20% |
0.44% |
0.49% |
0.89% |
|
|
Return on equity (ROE) |
2.68% |
1.58% |
3.65% |
4.00% |
6.98% |
|
|
RoTE |
3.92% |
2.39% |
5.48% |
5.96% |
9.48% |
|
|
Underlying |
|
|
|
|
|
|
|
Return on assets (ROA) |
0.38% |
0.44% |
0.47% |
0.49% |
0.89% |
|
|
Return on equity (ROE) |
2.97% |
3.54% |
3.95% |
4.00% |
6.98% |
|
|
RoTE |
4.34% |
5.34% |
5.92% |
5.96% |
9.48% |
|
|
|
|
|
|
|
|
|
|
Capital & Leverage |
|
|
|
|
|
|
|
Equity capital to assets |
12.4% |
12.6% |
12.2% |
11.9% |
14.3% |
|
|
Core capital (leverage) ratio |
9.51% |
9.00% |
8.76% |
9.13% |
10.20% |
|
|
Tier 1 leverage ratio |
9.81% |
9.32% |
9.09% |
9.59% |
10.60% |
|
|
Common equity tier 1 capital ratio |
12.50% |
12.44% |
12.16% |
12.19% |
14.96% |
|
|
Tier 1 risk-based capital ratio |
12.89% |
12.87% |
12.64% |
12.81% |
14.98% |
|
|
Total risk-based capital ratio |
14.83% |
15.03% |
14.76% |
14.90% |
17.03% |
|
Source: Deutsche Bank, FED
Deutsche Bank AG/London |
Page 9 |

vk.com/id446425943 |
|
|
|
|
|
|
|
|
26 November 2018 |
|
|
|
|
|
|
|
Banks |
|
|
|
|
|
|
|
Global Banks |
|
|
|
|
|
|
|
|
|
|
|
|
|
|
|
Credit Suisse |
|
|
|
|
|
|
|
|
|
|
|
|
||
|
Figure 21: Credit Suisse Holding (USA) – Key Financials & Ratios |
|
|
|
|
||
|
|
Credit Suisse |
Credit Suisse |
Credit Suisse |
Credit Suisse |
Credit Suisse |
|
|
|
Holding (USA) |
Holding (USA) |
Holding (USA) |
Holding (USA) |
Holding (USA) |
|
|
(US$'m) |
9M17 |
2017 |
1Q18 |
1H18 |
9M18 |
|
|
P&L |
|
|
|
|
|
|
|
Net interest income |
508 |
576 |
-32 |
-63 |
-80 |
|
|
Total noninterest income |
3,559 |
4,622 |
1,672 |
3,275 |
4,908 |
|
|
Revenue |
4,068 |
5,198 |
1,641 |
3,212 |
4,829 |
|
|
Expenses |
-4,146 |
-5,940 |
-1,362 |
-2,777 |
-4,069 |
|
|
ow - Employee expenses |
-2,420 |
-3,211 |
-758 |
-1,504 |
-2,231 |
|
|
GOP |
-78 |
-743 |
279 |
434 |
760 |
|
|
Provision |
-4 |
-1 |
0 |
4 |
10 |
|
|
PBT |
-82 |
-744 |
278 |
439 |
769 |
|
|
Securities and other income |
|
|
-16 |
0 |
0 |
|
|
Tax |
51 |
-1,589 |
-55 |
-100 |
-174 |
|
|
Minority & others |
6 |
-13 |
0 |
-4 |
-4 |
|
|
Net income |
-25 |
-2,347 |
207 |
334 |
591 |
|
|
Underlying net income |
366 |
-207 |
207 |
462 |
774 |
|
|
|
|
|
|
|
|
|
|
Balance Sheet |
|
|
|
|
|
|
|
Total assets |
219,902 |
141,413 |
139,637 |
141,584 |
131,381 |
|
|
Net loans & leases |
23,376 |
21,155 |
21,990 |
13,550 |
12,713 |
|
|
Total bank equity capital |
24,277 |
24,541 |
24,546 |
24,314 |
24,644 |
|
|
Average Tang Equity |
17,791 |
18,118 |
18,055 |
17,942 |
18,103 |
|
|
|
|
|
|
|
|
|
|
Profitability Ratios |
|
|
|
|
|
|
|
Reported |
|
|
|
|
|
|
|
Non-interest income to total income |
88% |
89% |
102% |
102% |
102% |
|
|
Revenue on assets (ReOA) |
2.14% |
2.28% |
4.17% |
4.36% |
4.72% |
|
|
Efficiency ratio |
102% |
114% |
83% |
86% |
84% |
|
|
Return on assets (ROA) |
-0.01% |
-1.03% |
0.53% |
0.45% |
0.58% |
|
|
Return on equity (ROE) |
-0.13% |
-8.98% |
3.15% |
2.67% |
3.22% |
|
|
RoTE |
-0.19% |
-12.95% |
4.58% |
3.72% |
4.36% |
|
|
Underlying |
|
|
|
|
|
|
|
Return on assets (ROA) |
0.19% |
-0.09% |
0.53% |
0.63% |
0.76% |
|
|
Return on equity (ROE) |
1.93% |
-0.79% |
3.15% |
3.69% |
4.21% |
|
|
RoTE |
2.74% |
-1.14% |
4.58% |
5.15% |
5.70% |
|
|
|
|
|
|
|
|
|
|
Capital & Leverage |
|
|
|
|
|
|
|
Equity capital to assets |
11.0% |
17.4% |
17.6% |
17.2% |
18.8% |
|
|
Core capital (leverage) ratio |
5.95% |
7.33% |
10.40% |
10.97% |
12.24% |
|
|
Tier 1 leverage ratio |
5.95% |
7.33% |
10.66% |
11.25% |
12.58% |
|
|
Common equity tier 1 capital ratio |
17.04% |
24.67% |
22.37% |
22.34% |
23.11% |
|
|
Tier 1 risk-based capital ratio |
17.04% |
24.69% |
22.93% |
22.93% |
23.74% |
|
|
Total risk-based capital ratio |
17.12% |
24.79% |
23.03% |
23.02% |
23.83% |
|
Source: Deutsche Bank, FED
Page 10 |
Deutsche Bank AG/London |