

DB U.S. Food_watermark
.pdfvk.com/id446425943
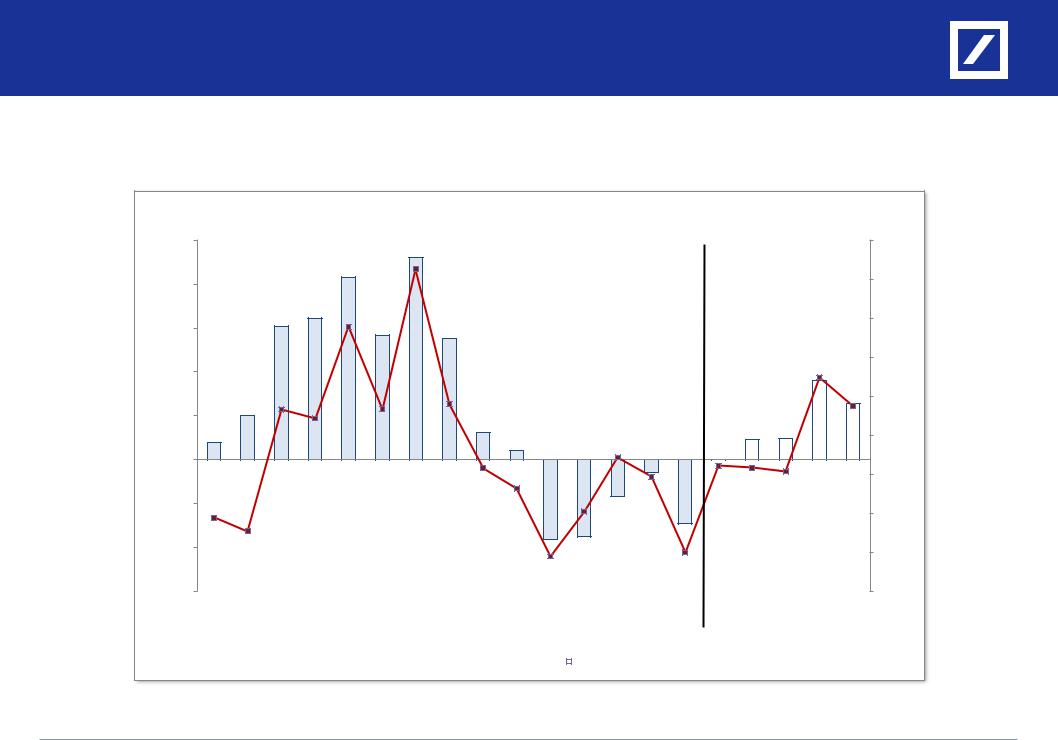
DB U.S. Food Gross Margin & Profit Growth Forecasts
Excluding companies/periods significantly impacted by the effects of acquisitions, we’re looking for an average of ~2% gross profit growth during 2019, with gross margins flat-to-up-slightly y/y, driven by top line growth, the lapping of transportation cost headwinds, and mix benefits…
|
|
|
Food Sector Average Gross Margin Y/Y Delta (bps) - DB Estimates |
|
|
|
|
|
|||||||||||
250 bps |
|
|
|
|
|
|
|
|
|
|
|
|
|
|
|
|
|
|
6% |
200 bps |
|
|
|
|
|
|
|
|
|
|
|
|
|
|
|
|
|
|
5% |
|
|
|
|
|
|
|
|
|
|
|
|
|
|
|
|
|
|
|
|
|
|
|
|
|
|
|
|
|
|
|
|
|
|
|
|
|
|
|
4% |
150 bps |
|
|
|
|
|
|
|
|
|
|
|
|
|
|
|
|
|
|
|
|
|
|
|
|
|
|
|
|
|
|
|
|
|
|
|
|
|
|
3% |
100 bps |
|
|
|
|
|
|
|
|
|
|
|
|
|
|
|
|
|
|
2% |
|
|
|
|
|
|
|
|
|
|
|
|
|
|
|
|
|
|
|
|
50 bps |
|
|
|
|
|
|
|
|
|
|
|
|
|
|
|
|
|
|
1% |
0 bps |
|
|
|
|
|
|
|
|
|
|
|
|
|
|
|
|
|
|
0% |
|
|
|
|
|
|
|
|
|
|
|
|
|
|
|
|
|
|
|
|
|
|
|
|
|
|
|
|
|
|
|
|
|
|
|
|
|
|
|
(1%) |
(50 bps) |
|
|
|
|
|
|
|
|
|
|
|
|
|
|
|
|
|
|
|
|
|
|
|
|
|
|
|
|
|
|
|
|
|
|
|
|
|
|
(2%) |
(100 bps) |
|
|
|
|
|
|
|
|
|
|
|
|
|
|
|
|
|
|
(3%) |
|
|
|
|
|
|
|
|
|
|
|
|
|
|
|
|
|
|
|
|
(150 bps) |
|
|
|
|
|
|
|
|
|
|
|
|
|
|
|
|
|
|
(4%) |
1Q15 |
2Q15 |
3Q15 |
4Q15 |
1Q16 |
2Q16 |
3Q16 |
4Q16 |
1Q17 |
2Q17 |
3Q17 |
4Q17 |
1Q18 |
2Q18 |
3Q18 |
4Q18 |
1Q19 |
2Q19 |
3Q19 |
4Q19 |
|
Gross Margin Y/Y (bps) |
|
|
|
Gross Profit Y/Y |
|
|
|
|
Source: Deutsche Bank, company data
Includes CAG, CPB, GIS, HSY, K, KHC, MDLZ, MKC, SJM
Excludes company periods significantly impacted by the effects of acquisitions
Deutsche Bank |
Rob Dickerson, (+1) 212-250-2160, rob.dickerson@db.com |
21 |
vk.com/id446425943
DB U.S. Food Operating Margin & Profit Growth Forecasts
We’re looking for an average of ~4% y/y operating profit growth in 2019, as fewer SG&A-driven cost savings combined with higher rates of brand investment reduce the gross-to-operating-profit leverage equation…
Food Sector Average Operating Margin Y/Y Delta (bps) - DB Estimates
250 bps |
|
|
|
|
|
|
|
|
|
|
|
|
|
|
|
|
|
|
14% |
200 bps |
|
|
|
|
|
|
|
|
|
|
|
|
|
|
|
|
|
|
12% |
|
|
|
|
|
|
|
|
|
|
|
|
|
|
|
|
|
|
|
|
150 bps |
|
|
|
|
|
|
|
|
|
|
|
|
|
|
|
|
|
|
10% |
|
|
|
|
|
|
|
|
|
|
|
|
|
|
|
|
|
|
|
|
|
|
|
|
|
|
|
|
|
|
|
|
|
|
|
|
|
|
|
8% |
100 bps |
|
|
|
|
|
|
|
|
|
|
|
|
|
|
|
|
|
|
|
|
|
|
|
|
|
|
|
|
|
|
|
|
|
|
|
|
|
|
6% |
50 bps |
|
|
|
|
|
|
|
|
|
|
|
|
|
|
|
|
|
|
|
|
|
|
|
|
|
|
|
|
|
|
|
|
|
|
|
|
|
|
4% |
0 bps |
|
|
|
|
|
|
|
|
|
|
|
|
|
|
|
|
|
|
|
|
|
|
|
|
|
|
|
|
|
|
|
|
|
|
|
|
|
|
2% |
(50 bps) |
|
|
|
|
|
|
|
|
|
|
|
|
|
|
|
|
|
|
0% |
|
|
|
|
|
|
|
|
|
|
|
|
|
|
|
|
|
|
|
|
(100 bps) |
|
|
|
|
|
|
|
|
|
|
|
|
|
|
|
|
|
|
(2%) |
|
|
|
|
|
|
|
|
|
|
|
|
|
|
|
|
|
|
|
|
(150 bps) |
|
|
|
|
|
|
|
|
|
|
|
|
|
|
|
|
|
|
(4%) |
1Q15 |
2Q15 |
3Q15 |
4Q15 |
1Q16 |
2Q16 |
3Q16 |
4Q16 |
1Q17 |
2Q17 |
3Q17 |
4Q17 |
1Q18 |
2Q18 |
3Q18 |
4Q18 |
1Q19 |
2Q19 |
3Q19 |
4Q19 |
|
Operating Margin Y/Y (bps) |
|
|
|
Operating Profit Y/Y |
|
|
|
|
Source: Deutsche Bank, company data
Includes CAG, CPB, GIS, HSY, K, KHC, MDLZ, MKC, SJM
Excludes company periods significantly impacted by the effects of acquisitions
Deutsche Bank |
Rob Dickerson, (+1) 212-250-2160, rob.dickerson@db.com |
22 |

vk.com/id446425943
Sector Performance and Observations
Deutsche Bank |
Rob Dickerson, (+1) 212-250-2160, rob.dickerson@db.com |
23 |
|
|
Source: Deutsche Bank |

vk.com/id446425943
Lower Consensus Reduces Downside Risk for 2019
Although the normal consensus trend in food is for EPS growth expectations to decelerate throughout the year, cost savings drove 2016 growth, while U.S. tax reform benefits have driven 2018... expectations for 2019 EPS growth are now pointing to 3-4% y/y, as incremental savings and tax benefits dissipate, all while brand investment ramps in an effort to drive volume growth...
|
|
Food Basket Consensus EPS Growth Trajectory |
|
|
||||
12% |
|
|
|
|
|
|
|
|
10% |
|
|
|
|
|
|
|
|
8% |
|
|
|
|
|
|
|
|
6% |
|
|
|
|
|
|
|
|
4% |
|
|
|
|
|
|
|
|
2% |
|
|
|
|
|
|
|
|
0% |
|
|
|
|
|
|
|
|
January 1st |
April 1st |
July 1st |
October 1st |
January 1st |
April 1st |
July 1st |
October 1st |
January 1st |
2011 |
2012 |
2013 |
2014 |
2015 |
2016 |
2017 |
2018 |
2019 |
Source: DB Research, FactSet data as of 11/14/18
Deutsche Bank |
Rob Dickerson, (+1) 212-250-2160, rob.dickerson@db.com |
24 |

vk.com/id446425943
Risk Appetite Tilt Towards Safety Driving CPG Outperformance
With continued monetary tightening likely in the U.S., growth in some emerging markets under question, and ongoing heightened global geopolitical risk, we watched the U.S. Dollar strengthen, oil prices drop, and CPG stocks outperform the S&P throughout calendar Q3 results to the tune of ~900 bps.
|
|
|
U.S. Food, Consumer Staples & S&P Price Performance |
|
||||
80% |
|
|
|
|
|
|
|
|
70% |
|
|
|
|
|
|
|
|
60% |
|
|
|
|
|
|
U.S. Food recently |
|
|
53% |
|
|
|
|
underperforming Consumer |
Deutsche Bank |
|
50% |
|
|
|
|
|
Staples, but outperforming |
||
|
|
|
|
|
estimate |
|||
|
|
|
|
|
|
the S&P... |
||
|
|
|
|
|
|
|
|
|
40% |
|
|
|
|
|
|
|
|
|
31% |
|
29% |
|
|
|
|
|
30% |
|
|
|
|
|
|
|
|
|
|
|
|
|
|
|
|
|
20% |
|
|
|
|
|
|
|
|
|
|
9% |
12% |
|
|
|
|
|
10% |
|
5% |
|
|
|
7% |
|
|
|
|
|
5% |
|
4% |
|||
|
|
|
1% |
|
||||
|
|
|
2% |
|
|
2% |
|
|
0% |
|
|
|
|
|
|
(2%) |
|
|
|
|
(3%) |
|
(4%) |
(2%) |
|
|
|
|
|
|
|
|
|||
(10%) |
|
|
|
|
|
|
||
|
|
|
|
|
|
|
||
|
|
|
|
|
|
|
|
|
(20%) |
|
|
|
|
|
5 Years |
3 Years |
1 year |
3 Months |
1 Month |
NTM* |
|
S&P 500 |
|
S&P 500 Consumer Staples |
|
U.S. Food |
|
|
|
|||
|
|
|
Source: DB Research, FactSet data as of 11/14/18
Deutsche Bank |
Rob Dickerson, (+1) 212-250-2160, rob.dickerson@db.com |
25 |

vk.com/id446425943
Relative Sector Valuation Now at Highest Level Since January ‘17
As risk appetite tilted toward “safety”, U.S. food earnings valuations crept on average to a 10% relative premium, the highest we’ve seen since January ’17 and vs. YTD ‘18 parity with the S&P
160 |
U.S. Food Relative and Absolute P/E to the S&P 500 |
22x |
|
|
|
||
140 |
|
20x |
|
|
|
|
|
120 |
|
|
|
|
|
18x |
P/E Absolute |
100 |
|
|
|
RelativeP/E |
|
16x |
|
80 |
|
|
|
|
|
14x |
|
60 |
|
|
|
40 |
|
12x |
|
|
|
|
|
20 |
|
10x |
|
3/02 7/02 11/02 |
3/03 7/03 11/03 3/04 7/04 11/04 3/05 7/05 11/05 3/06 7/06 11/06 3/07 7/07 11/07 3/08 7/08 11/08 3/09 7/09 11/09 3/10 7/10 11/10 3/11 7/11 11/11 3/12 7/12 11/12 3/13 7/13 11/13 3/14 7/14 11/14 3/15 7/15 11/15 3/16 7/16 11/16 3/17 7/17 11/17 3/18 7/18 11/18 |
|
|
U.S. Food vs. S&P 500 Relative P/E Valuation
Average Food Relative P/E vs. S&P 500
Average 10-Year Food Relative P/E vs. S&P 500

 U.S. Food Absolute P/E Valuation
 S&P 500 Absolute P/E Valuation
Average U.S. Food Absolute P/E
Source: DB Research, FactSet data as of 11/14/18
Deutsche Bank |
Rob Dickerson, (+1) 212-250-2160, rob.dickerson@db.com |
26 |

vk.com/id446425943
Sector Beta Well Below Historical Averages
Sector beta dropped to ~25% vs. its ~60% three-year historical sector average
Consumer Staples Sector Beta
70% |
|
|
|
|
|
|
|
65%65% |
|
|
|
|
|
|
|
|
|
|
|
|
|
|
|
||
|
|
|
|
|
|
|
|
|
|
|
|
|
|
|
|
60% |
|
|
|
|
|
|
|
|
|
60% |
|
|
|
58% |
57% |
|
58%59% |
|
|
|||
|
|
|
|
|
|
|
||||||
|
|
|
55% |
|
|
|
|
|
54%54% |
|||
|
|
|
|
|
|
|
54%54% |
|||||
|
|
|
|
|
|
|
|
|||||
50%
40% |
|
|
|
|
|
32%34% |
|
|
|
|
|
|
|
|
|
30% |
|
|
|
|
|
|
25%27% |
20% |
|
|
|
|
|
|
|
10% |
|
|
|
|
|
|
|
0% |
|
|
|
|
|
|
|
15 Year |
10 Year |
5 Year |
3 Year |
2 Year |
1 Year |
3 Month |
1 Month |
|
S&P 500 Consumer Staples |
|
XLP |
|
|
||
|
|
Source: DB Research, FactSet data as of 11/14/18
Deutsche Bank |
Rob Dickerson, (+1) 212-250-2160, rob.dickerson@db.com |
27 |

vk.com/id446425943
DB U.S. Food Coverage Ranking
Rating |
Ticker |
Company |
Price |
Target |
TP |
Div. Yield |
TSR |
NTM (DBe) |
CY18E |
Rationale |
|
11/14/18 |
Price |
Upside |
P/E |
EV/EBITDA |
FCF Yield |
||||||
Buy |
CAG |
Conagra Brands |
$32.64 |
$42 |
28.7% |
2.4% |
31.1% |
13.7x |
11.1x |
4.8% |
Top-line & margin improvement, strong FCF generation, PF synergy upside |
|
|
|
|
|
|
|
|
|
|
|
|
Buy |
HAIN |
Hain Celestial |
$22.34 |
$27 |
20.9% |
0.0% |
20.9% |
17.2x |
10.6x |
3.6% |
Margin upside is real; s/h-friendly cash allocation potential underappreciated |
Buy |
KHC |
Kraft Heinz |
$52.64 |
$63 |
19.7% |
4.7% |
24.4% |
Buy |
NOMD |
Nomad Foods |
$19.47 |
$23 |
18.1% |
0.0% |
18.1% |
Buy |
MDLZ |
Mondelez |
$43.76 |
$48 |
9.7% |
2.4% |
12.0% |
Buy |
SMPL |
Simply Good Foods |
$19.43 |
$21 |
8.1% |
0.0% |
8.1% |
Hold |
HSY |
Hershey |
$107.95 |
$110 |
1.9% |
2.6% |
4.5% |
Hold |
GIS |
General Mills |
$45.30 |
$46 |
1.5% |
4.3% |
5.9% |
Hold |
TWNK |
Hostess Brands |
$11.11 |
$11 |
(1.0%) |
0.0% |
(1.0%) |
Hold |
K |
Kellogg |
$62.46 |
$66 |
5.7% |
3.5% |
9.2% |
Hold |
FLO |
Flowers Foods |
$19.60 |
$18 |
(8.2%) |
3.6% |
(4.5%) |
Hold |
SJM |
J.M. Smucker |
$113.94 |
$107 |
(6.1%) |
3.0% |
(3.1%) |
Hold |
CPB |
Campbell Soup |
$39.16 |
$35 |
(10.6%) |
3.6% |
(7.1%) |
Hold |
DF |
Dean Foods |
$5.99 |
$5 |
(16.5%) |
2.0% |
(14.5%) |
Sell |
MKC |
McCormick |
$147.69 |
$117 |
(20.8%) |
1.4% |
(19.4%) |
13.5x |
12.3x |
7.2% |
Transitory costs rolling off; volume/mix offsetting brand investments |
13.3x |
11.5x |
8.3% |
Strengthening FCF; cash available for share buybacks, debt paydown |
17.4x |
15.6x |
4.5% |
Improving fundamentals, global diversification, strategic optionality |
32.6x |
19.2x |
4.0% |
New target market strategy and distribution expansion potential |
18.8x |
13.4x |
5.0% |
Above-avg top line, under-levered b/s, but higher NT investment needs |
15.0x |
12.2x |
5.6% |
Base business cost/price relationship risk, BUFF execution risk |
17.0x |
10.4x |
N/A |
Near-term headwinds, new CEO, in temporary rebuild mode |
15.6x |
13.7x |
5.5% |
Reinvestments in early innings; EPS & FCF growth limited in medium-term |
20.0x |
11.4x |
5.8% |
Well-positioned on top line, cautious on potential offsets to cost savings |
13.7x |
11.6x |
7.1% |
Increased focus on brand support; key category private label share gains |
16.0x |
13.0x |
7.2% |
CEO departure, brand spend needs, ~5x leverage, LNCE execution risk |
17.0x |
5.3x |
7.4% |
Commodity-like margins & volatility, plant deleverage, pricing pressure |
27.9x |
21.0x |
3.6% |
Base business volume pressure, RB Food deceleration, premium valuation |
Source: Company reports, FactSet, Deutsche Bank estimates and analysis. Prices as of 11/14/18.
Deutsche Bank |
Rob Dickerson, (+1) 212-250-2160, rob.dickerson@db.com |
28 |

vk.com/id446425943
Upside/Downside to Current Stock Price
Although we believe a number of food companies in the U.S. could face limited share price upside given pressured base business fundamentals, we still favor a number of food companies with potential strategic events where we see at least 10% upside over the next twelve months…
|
|
|
|
% Upside / Downside vs. Price Target (NTM) |
|
|
|
|
|
|
|
|
|
|
|||||||||||||||||
Conagra Brands |
|
|
|
|
|
|
|
|
|
|
|
|
|
|
|
|
|
|
|
|
|
|
|
|
|
|
|
|
|
29% |
|
|
|
|
|
|
|
|
|
|
|
|
|
|
|
|
|
|
|
|
|
|
|
|
|
|
|
|
|
|
|||
|
|
|
|
|
|
|
|
|
|
|
|
|
|
|
|
|
|
|
|
|
|
|
|
|
|
|
|
|
|||
Hain Celestial |
|
|
|
|
|
|
|
|
|
|
|
|
|
|
|
|
|
|
|
|
|
|
|
|
|
|
21% |
|
|
|
|
|
|
|
|
|
|
|
|
|
|
|
|
|
|
|
|
|
|
|
|
|
|
|
|
|
|
|
|
|
|
||
Kraft Heinz |
|
|
|
|
|
|
|
|
|
|
|
|
|
|
|
|
|
|
|
|
|
|
|
|
20% |
|
|
|
|
||
|
|
|
|
|
|
|
|
|
|
|
|
|
|
|
|
|
|
|
|
|
|
|
|
|
|
|
|
||||
Nomad Foods |
|
|
|
|
|
|
|
|
|
|
|
|
|
|
|
|
|
|
|
|
|
|
|
18% |
|
|
|
|
|||
|
|
|
|
|
|
|
|
|
|
|
|
|
|
|
|
|
|
|
|
|
|
|
|
|
|
|
|||||
Mondelez International |
|
|
|
|
|
|
|
|
|
|
|
|
|
|
|
|
|
|
|
10% |
|
|
|
|
|
|
|
|
|
|
|
|
|
|
|
|
|
|
|
|
|
|
|
|
|
|
|
|
|
|
|
|
|
|
|
|
|
|
|
|
|||
Simply Good Foods |
|
|
|
|
|
|
|
|
|
|
|
|
|
|
|
|
|
|
8% |
|
|
|
|
|
|
|
|
|
|
||
|
|
|
|
|
|
|
|
|
|
|
|
|
|
|
|
|
|
|
|
|
|
|
|
|
|
|
|
||||
Kellogg |
|
|
|
|
|
|
|
|
|
|
|
|
|
|
|
|
|
6% |
|
|
|
|
|
|
|
|
|
|
|
|
|
|
|
|
|
|
|
|
|
|
|
|
|
|
|
|
|
|
|
|
|
|
|
|
|
|
|
|
|||||
Hershey |
|
|
|
|
|
|
|
|
|
|
|
|
|
|
|
2% |
|
|
|
|
|
|
|
|
|
|
|
|
|
|
|
|
|
|
|
|
|
|
|
|
|
|
|
|
|
|
|
|
|
|
|
|
|
|
|
|
|
|
|
|
|||
General Mills |
|
|
|
|
|
|
|
|
|
|
|
|
|
|
|
2% |
|
|
|
|
|
|
|
|
|
|
|
|
|
|
|
|
|
|
|
|
|
|
|
|
|
|
|
|
|
|
|
|
|
|
|
|
|
|
|
|
|
|
|
|
|||
Hostess Brands |
|
|
|
|
|
|
|
|
|
|
|
(1%) |
|
|
|
|
|
|
|
|
|
|
|
|
|
|
|
|
|
|
|
|
|
|
|
|
|
|
|
|
|
|
|
|
|
|
|
|
|
|
|
|
|
|
|
|
|
|
|
|
|||
J.M. Smucker |
|
|
|
|
|
|
|
(6%) |
|
|
|
|
|
|
|
|
|
|
|
|
|
|
|
|
|
|
|
|
|||
|
|
|
|
|
|
|
|
|
|
|
|
|
|
|
|
|
|
|
|
|
|
|
|
|
|
|
|||||
Flowers Foods |
|
|
|
|
|
|
|
(8%) |
|
|
|
|
|
|
|
|
|
|
|
|
|
|
|
|
|
|
|
|
|
||
|
|
|
|
|
|
|
|
|
|
|
|
|
|
|
|
|
|
|
|
|
|
|
|
|
|
|
|
||||
Campbell Soup |
|
|
|
|
|
(11%) |
|
|
|
|
|
|
|
|
|
|
|
|
|
|
|
|
|
|
|
|
|
|
|
|
|
|
|
|
|
|
|
|
|
|
|
|
|
|
|
|
|
|
|
|
|
|
|
|
|
|
|
|
|
|
|||
Dean Foods |
|
|
(17%) |
|
|
|
|
|
|
|
|
|
|
|
|
|
|
|
|
|
|
|
|
|
|
|
|
|
|
||
|
|
|
|
|
|
|
|
|
|
|
|
|
|
|
|
|
|
|
|
|
|
|
|
|
|
|
|
||||
McCormick |
(21%) |
|
|
|
|
|
|
|
|
|
|
|
|
|
|
|
|
|
|
|
|
|
|
|
|
|
|
|
|
||
|
|
|
|
|
|
|
|
|
|
|
|
|
|
|
|
|
|
|
|
|
|
|
|
|
|
|
|
||||
|
|
|
|
|
|
|
|
|
|
|
|
|
|
|
|
|
|
|
|
|
|
|
|
|
|
||||||
|
|
|
|
|
|
|
|
|
|
|
|
|
|
|
|
|
|
|
|
|
|
|
|
|
|
||||||
|
(25%) |
(20%) |
(15%) |
(10%) |
|
(5%) |
0% |
5% |
10% |
15% |
20% |
25% |
30% |
||||||||||||||||||
|
|
|
|
|
|
|
|
|
|
|
|
|
|
|
|
|
|
|
|
|
|
|
|
|
|
|
|
|
|
|
|
Source: DB Research, FactSet data as of 11/14/18
Deutsche Bank |
Rob Dickerson, (+1) 212-250-2160, rob.dickerson@db.com |
29 |
|
|
Source: Deutsche Bank |

vk.com/id446425943
DB U.S. Food Coverage Comp Sheet
Deutsche Bank Food Coverage - Rob Dickerson - Comparable Company Analysis
|
DB |
Share |
DB |
from |
Div |
Total |
Shares |
Market |
Net |
Enterprise |
EV/EBITDA |
|
P/E |
Relative P/E |
FCF |
Net Debt / |
||
|
|
|
|
|
|
|
|
|
|
|
|
|
|
|
|
|
|
|
Company Name |
Rating |
Price |
Price Target |
Price Target |
Yield |
Return |
Out. |
Cap |
Debt |
Value |
2018E |
2019E |
2018E |
2019E |
2018E |
2019E |
Yield |
2018E EBITDA |
|
|
|
|
|
|
|
|
|
|
|
|
|
|
|
|
|
|
|
Campbell Soup |
HOLD |
$39 |
$35 |
(11)% |
4% |
(7)% |
302 |
$11,826 |
$9,668 |
$21,494 |
12.3x |
13.0x |
16.1x |
16.0x |
76 |
89 |
7.2% |
5.5x |
Conagra Brands |
BUY |
$33 |
$42 |
29% |
2% |
31% |
489 |
$15,961 |
$9,000 |
$24,961 |
16.1x |
11.1x |
15.4x |
13.7x |
72 |
76 |
4.8% |
5.0x |
Dean Foods |
HOLD |
$6 |
$5 |
(17)% |
2% |
(15)% |
91 |
$545 |
$887 |
$1,432 |
7.1x |
5.3x |
N/M |
17.0x |
N/M |
94 |
7.4% |
4.4x |
Flowers Foods |
HOLD |
$20 |
$18 |
(8)% |
4% |
(5)% |
212 |
$4,147 |
$776 |
$4,922 |
11.9x |
11.4x |
21.0x |
20.0x |
99 |
111 |
5.8% |
1.9x |
General Mills |
HOLD |
$45 |
$46 |
2% |
4% |
6% |
603 |
$27,329 |
$15,613 |
$42,942 |
12.9x |
12.2x |
15.0x |
15.0x |
71 |
83 |
5.6% |
4.5x |
Hain Celestial |
BUY |
$22 |
$27 |
21% |
0% |
21% |
104 |
$2,323 |
$666 |
$2,989 |
13.2x |
10.6x |
23.6x |
17.2x |
111 |
95 |
3.6% |
2.9x |
Hershey |
HOLD |
$108 |
$110 |
2% |
3% |
5% |
210 |
$22,710 |
$3,882 |
$26,593 |
14.0x |
13.4x |
45.9x |
18.8x |
216 |
104 |
5.0% |
2.0x |
Hostess Brands |
HOLD |
$11 |
$11 |
(1)% |
0% |
(1)% |
103 |
$1,144 |
$863 |
$2,007 |
10.8x |
10.4x |
20.8x |
17.0x |
98 |
94 |
N/A |
4.6x |
Kellogg |
HOLD |
$62 |
$66 |
6% |
4% |
9% |
349 |
$21,799 |
$8,614 |
$30,413 |
12.7x |
13.7x |
14.4x |
15.6x |
68 |
86 |
5.5% |
3.6x |
Kraft Heinz |
BUY |
$53 |
$63 |
20% |
5% |
24% |
1,228 |
$64,642 |
$31,010 |
$95,652 |
12.9x |
12.3x |
14.4x |
13.5x |
68 |
75 |
7.2% |
4.2x |
McCormick |
SELL |
$148 |
$117 |
(21)% |
1% |
(19)% |
133 |
$19,672 |
$4,912 |
$24,584 |
22.0x |
21.0x |
29.7x |
27.9x |
140 |
154 |
3.6% |
4.4x |
Mondelez International |
BUY |
$44 |
$48 |
10% |
2% |
12% |
1,480 |
$64,765 |
$18,691 |
$83,456 |
15.6x |
15.6x |
18.0x |
17.4x |
85 |
96 |
4.5% |
3.5x |
Nomad Foods |
BUY |
$19 |
$23 |
18% |
0% |
18% |
176 |
$3,421 |
$1,838 |
$5,259 |
12.6x |
11.5x |
14.5x |
13.3x |
68 |
74 |
8.3% |
4.4x |
Simply Good Foods |
BUY |
$19 |
$21 |
8% |
0% |
8% |
76 |
$1,480 |
$79 |
$1,559 |
19.8x |
19.2x |
33.1x |
32.6x |
156 |
180 |
4.0% |
1.0x |
J.M. Smucker |
HOLD |
$114 |
$107 |
(6)% |
3% |
(3)% |
114 |
$12,944 |
$6,523 |
$19,467 |
11.6x |
11.6x |
13.8x |
13.7x |
65 |
76 |
7.1% |
3.9x |
|
|
|
|
|
|
|
|
|
|
|
|
|
|
|
|
|
|
|
Mean |
|
|
|
3% |
2% |
6% |
|
|
|
|
13.8x |
12.9x |
21.2x |
18.1x |
100 |
100 |
|
3.7x |
Median |
|
|
|
2% |
2% |
5% |
|
|
|
|
12.9x |
12.2x |
18.0x |
17.0x |
85 |
94 |
|
4.0x |
|
|
|
|
|
|
|
|
|
|
|
|
|
|
|
|
|
|
|
S&P 500 |
|
|
|
|
2% |
2% |
|
|
|
|
|
|
16.8x |
15.5x |
79 |
85 |
|
|
|
|
|
|
|
|
|
|
|
|
|
|
|
|
|
|
|
|
|
Source: DB Research, Company Reports, FactSet data as of 11/14/18
NOMD estimates converted to USD
Deutsche Bank |
Rob Dickerson, (+1) 212-250-2160, rob.dickerson@db.com |
30 |