

Deloite - USA Forcast 2019_Q2_watermark
.pdfvk.com/id446425943
United States
Economic Forecast
2nd Quarter 2019

vk.com/id446425943
Deloitte Global Economist Network
The Deloitte Global Economist Network is a diverse group of economists that produce relevant, interesting, and thought-provoking content for external and internal audiences. The network’s industry and economics expertise allow it to bring sophisticated analysis to complex, industrybased questions. Publications range from in-depth reports and thought leadership examining critical issues to executive briefs aimed at keeping Deloitte’s top management and partners abreast of topical issues.
vk.com/id446425943
Contents
Introduction |
2 |
Scenarios |
3 |
Sectors |
5 |
Consumer spending |
5 |
Housing |
6 |
Business investment |
7 |
Foreign trade |
9 |
Government |
11 |
Labor markets |
13 |
Financial markets |
15 |
Prices |
16 |
Appendix |
19 |
Endnotes |
23 |

vk.com/id446425943
United States Economic Forecast
Introduction
What happens when Goldilocks wakes up?
A 19th-century children’s story turned into metaphor for a well-functioning economy in the 1990s. The idea that the economy was neither too hot nor too cold, like the ideal bowl of porridge, is a nice description of an economy that registered a 3.2 percent growth rate in the frst quarter but in which infation remained well under control. But that’s not the end of the fairy tale, of course.
GOLDILOCKS EATS THE porridge and sleeps on the bed—but wakes up to three bears staring at her. In most versions of the story,
she jumps out the window and runs away. Understandable, since few of us would want to have to explain such embarrassing circumstances to a trio of bears.
The US economy is likely to wake up soon to some uncomfortable facts. The bears in this case are risks that some observers—especially in fnancial markets—seem to be willing to sleep through. But there are (at least) three of them. We don’t necessarily want to suggest which of the risks is the papa, the mama, or the baby bear, but the key is this: They are all still very much present and looming larger. And at least one has grown in the past
few months.
What bears might Goldilocks face when she wakes up? Well …
•Tarifs are taxes, and the new tarifs imposed on
Chinese goods are likely to have the usual impact of taxes—and slow US economic growth.
Not so long ago, the risk of higher tarifs seemed to be receding. However, trade negotiations with China have run into trouble, and the administration decided to pressure the Chinese
in the form of a signifcant rise in tarifs on US imports from China.1 Estimates of the direct impact on the United States are modest but suffcient to be felt in slower economic growth.2
•While the threat of more Fed tightening has dissipated, low interest rates have created some exotic corporate debt instruments. One thing we learned in the last fnancial crisis is that
“exotic instruments” and fnancial markets are not ideas that coexist together peacefully. The Fed is concerned enough to have mentioned the problem in its latest fnancial stability report.3
•Current budget policy creates a spending clif in
FY 2020 (starting in October 2019) as the temporary lifting of spending caps goes away. Congress could agree to continue the additional spending, or to allow a more gradual decrease. The months-long struggle to pass a disaster relief bill suggests that arriving at such a straightforward outcome will not be easy. The Deloitte baseline assumes that the spending caps revert, creating a signifcant drag on economic growth in 2020.
The US economy could certainly wake up to a menacing bear or three. But right now, there are plenty of signs that the economy is doing well. Job growth
2

vk.com/id446425943
2nd Quarter 2019
FIGURE 1
Real GDP growth
Baseline |
|
Recession |
|
|
|
Coordinated global recovery |
Slower growth |
|
|
||
5% |
|
|
|
|
|
% |
|
|
|
|
|
3% |
|
|
|
|
|
2% |
|
|
|
|
|
1% |
|
|
|
|
|
0% |
|
|
|
|
|
-1% |
|
|
|
|
|
-2% |
|
|
|
History |
Forecast |
|
|
|
|
||
-3% |
|
|
|
|
|
1995 |
2000 |
2005 |
2010 |
2015 |
2020 |
Source: Bureau of Economic Analysis/Oxford Economics and Deloitte forecast.
at 200,000 per month and moderate infation suggest that the economy is fundamentally in good shape.4 With any luck, the economy will avoid having to jump out a window to escape.
Scenarios
Our scenarios are designed to demonstrate the different paths down which the Trump administration’s policies and congressional action might take the American economy. Foreign risks have not dissipated, and we’ve incorporated them into the scenarios. But for now, we view the greatest uncertainty in the US economy to be that generated within the nation’s borders.
The baseline (55 percent probability):
Consumer spending continues to grow. Fiscal stimulus from the tax bill and the budget agreement
pushes growth up in 2019 but is somewhat ofset by the impact of US tarifs and foreign response.
However, the US government comes to an arrangement with trading partners, and the tarifs are removed quickly. A small increase in trade restrictions adds to business costs in the medium term, but this is ofset by lower regulatory costs. A pickup in foreign growth helps to tamp down the dollar and increase demand for US exports, adding to demand. Budget debates continue to add to uncertainty as Congress slowly decides to lift the debt ceiling and pass appropriations for FY 2020, but no further shutdowns occur. As the impact of stimulus fades and the economy feels the efect of higher interest rates, growth slows below potential in 2020.
Recession (25 percent): The economy weakens in late 2019 and early 2020 from the impact of tarifs and the withdrawal of stimulus as the
3

vk.com/id446425943
United States Economic Forecast
additional spending from this year’s budget agreement goes away. With the economy already weak, a relatively small fnancial crisis pushes the economy into recession. The Fed and the European Central
Bank act to ease conditions, and the fnancial system recovers relatively rapidly. GDP falls in the second half of 2019 and the frst quarter of 2020, and then recovers.
Slower growth (10 percent): Business tax cuts induce little investment spending. Productivity growth becomes even more sluggish. Tarifs remain in place as the United States and its trading partners fail to agree on new global trade arrangements. The tarifs raise costs and disrupt supply chains. Businesses hold back on investments to restructure their supply chains because of
uncertainty about future policy. The higher spending authorization from the budget bill translates only slowly into additional federal outlays, reducing the budget bill’s impact on the economy. GDP growth falls to less than 1.5 percent over the forecast period, while the unemployment rate rises.
Productivity bonanza (10 percent):
Technological advances begin to lower corporate costs, as deregulation improves business confdence. Improved infrastructure boosts short-run demand and, in the long run, capacity and the productivity of private capital. Tarifs are short-lived and turn out to have a smaller impact than many economists expected. The economy grows
2.5 percent in 2019, with growth at 2.3 percent after 2021, while infation remains subdued.
4
vk.com/id446425943
2nd Quarter 2019
Sectors
Consumer spending
The household sector has provided an underpinning of steady growth for the US economy over the past few years. Consumer spending grew steadily even as business investment was weak, exports faced substantial headwinds, and housing stalled. But that’s unsurprising, since job growth has remained quite strong. Even with relatively low wage growth, those jobs have helped put money in consumers’ pockets, enabling households to continue to increase their spending. The continued steady (if modest) growth in house prices has helped, too, since houses are most households’ main form of wealth.
For all the daily speculation about how political developments might afect consumer choices when
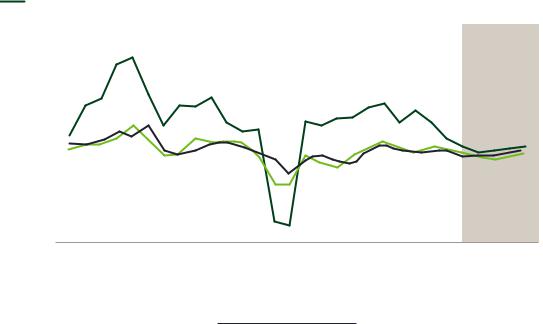
FIGURE 2
it comes to spending decisions, political noise seems to be just that—in the background—to consumers who seem focused on their own situations. As long as job growth holds up and house prices keep rising, consumer spending will likely remain strong. And the tax cut, while modest for most consumers, seems to have bolstered their confdence that they can safely spend. More importantly, the tax bill’s fscal stimulus has continued to tighten the job market. At some point, wages might begin to rise—and that could give consumer spending a further boost.
The medium term presents a diferent picture.
Many American consumers spent the 1990s and ’00s trying to maintain spending even as incomes stagnated. But now they are wiser (and older, which is another challenge, as many baby boomers
Consumer spending growth
Durables |
|
Services |
|
Nondurables |
|
|
16%
12%
8%
4%
0%
-4%
History Forecast
-8%
1995 |
2000 |
2005 |
2010 |
2015 |
2020 |
Source: Bureau of Economic Analysis/Oxford Economics and Deloitte forecast.
5

vk.com/id446425943
United States Economic Forecast
FIGURE 3
Consumer spending growth
|
|
History |
|
|
|
|
|
Forecast |
|
|
|
|
|
||
|
|
|
|
|
|
|
|
|
|
|
|
|
|
|
|
|
|
2013 |
|
2014 |
2015 |
2016 |
2017 |
2018 |
2019 |
|
2020 |
2021 |
2022 |
2023 |
2024 |
|
|
|
|
|
|
|
|
|
|
|
|
|
|
|
|
Real consumer |
1.5 |
|
2.9 |
3.7 |
2.7 |
2.5 |
2.6 |
2.2 |
|
1.9 |
1.8 |
1.7 |
1.9 |
2.2 |
|
spending |
|
|
|||||||||||||
|
|
|
|
|
|
|
|
|
|
|
|
|
|
||
Real consumer |
|
|
|
|
|
|
|
|
|
|
|
|
|
|
|
spending, |
6.1 |
|
7.2 |
7.6 |
5.5 |
6.8 |
5.5 |
3.7 |
|
2.7 |
2.1 |
2.3 |
2.5 |
2.7 |
|
durable goods |
|
|
|
|
|
|
|
|
|
|
|
|
|
|
|
Real consumer |
|
|
|
|
|
|
|
|
|
|
|
|
|
|
|
spending, |
1.8 |
|
2.6 |
3.4 |
2.7 |
2.1 |
2.8 |
2.5 |
|
1.8 |
1.5 |
1.3 |
1.6 |
1.8 |
|
nondurable |
|
|
|||||||||||||
|
|
|
|
|
|
|
|
|
|
|
|
|
|
||
goods |
|
|
|
|
|
|
|
|
|
|
|
|
|
|
|
Real consumer |
|
|
|
|
|
|
|
|
|
|
|
|
|
|
|
spending, |
0.6 |
|
2.4 |
3.2 |
2.3 |
2.0 |
2.1 |
2.3 |
|
1.7 |
1.8 |
1.7 |
1.9 |
2.2 |
|
services |
|
|
|
|
|
|
|
|
|
|
|
|
|
|
|
Net household |
|
|
|
|
|
|
|
|
|
|
|
|
|
|
|
wealth (US$ |
54 |
|
58 |
60 |
63 |
70 |
72 |
76 |
|
78 |
80 |
83 |
86 |
90 |
|
trillions) |
|
|
|
|
|
|
|
|
|
|
|
|
|
|
|
Unemployment |
7.4 |
|
6.2 |
5.3 |
4.9 |
4.4 |
3.9 |
3.6 |
|
3.9 |
3.9 |
3.9 |
3.9 |
3.8 |
|
rate |
|
|
|||||||||||||
|
|
|
|
|
|
|
|
|
|
|
|
|
|
||
Consumer price |
1.5 |
|
1.6 |
0.1 |
1.3 |
2.1 |
2.4 |
1.8 |
|
1.7 |
1.7 |
2.0 |
1.9 |
1.9 |
|
index |
|
|
|||||||||||||
|
|
|
|
|
|
|
|
|
|
|
|
|
|
||
|
|
|
|
|
|
|
|
|
|
|
|
|
|
|
|
Sources: Historical data: US government agencies and Oxford Economics.
Forecast: Deloitte, using the Oxford Global Economic Model.
face imminent retirement with inadequate savings5). That may constrain spending and require higher savings in the future. And although American households seem to face fewer obstacles in their pursuit of the good life than just a few years ago, rising income inequality could pose a signifcant challenge for the sector’s long-run health. For instance, low unemployment hasn’t alleviated many people’s economic insecurity: Four in 10 adults would be able to cover an unexpected US$400 expense only by borrowing money or selling something.6 For more about inequality, see
Income inequality in the United States: What do we know and what does it mean?,7
Deloitte’s most recent examination of the issue.
Housing
The housing market has weakened. In fact, we might have seen the best of the recovery from the sector’s destruction in the 2007–09 crash. Housing starts at the current level of around 1.2 to 1.3 million may be the best we can get. A simple model of the market based on demographics and reasonable
assumptions about the depreciation of the housing stock suggests that housing starts are likely to stay in the 1.1–1.2 million range. Starts are likely to fall as the economy weakens in the next year or two, and then gradually increase over the fve-year horizon. Even the most optimistic view, however, does not allow for housing starts to return to anything like the 2 million-plus level registered in the mid2000s. Housing remains a smaller share of the economy than it was before the Great Recession, and that’s to be expected. In some ways, it’s a relief to see the sector return to “normalcy.” But with slowing population growth, housing simply can’t be a major generator of growth for the US economy in the medium and long run.
Some folks are reacting to the slowing housing market with alarm, remembering something about how the last recession was connected to a housing problem.8 It’s certainly not a happy sight, especially for anybody in the home construction business. But a construction decline didn’t cause the last recession: Construction began subtracting from GDP growth in the fourth quarter of 2005, two years before the recession, and GDP growth
6

vk.com/id446425943
2nd Quarter 2019
FIGURE 4
Housing
Housing starts (left axis) |
Residential investment (right axis) |
|
|
||
Million |
|
|
|
|
Percent change |
2,200 |
|
|
|
|
15 |
2,000 |
|
|
|
|
10 |
1,800 |
|
|
|
|
5 |
1,600 |
|
|
|
|
0 |
|
|
|
|
|
|
1,400 |
|
|
|
|
-5 |
|
|
|
|
|
|
1,200 |
|
|
|
|
-10 |
|
|
|
|
|
|
1,000 |
|
|
|
|
|
|
|
|
|
|
-15 |
800 |
|
|
|
|
|
600 |
|
|
|
|
-20 |
|
|
|
History |
Forecast |
|
|
|
|
|
||
400 |
|
|
|
|
-25 |
|
|
|
|
|
|
1995 |
2000 |
2005 |
2010 |
2015 |
2020 |
Source: Bureau of Economic Analysis/Oxford Economics and Deloitte forecast.
FIGURE 5
Housing
|
|
History |
|
|
|
|
|
Forecast |
|
|
|
|
|
||
|
|
|
|
|
|
|
|
|
|
|
|
|
|
|
|
|
|
2013 |
|
2014 |
2015 |
2016 |
2017 |
2018 |
2019 |
|
2020 |
2021 |
2022 |
2023 |
2024 |
|
|
|
|
|
|
|
|
|
|
|
|
|
|
|
|
Real investment |
12.4 |
|
3.9 |
10.1 |
6.5 |
3.3 |
-0.3 |
-2.7 |
|
-2.8 |
2.2 |
3.6 |
1.2 |
1.0 |
|
in private housing |
|
|
|||||||||||||
|
|
|
|
|
|
|
|
|
|
|
|
|
|
||
Housing starts |
0.93 |
|
1.00 |
1.11 |
1.18 |
1.21 |
1.25 |
1.20 |
|
1.05 |
1.09 |
1.14 |
1.16 |
1.28 |
|
(millions) |
|
|
|||||||||||||
|
|
|
|
|
|
|
|
|
|
|
|
|
|
||
Stock of houses |
133.5 |
|
134.4 |
135.3 |
136.3 |
137.4 |
138.4 |
139.5 |
|
140.5 |
141.4 |
142.4 |
143.5 |
144.6 |
|
(millions) |
|
|
|||||||||||||
|
|
|
|
|
|
|
|
|
|
|
|
|
|
||
30-year fxed |
|
|
|
|
|
|
|
|
|
|
|
|
|
|
|
mortgage rate |
3.98 |
|
4.17 |
3.85 |
3.65 |
3.99 |
4.54 |
4.57 |
|
4.97 |
5.19 |
5.33 |
5.48 |
5.60 |
|
(percent) |
|
|
|
|
|
|
|
|
|
|
|
|
|
|
|
|
|
|
|
|
|
|
|
|
|
|
|
|
|
|
|
Sources: Historical data: US government agencies and Oxford Economics.
Forecast: Deloitte, using the Oxford Global Economic Model.
remained healthy. It was housing fnance that ultimately created the crisis, not housing itself. Today, housing accounts for just under 4.0 percent of GDP, down from about 6.0 percent in 2005. The sector simply isn’t large enough to cause a reces- sion—unless, once again, huge hidden bets on housing prices come to light.
Business investment
While businesses were still reckoning with the implications of the tax bill for investment, the US government introduced additional uncertainty in a radical shift in international trade policy.9 Nor has budget uncertainty disappeared with the
7
vk.com/id446425943
United States Economic Forecast
enactment of full appropriations for FY 2019. Policy uncertainty is one of the biggest potential roadblocks to strong investment spending.
FIGURE 6
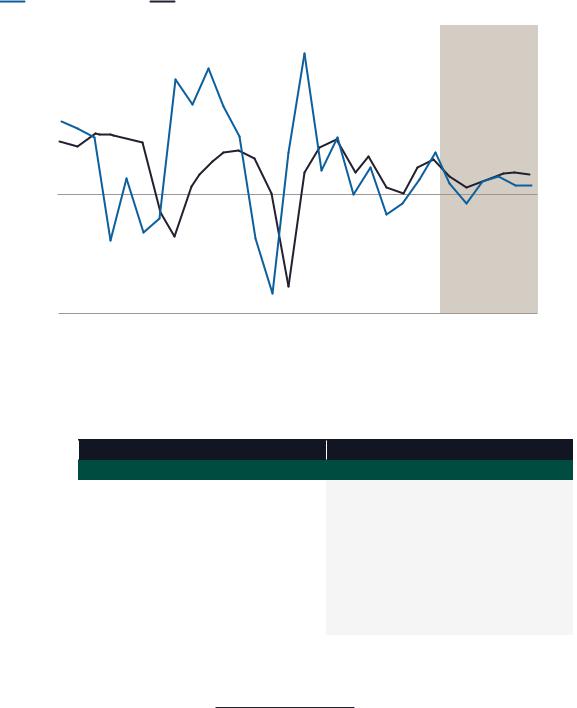
Business investment soared in the frst two quarters of 2018. However, it takes time for business decisions to result in new investment being put in place, suggesting that this investment spike was
Business sector
Corporate profts |
|
Real business investment |
|
|
|
30% |
|
|
|
|
|
20% |
|
|
|
|
|
10% |
|
|
|
|
|
0% |
|
|
|
|
|
-10% |
|
|
|
|
|
|
|
|
|
History |
Forecast |
-20% 1996 |
2001 |
2006 |
2011 |
2016 |
2021 |
Sources: Historical data: Bureau of Economic Analysis, sourced from Haver Analytics. Forecasts: Deloitte, using the Oxford Global Economic Model.
FIGURE 7
Business investment
|
|
History |
|
|
|
|
|
Forecast |
|
|
|
|
|
||
|
|
|
|
|
|
|
|
|
|
|
|
|
|
|
|
|
|
2013 |
|
2014 |
2015 |
2016 |
2017 |
2018 |
2019 |
|
2020 |
2021 |
2022 |
2023 |
2024 |
|
|
|
|
|
|
|
|
|
|
|
|
|
|
|
|
Real fxed |
|
|
|
|
|
|
|
|
|
|
|
|
|
|
|
business |
4.1 |
|
6.9 |
1.8 |
0.5 |
5.3 |
6.9 |
3.6 |
|
2.0 |
3.0 |
4.0 |
4.2 |
5.5 |
|
investment |
|
|
|
|
|
|
|
|
|
|
|
|
|
|
|
Real inventory |
|
|
|
|
|
|
|
|
|
|
|
|
|
|
|
investment (US$ |
108.7 |
|
86.6 |
129.0 |
23.4 |
22.5 |
45.0 |
83.9 |
|
31.8 |
21.8 |
8.5 |
36.1 |
34.7 |
|
billions) |
|
|
|
|
|
|
|
|
|
|
|
|
|
|
|
Employment cost |
1.9 |
|
2.1 |
2.1 |
2.2 |
2.5 |
2.8 |
2.8 |
|
2.1 |
2.2 |
2.5 |
2.7 |
2.8 |
|
index |
|
|
|||||||||||||
|
|
|
|
|
|
|
|
|
|
|
|
|
|
||
After-tax |
0.7 |
|
5.4 |
-2.9 |
-1.1 |
3.2 |
7.8 |
2.3 |
|
-0.8 |
2.8 |
3.7 |
2.2 |
3.7 |
|
corporate profts |
|
|
|||||||||||||
|
|
|
|
|
|
|
|
|
|
|
|
|
|
||
Yield on 10-year |
2.35 |
|
2.54 |
2.14 |
1.84 |
2.33 |
2.91 |
2.98 |
|
3.46 |
3.70 |
3.86 |
4.01 |
4.15 |
|
Treasury note |
|
|
|||||||||||||
|
|
|
|
|
|
|
|
|
|
|
|
|
|
||
|
|
|
|
|
|
|
|
|
|
|
|
|
|
|
|
Sources: Historical data: US government agencies and Oxford Economics.
Forecast: Deloitte, using the Oxford Global Economic Model.
8