

vk.com/id446425943
Global
Materials: Diversified Metals & Mining
26 November 2018
Rough diamond index down on lower melee prices
110%
105%
100%
95%
90%
85%
80%
75%
70%
Dec-12 Apr-13 Aug-13 Dec-13 Apr-14 Aug-14 Dec-14 Apr-15 |
Aug-15 Dec-15 Apr-16 Aug-16 Dec-16 Apr-17 Aug-17 Dec-17 Apr-18 Aug-18 |
Alrosa |
De Beers |
Source: Company data, Rapaport, Bloomberg, VTB Capital Research
Hong Kong sales slow down in 3Q18
|
30% |
|
|
20% |
|
|
10% |
|
Equities |
0% |
|
-10% |
||
|
||
|
-20% |
|
|
-30% |
|
|
-40% |
1Q15 |
2Q15 |
3Q15 |
4Q15 |
1Q16 |
2Q16 |
3Q16 |
4Q16 |
1Q17 |
2Q17 |
3Q17 |
4Q17 |
1Q18 |
2Q18 |
3Q18 |
Chow Tai Fook HK gem-set sales
Chow Tai Fook Mainland China gem-set sales
Luk Fook HK gem-set sales
Luk Fook Mainland China gem-set sales
Source: Company data, VTB Capital Research
US downstream demand growth slows
15%
sales |
|
|
|
|
|
|
|
|
|
|
|
7.4% |
7.7% |
8 |
7.3% |
10.8% |
8.7% |
8.9% |
|||
|
10% |
|
|
|
|
|
|
|
|
|
|
|
|
|
1%. |
9.4% |
|
10.7% |
|
||
watchesandjewellery YoYgrowth, |
0.1% 0.2% |
0.1% |
|
5%0. .1%1 |
|
1.8% |
|
6.2% |
3% |
9.7% |
|
8.5% 5.3% |
|||||||||
|
|
|
|
|
4.4% |
|
|
||||||||||||||
|
|
|
|
|
|
|
|
|
|
|
|
|
|
|
|
. |
|
|
|
|
|
|
|
|
|
|
|
|
|
|
|
|
|
|
|
|
8 |
|
|
|
|
|
|
|
5% |
0.8% |
1.4% |
2.5% |
1.8% |
4.7% |
2.7% |
|
4.5% |
|
|
|
|
|
|
|
|
|
|||
|
|
|
|
|
2.7% |
|
|
3.1% |
|
|
|
|
|
|
|
|
|
|
|
||
TotalUS |
0% |
0.2%- |
|
1.7% |
|
|
|
|
|
|
|
|
|
|
|
|
|
|
|
|
|
|
|
|
|
|
|
|
|
|
|
|
|
|
|
|
|
|
|
|
|||
|
-5% |
|
-1.1% |
|
|
|
|
|
|
|
|
|
|
|
|
|
|
|
|
|
|
|
|
|
- |
|
|
|
|
|
|
|
|
|
|
|
|
|
|
|
|
|
|
|
|
Jan-16 |
Apr-16 |
Jul-16 |
Oct-16 |
Jan-17 |
|
Apr-17 |
|
Jul-17 |
|
Oct-17 |
Jan-18 |
Apr-18 |
Jul-18 |
||||||
Source: IDEX, VTB Capital Research
Periodical
Diamonds Watch
December 2018
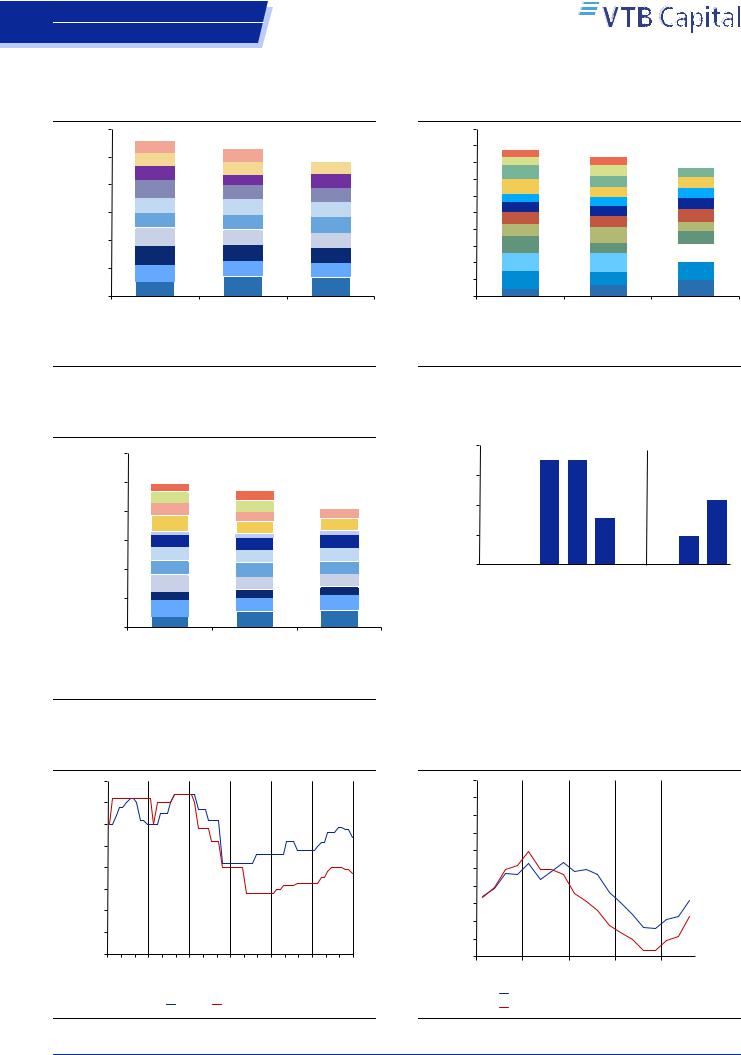
The weakness in the melee diamonds segment continued in November and culminated in De Beers and Alrosa each cutting their prices 10%. Despite better Indian mid-stream trade data in October and a midstream profitability improvement in November after the price cuts, whether the melee segment issues are going to clear up remains open to question, especially given the mixed downstream demand prints in 3Q18. However, we reiterate our positive view on the diamond market fundamentals overall, given the already contracting global production, and keep our focus on the upcoming holiday season of jewellery sales in Western countries.
The trends and news in November are as follows.
Weakness in melee rough diamonds culminates in 10% price cut. The combined sales of Alrosa and De Beers (Cycle 8) in October were up 3% YoY to USD 716mn, with Alrosa’s YoY growth outperforming slightly. At the same time, in November weakness in the melee diamond segment continued, pushing both companies to cut prices 10%. On our numbers, that had a 1-2pp negative effect on the overall rough index (now up 2.5-3.1% YTD respectively by De Beers and Alrosa). A 6% YoY decrease in the De Beers Cycle 9 sales in November largely reflects weakness in this market segment.
India diamond trade recovers in October after weak September. Net rough diamond imports were up 16% YoY in value, with a sharp recovery in the average price (up 18% YoY vs. a 20% decline YoY in September). Moreover, net polished diamonds exports were up 23% YoY in value (down 11% YoY in September).
Mid-stream margin improves after price cuts. Polished prices were little changed MoM in November, based on the Rapaport and PolishedPriced.com indices, though prices for stones above 1ct firmed. Based on the average market indices for roughs and polished stones, mid-stream profitability might have improved after melee rough price cuts in November (Figure 16).
Downstream demand mixed in 3Q18. With US diamond jewellery retailers Tiffany and Signet still to report their 3Q18 numbers this week, we note that the 3Q18 data for Asian retailers is mixed. Decelerating Hong Kong sales were partly offset by better mainland demand (see chart left). Indian Titan reported a strong 32% YoY rise in 3Q18 sales, which might be a one-off due to the weaker INR. US jewellery sales growth in September unexpectedly slowed to 5% YoY, from 9-11% YoY so far in 2018.
What is up at the end of November and next month? US diamond jewellery retailers’ 3Q18 numbers, Alrosa and De Beers sales, preliminary results of holiday sales of jewellery in Western countries and sentiment around that.
Dmitry Glushakov, CFA, Equities Analyst
+7 495 663 47 96 // dmitry.glushakov@vtbcapital.com
Boris Sinitsyn, Equities Analyst
+7 495 663 46 70 // boris.sinitsyn@vtbcapital.com
Nikanor Khalin, Equities Analyst
+7 495 660 42 45 // nikanor.khalin@vtbcapital.com
Prices cited in the body of this report are as of the last close before, or the close on, 23 Nov 2018 (except where indicated otherwise). VTB Capital analysts update their recommendations periodically as required. This research report was prepared by the analyst(s) named above who is(are) associated with JSC VTB Capital and is distributed by JSC VTB Capital and VTB Capital PLC and their non-U.S. affiliates outside the United States. This VTB Capital research report is distributed to investors located within United States by Xtellus Capital Partners, Inc. (“Xtellus”) as a “third-party research report” as defined in Rule 2241(a)(14) and Rule 2242(a)(17) of the U.S. Financial Industry Regulatory Authority. Please refer to the Disclosures section of this report for other important disclosures, including the analyst certification and information required by regulation.

vk.com/id446425943
Global
Materials: Diversified Metals & Mining
Diamonds Watch
Previous month’s headlines
Figure 1: Previous month’s diamond industry news & reports headlines
Alrosa
08-Nov |
3Q18 earnings; slightly better results, lower volumes to be offset by prices |
09-Nov |
Alrosa – 3Q18 earnings; slightly better results, lower volumes to be offset by prices |
09-Nov |
Alrosa – 3Q18 conference call highlights – and CFO gives interview – low small stones demand in |
|
3Q18 was seasonal and is to recover in 1Q19 – the 2019 sales mix is to worsen – production and |
|
capex guidance for 2019 maintained |
12-Nov |
Alrosa – October sales at USD 243mn – down 28% YoY – demand for smaller stones continued to |
|
remain seasonally weak – but we expect it to normalise towards the year-end – marginally |
|
negative |
12-Nov |
3Q18 IFRS review |
13-Nov |
Alrosa – Melee diamond market weakness spreads as De Beers cuts prices |
14-Nov |
Alrosa – 10% cut in prices for smaller stones in November – 4% downside risk to 4Q18 EBITDA – |
|
marginally negative – 2019 depends on winter diamond jewellery holiday season sales in western |
|
countries |
15-Nov |
Alrosa – company considering purchasing new deposit in Angola – in line with long-term plan – |
|
project at an early stage – neutral |
16-Nov |
Alrosa – sells its share of the Botswanan asset at a nominal price – neutral |
Upstream (Mining)
02-Nov |
GEM Diamonds has reported a 3% YoY rise in rough diamond sales volumes in 3Q18 |
14-Nov |
Lucara rough diamonds output reached 127kct in 3Q18, doubling YoY |
14-Nov |
Mountain Province 3Q18 rough diamonds output was flat YoY |
14-Nov |
Kimberley Process reform might include an extension of the definition of conflict diamonds |
|
(marginally +ve Alrosa) |
15-Nov |
The Central African Republic has developed new strategy for responsible mining in the country |
16-Nov |
Mountain Province has sold USD 17.7mn worth of rough diamonds at its Cycle 9, down 7% YoY |
|
(+ve Alrosa) |
20-Nov |
Zimbabwe expects 2019 rough diamonds output to reach 4.5mnct (marginally -ve Alrosa) |
20-Nov |
De Beers has reported USD 440mn of provisional rough diamonds sales at Cycle 9 |
21-Nov |
AGD Diamonds mined 4mnct YTD as of last week |
Midstream (Cutting and polishing) |
|
14-Nov |
Sarine Technology 9mo18 polished diamonds sales revenue gained 20% YoY |
15-Nov |
Asian Star, a public Indian diamonds polisher, has reported higher QoQ and YoY EBITDA margins |
|
of 5.1% |
19-Nov |
India polished diamonds net exports gained 23% in value YoY in October |
Downstream (Jewellery) |
|
06-Nov |
Alrosa is to join De Beers blockchain diamond tracking system Tracr |
12-Nov |
Richemont Jewellery Maisons segment sales gained 9% YoY in Apr-Sep 2018 (+ve Alrosa) |
12-Nov |
Titan has reported 32% YoY growth in jewellery sales in 3Q18 (+ve Alrosa) |
15-Nov |
Macy's has upgraded its FY18 comparable sales growth guidance to 2.3-2.5% (from 2.1-2.5%) |
|
(+ve Alrosa) |
16-Nov |
Graff Diamonds has revealed a collection cut and polished from the 1,109ct rough diamond |
|
Lesedi la Rona |
16-Nov |
A Bulgari ring with 8.08 fancy-vivid-blue diamonds will be the top lot at next month's Christie's |
|
New York auction |
16-Nov |
Rio Tinto has tendered 63 rare pink, red and violet diamonds from the Argyle mine |
22-Nov |
US jewellery and watches sales gained 5.3% YoY in September |
Source: VTB Capital Research
26 November 2018 |
2 |

vk.com/id446425943 |
Diamonds Watch |
Global |
|
Materials: Diversified Metals & Mining |
|
|
Calendar |
|
At the end of November and in December, we focus on the 3Q18 sales and earnings |
|
from US diamond jewellery retailers Signet and Tiffany. We also focus on the November |
|
and early December sales results from Alrosa and De Beers, respectively, to see |
|
whether weakness in demand and pricing for the melee diamonds segment remains. As |
|
the jewellery holiday sales season has kicked off, we shall be looking closely at the |
|
preliminary results for the broader market, with diamond-related numbers to be |
|
announced by Signet and Tiffany in the second week of January next year. |
Figure 2: Diamond industry events calendar
Month |
Alrosa |
Upstream |
Mid-stream |
Downstream (jewellery retail) |
||||
November |
|
|
|
|
|
|
28 November |
Tiffany 3Q18 results |
|
|
|
|
|
|
|
|
|
|
10 December |
Alrosa November |
18 December |
De Beers Sales |
12-19 |
November |
6 December |
Signet 3Q18 results |
|
|
sales results |
|
Cycle 10 results |
December |
Indian diamond |
|
|
December |
|
|
|
|
|
trade statistics |
|
|
|
5-12 December |
Alrosa December |
|
|
|
|
5-12 December |
Alrosa sale period |
|
|
sale period |
|
|
|
|
|
|
January |
2nd week of Jan |
Alrosa December |
2nd week of |
De Beers Sales |
|
|
2nd week of Jan |
Tiffany & Signet holiday |
|
|
sales results |
Jan |
Cycle 1 (2019) |
|
|
|
season sales |
|
|
|
|
results |
|
|
|
|
Source: Company data, Rapaport, VTB Capital Research |
|
|
|
|
|
|
||
26 November 2018 |
3 |
vk.com/id446425943 |
Diamonds Watch |
Global |
|
Materials: Diversified Metals & Mining |
|
|
Upstream (Mining) |
Figure 3: De Beers sales flat YoY in 10mo18
USDmn |
6,000 |
5,587 |
|
|
|
5,296 |
|
0% YoY |
|
|
||
5,000 |
476 |
-5% YoY |
|
|
|
|||||||
|
|
|
422 |
|
|
|
450 |
|
|
4,845 |
||
|
|
|
|
|
|
|
|
|
|
|||
sales, |
4,000 |
639 |
|
|
|
466 |
|
10mo18 |
440 |
|||
|
|
|
494 |
|
|
|
370 |
|
|
482 |
||
|
|
|
|
|
|
|
|
|
|
|||
diamond |
|
|
|
|
|
|
507 |
|
|
503 |
||
3,000 |
528 |
|
|
|
572 |
|
|
533 |
||||
|
|
|
|
|
|
|
||||||
|
|
564 |
|
|
|
541 |
|
|
581 |
|||
|
|
|
|
|
|
|
|
|||||
Beers |
2,000 |
636 |
|
|
|
522 |
|
|
554 |
|||
|
666 |
|
|
|
586 |
|
|
524 |
||||
|
|
|
|
|
|
|
|
|||||
De |
1,000 |
617 |
|
|
|
553 |
|
|
563 |
|||
|
|
|
|
|
|
|
|
|
|
|
||
Total |
0 |
545 |
|
|
|
729 |
|
|
665 |
|||
2016 |
|
|
|
2017 |
|
|
2018 |
|||||
|
|
|
|
|
|
|
|
|
|
|
|
|
|
|
Cycle 1 |
|
Cycle 2 |
|
|
Cycle 3 |
|
|
Cycle 4 |
|
Cycle 5 |
|
|
|
|
|
|
|
||||||
|
|
|
|
|
|
|
||||||
|
|
Cycle 6 |
|
Cycle 7 |
|
|
Cycle 8 |
|
|
Cycle 9 |
|
Cycle 10 |
|
|
|
|
|
|
|
|
|||||
|
|
|
|
|
|
|
|
|||||
Source: Company data, VTB Capital Research
Figure 4: Alrosa sales up 6% YoY in 10mo18
5,000
USDmn |
4,500 |
4,370 |
-5% YoY |
|
|
|
|
|
|
|
|
|
||||
431 |
|
320 |
10mo18 |
234 |
||||||||||||
|
|
173 |
|
|
|
|
4,157 |
|
|
|
|
|
|
|||
|
4,000 |
246 |
|
|
|
|
228 |
+6% YoY |
3,822 |
|||||||
sales, |
3,500 |
243 |
|
|
|
|
327 |
|
|
|
332 |
|||||
3,000 |
|
|
|
|
256 |
|
|
|
334 |
|||||||
|
|
435 |
|
|
|
|
306 |
|
|
|
283 |
|||||
|
|
|
|
|
|
|
|
|
|
|
||||||
diamond |
2,500 |
300 |
|
|
|
|
286 |
|
|
|
384 |
|||||
490 |
|
|
|
|
|
|
|
|||||||||
1,500 |
|
|
|
|
310 |
|
|
|
|
|
|
|||||
|
2,000 |
378 |
|
|
|
|
354 |
|
|
|
278 |
|||||
|
352 |
|
|
|
|
468 |
|
|
|
396 |
||||||
|
|
|
|
|
|
|
|
|
|
|
||||||
rough |
1,000 |
546 |
|
|
|
|
554 |
|
|
|
550 |
|||||
|
|
|
|
|
|
|
|
|
|
|||||||
|
|
|
|
|
|
|
|
533 |
||||||||
|
500 |
552 |
|
|
|
|
390 |
|
|
|
||||||
Alrosa |
|
|
|
|
|
|
|
2018 |
||||||||
|
2016 |
|
|
|
2017 |
|
|
|
||||||||
|
0 |
224 |
|
|
|
|
358 |
|
|
|
499 |
|||||
|
|
|
|
|
|
|
|
|
|
|
|
|
|
|
|
|
|
|
|
Jan |
|
Feb |
|
Mar |
|
|
Apr |
|
|
May |
|
|
June |
|
|
|
|
|
|
|
|
|||||||||
|
|
|
|
|
|
|
|
|||||||||
|
|
|
July |
|
Aug |
|
Sep |
|
|
Oct |
|
|
Nov |
|
|
Dec |
|
|
|
|
|
|
|
|
|
|
|
||||||
|
|
|
|
|
|
|
|
|
|
|
||||||
Source: Company data, VTB Capital Research
Figure 5: Alrosa + De Beers sales up 3% YoY in 10mo18
monthly |
12,000 |
|
|
|
|
|
|
|
|
|
|
|
|
|
|
||
10,000 |
|
9,957 |
|
-5% YoY |
9,453 |
|
|
|
|
|
|
||||||
BeersDecalendar USDmnsales, |
|
595 |
|
|
|
|
|
|
|
|
|||||||
4,000 |
|
|
|
990 |
+3% YoY |
832 |
|
||||||||||
|
988 |
|
|
|
|||||||||||||
|
|
|
|
|
722 |
|
|
678 |
8,227 |
||||||||
|
8,000 |
|
925 |
|
|
786 |
in 10mo18 |
716 |
|
||||||||
|
|
|
|
|
1,074 |
|
|
697 |
|
|
|
835 |
|
||||
|
|
|
|
|
243 |
|
|
813 |
|
|
|
283 |
|
||||
|
6,000 |
|
|
|
256 |
|
|
|
|
||||||||
|
|
828 |
|
|
858 |
|
|
|
867 |
|
|||||||
|
|
|
|
|
942 |
|
|
895 |
|
|
|
965 |
|
||||
+ |
|
|
|
|
1,156 |
|
|
896 |
|
|
|
920 |
|
||||
Alrosa |
|
|
|
|
|
|
|
|
|
550 |
|
||||||
2,000 |
|
546 |
|
|
554 |
|
|
|
|
||||||||
|
|
|
|
|
|
|
|
||||||||||
|
|
|
|
|
|
|
1,096 |
||||||||||
|
|
|
|
943 |
|
|
|
||||||||||
|
|
|
|
|
1,169 |
|
|
|
|
|
|||||||
|
|
|
|
|
|
|
|
|
|
|
|
|
|
|
|||
|
0 |
|
769 |
|
|
1,087 |
|
|
|
1,164 |
|||||||
|
|
2016 |
|
|
2017 |
|
|
|
2018 |
|
|
||||||
|
|
|
|
|
|
|
|
|
|
|
|
||||||
|
|
|
Jan |
|
|
Feb |
|
Mar |
|
Apr |
|
|
May |
|
|
June |
|
|
|
|
|
|
|
|
|
||||||||||
|
|
|
|
|
|
|
|
||||||||||
|
|
|
July |
|
|
|
Aug |
|
Sep |
|
Oct |
|
|
Nov |
|
|
Dec |
|
|
|
|
|
|
|
|
|
|
|
|
||||||
|
|
|
|
|
|
|
|
|
|
|
|
||||||
Source: Company data, VTB Capital Research
Figure 7: Alrosa & De Beers price index estimates
110%
105%
100%
95%
90%
85%
80%
75%
70%
Dec-12 Apr-13 Aug-13 Dec-13 Apr-14 Aug-14 Dec-14 Apr-15 |
Aug-15 Dec-15 Apr-16 Aug-16 Dec-16 Apr-17 Aug-17 Dec-17 Apr-18 Aug-18 |
Alrosa |
De Beers |
Source: Company data, Rapaport, Bloomberg, VTB Capital Research
Figure 6: Diamond prices growth softens in 2H18
8.0% |
|
|
|
|
|
7.0% 7.0% |
|
|
|
|
|
|
|
|
|
|
|
|
growth |
|
|
|
|
|
|
|
|
|
|
|
|
|
|
|
|
||
|
|
|
|
|
|
|
|
|
|
|
6.0% |
|
|
|
||||
5.0% |
|
|
|
|
|
|
|
|
|
|
|
|
|
|
||||
6.0% |
|
|
|
|
|
|
|
|
|
|
4.3% |
|
||||||
index |
|
|
|
|
|
|
|
|
|
|
|
|
|
|
|
|||
|
|
|
|
|
|
|
|
|
|
|
||||||||
4.0% |
|
|
|
|
|
|
|
3.1% |
|
|
|
|
|
|
|
|
|
|
|
|
|
|
|
|
|
|
2.5% |
|
|
|
|
|
|
|
|||
Price |
|
|
|
|
|
|
|
|
|
|
|
1.9% |
|
|
||||
|
|
|
|
|
|
|
|
|
|
|
|
|
|
|
|
|||
2.0% |
|
|
|
|
|
|
|
|
|
|
|
|
|
|
|
|
|
|
0.0% |
|
|
|
|
0.0% |
|
|
|
|
|
|
|
|
|
|
|
|
|
|
|
VTBC |
Stornoway |
Gahcho Kue |
Petra |
Alrosa |
|
De Beers |
|
|
VTBC |
Rapaport 1-ct benchmark |
Polished diamond overall index |
|
||||
|
|
|
|
|
|
|
||||||||||||
|
|
2018F |
|
|
YTD |
|
|
|
|
|
2018F |
YTD |
|
|||||
|
|
|
|
|
|
Rough |
|
|
|
|
|
|
Polished |
|
||||
|
|
|
|
|
|
|
|
|
|
|
|
|
|
|
|
|
|
|
Source: Bloomberg, Company data, Rapaport, VTB Capital Research
Figure 8: Average realised price of Alrosa + De Beers recovers due to mix normalisation
250
240 |
|
2015 |
2016 |
2018 |
2014 |
|
|||
230 |
|
|
2017 |
|
|
|
|
|
|
220 |
|
|
|
|
210 |
|
|
|
|
USD/ct |
|
|
|
|
200 |
|
|
|
|
190 |
|
|
|
|
180 |
|
|
|
|
170 |
|
|
|
|
160 |
|
|
|
|
150 |
1Q14 2Q14 3Q14 4Q14 1Q15 2Q15 3Q15 4Q15 1Q16 2Q16 3Q16 4Q16 1Q17 2Q17 3Q17 4Q17 1Q18 2Q18 3Q18 |
|||
|
||||
12M MA mix index since 2014
12M MA of average realised price
Source: Company data, VTB Capital Research
26 November 2018 |
4 |
vk.com/id446425943 |
Diamonds Watch |
|
|
Global |
|
|
Materials: Diversified Metals & Mining |
|
|
|
Upstream (Mining) |
|
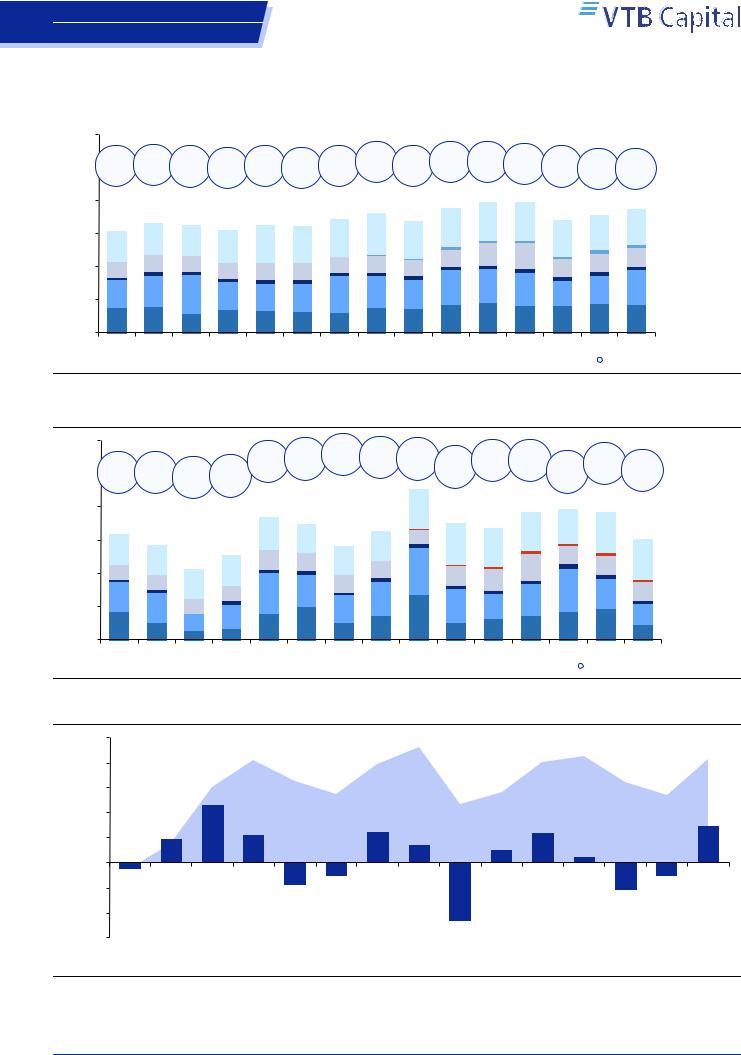
Figure 9: Quarterly diamond output |
|
mn cts
60.0 |
|
|
|
|
|
|
|
|
|
|
|
|
|
|
|
|
|
|
|
|
|
|
|
|
100% |
50.0 |
5% |
7% |
1% |
-4% |
5% |
-3% |
5% |
17% |
4% |
16% |
16% |
|
9% |
1% |
-5% |
-5% 0% |
|||||||||
|
|
|
|
||||||||||||||||||||||
40.0 |
|
|
|
|
|
|
|
|
|
|
|
|
|
|
36.1 |
|
|
37.5 |
39.5 |
|
39.5 |
|
35.7 |
37.4 |
-100% |
|
|
|
|
|
|
|
|
|
|
|
|
|
34.2 |
33.7 |
|
|
|
33.9 |
|||||||
|
|
|
33.2 |
32.5 |
|
|
|
32.4 |
32.2 |
|
|
|
|
|
|||||||||||
|
30.8 |
30.9 |
|
|
|
|
|
|
|
|
|||||||||||||||
|
|
|
|
|
|
|
|
|
|
|
|
|
|
|
|
|
|
|
|
||||||
30.0 |
|
|
|
|
|
|
|
|
|
|
|
|
|
|
|
|
|
|
|
|
|
|
|
|
-6%200%YoY |
|
|
|
|
|
|
|
|
|
|
|
|
|
|
|
|
|
|
|
|
|
|
|
|
|
0% YoY |
20.0 |
|
|
|
|
|
|
|
|
|
|
|
|
|
|
|
|
|
|
|
|
|
|
|
|
-17% YoY |
|
|
|
|
|
|
|
|
|
|
|
|
|
|
|
|
|
|
|
|
|
|
|
|
-300% |
|
|
|
|
|
|
|
|
|
|
|
|
|
|
|
|
|
|
|
|
|
|
|
|
|
|
1% YoY |
10.0 |
|
|
|
|
|
|
|
|
|
|
|
|
|
|
|
|
|
|
|
|
|
|
|
|
2% YoY |
|
|
|
|
|
|
|
|
|
|
|
|
|
|
|
|
|
|
|
|
|
|
|
|
-400% |
|
|
|
|
|
|
|
|
|
|
|
|
|
|
|
|
|
|
|
|
|
|
|
|
|
|
-5% YoY |
0.0 |
1Q15 |
2Q15 |
|
3Q15 |
4Q15 |
1Q16 |
2Q16 |
3Q16 |
4Q16 |
|
1Q17 |
2Q17 |
3Q17 |
4Q17 |
1Q18 |
2Q18 |
3Q18 |
-500% |
|||||||
|
|
|
|
||||||||||||||||||||||
|
|
|
De Beers |
|
Alrosa |
|
|
Petra |
|
|
Rio Tinto (Diavik at 100%) |
|
Mountain Province |
|
Other (estimated) |
YoY growth |
|
||||||||
|
|
|
|
|
|
|
|
|
|||||||||||||||||
|
|
|
|
|
|
|
|
|
|||||||||||||||||
Source: Company data, Kimberley Process, VTB Capital Research
Figure 10: Quarterly diamond sales
mn cts
60.0 |
|
|
|
|
|
|
|
|
|
|
|
|
|
|
|
|
|
|
|
|
|
|
|
|
|
|
|
|
|
|
|
|
|
|
|
|
15% |
22% |
34% |
28% |
23% |
1% |
19% |
17% |
-13% |
9% |
-10% |
0% |
|||||
50.0 |
-16% |
-16% |
-30% |
-26% |
|
|
|
|
|
45.2 |
||||||||||||||||
|
|
|
|
|
|
|
|
|
|
|
|
|
|
|||||||||||||
|
|
|
|
|
|
|
|
|
|
|
|
|
|
|
|
|
|
|
|
|
||||||
40.0 |
|
|
|
|
|
|
|
|
|
36.7 |
34.8 |
|
|
|
|
|
35.0 |
|
|
38.4 |
39.2 |
38.2 |
|
-100% |
||
|
|
|
|
|
|
|
|
|
|
32.7 |
|
33.5 |
|
|
|
|
||||||||||
|
31.8 |
|
|
|
|
|
|
|
|
|
|
|
|
|
|
|
|
|||||||||
|
28.5 |
|
|
|
|
|
|
|
|
|
28.2 |
|
|
|
|
|
30.1 |
|
||||||||
|
|
|
|
|
|
|
|
|
|
|
|
|
|
|
|
|
|
|
|
|
|
|
-200% |
|||
30.0 |
|
|
|
|
|
25.5 |
|
|
|
|
|
|
|
|
|
|
|
|
|
|
|
|||||
|
|
|
|
|
|
|
|
|
|
|
|
|
|
|
|
|
|
|
|
|
|
|||||
|
|
|
|
|
|
|
|
|
|
|
|
|
|
|
|
|
|
|
|
|
|
4% YoY |
||||
|
|
|
|
|
21.1 |
|
|
|
|
|
|
|
|
|
|
|
|
|
|
|
|
|
|
|
||
|
|
|
|
|
|
|
|
|
|
|
|
|
|
|
|
|
|
|
|
|
|
|
|
-1% YoY |
||
20.0 |
|
|
|
|
|
|
|
|
|
|
|
|
|
|
|
|
|
|
|
|
|
|
|
|
|
|
|
|
|
|
|
|
|
|
|
|
|
|
|
|
|
|
|
|
|
|
|
|
|
|
|
-300% |
|
|
|
|
|
|
|
|
|
|
|
|
|
|
|
|
|
|
|
|
|
|
|
|
|
|
|
-17% YoY |
|
|
|
|
|
|
|
|
|
|
|
|
|
|
|
|
|
|
|
|
|
|
|
|
|
|
-12% YoY |
10.0 |
|
|
|
|
|
|
|
|
|
|
|
|
|
|
|
|
|
|
|
|
|
|
|
|
|
-400% |
|
|
|
|
|
|
|
|
|
|
|
|
|
|
|
|
|
|
|
|
|
|
|
|
|
|
-11% YoY |
0.0 |
|
|
|
|
|
|
|
|
|
|
|
|
|
|
|
|
|
|
|
|
|
|
|
|
|
-29% YoY |
1Q15 |
2Q15 |
|
3Q15 |
4Q15 |
1Q16 |
2Q16 |
3Q16 |
4Q16 |
1Q17 |
2Q17 |
3Q17 |
4Q17 |
1Q18 |
2Q18 |
3Q18 |
-500% |
||||||||||
|
|
|
||||||||||||||||||||||||
|
|
|
De Beers |
|
Alrosa |
|
|
Petra |
|
|
Rio Tinto (estimated) |
|
|
Mountain Province |
|
Other (estimated) |
YoY growth |
|
||||||||
|
|
|
|
|
|
|
|
|
||||||||||||||||||
|
|
|
|
|
|
|
|
|
||||||||||||||||||
Source: Company data, Kimberley Process, VTB Capital Research
Figure 11: Changes in miners’ inventories since 4Q14
mn cts
25.0 |
|
|
|
|
Accumulated inventory since 4Q14 20.7mncts |
|
|
|
|
|
|
|
|
||
20.0 |
|
|
|
|
|
|
|
15.0 |
|
11.5 |
|
|
|
|
|
|
|
|
|
|
|
|
|
10.0 |
|
5.4 |
|
6.0 |
|
6.0 |
7.4 |
|
4.7 |
|
|
|
|||
5.0 |
|
|
3.4 |
2.5 |
|
|
|
|
|
|
1.1 |
|
|||
|
|
|
|
|
|
|
|
0.0 |
|
|
|
|
|
|
|
-5.0 |
-1.0 |
|
|
-2.6 |
|
-2.5 |
|
|
|
-4.3 |
|
|
|||
|
|
|
|
|
-5.2 |
|
|
|
|
|
|
|
|
|
|
-10.0 |
|
|
|
|
|
|
|
-15.0 |
|
|
|
|
|
|
|
|
|
|
|
-11.5 |
|
|
|
|
|
|
|
|
|
|
|
|
|
|
|
|
|
|
|
|
|
|
|
|
|
1Q15 |
2Q15 |
3Q15 |
4Q15 |
1Q16 |
2Q16 |
3Q16 |
4Q16 |
1Q17 |
2Q17 |
3Q17 |
4Q17 |
1Q18 |
2Q18 |
3Q18 |
||||
|
|
|
|
|
Accumulated stock since 4Q14 |
|
|
Change in Miners' inventories |
|
|
|
|
|
|||||
|
|
|
|
|
|
|
|
|
|
|
||||||||
|
|
|
|
|
|
|
|
|
|
|
||||||||
Source: Company data, Kimberley Process, VTB Capital Research
26 November 2018 |
5 |