

vk.com/id446425943
Russia
Equities
5 December 2018
RTS index surprises vs consensus
5% |
|
|
|
|
|
|
4% |
|
|
|
|
|
|
3% |
|
|
|
|
|
|
2% |
|
|
|
|
|
|
1% |
|
|
|
|
|
|
0% |
|
|
|
|
|
|
-1% |
|
|
Sales |
EBITDA |
|
|
|
|
|
|
|||
-2% |
|
|
|
|
|
|
1Q17 |
2Q17 |
3Q17 |
4Q17 |
1Q18 |
2Q18 |
3Q18 |
Source: Company data, Bloomberg, Interfax, VTB Capital Research
EBITDA surprises distribution
|
100% |
|
|
|
10% |
|
|
|
|
|
|
|
|
|
|
|
|
|
|
||||
|
|
|
|
|
|
18% |
21% |
18% |
26% |
|
|
|
|
|
|
||||||||
|
|
|
|
|
|
|
|
35% |
|||||||||||||||
|
80% |
|
|
|
|
|
|
|
|
|
|
|
|
||||||||||
|
|
|
|
23% |
|
|
12% |
|
|
||||||||||||||
|
|
|
|
|
|
|
|
|
18% |
|
|
|
|
|
|
|
|||||||
|
|
|
|
|
|
24% |
|
|
|
|
|
|
|
|
|||||||||
|
|
|
|
|
|
|
|
|
|
|
|
|
|
|
|
|
|
|
|||||
|
60% |
|
|
|
|
|
|
|
|
|
|
|
31% |
|
26% |
||||||||
Strategy |
40% |
24% |
37% |
36% |
39% |
|
|
||||||||||||||||
|
|
|
|
|
|
|
|
|
|
|
|
|
|||||||||||
|
|
|
|
|
|
|
|
|
|
|
|
|
|
|
|
|
|
||||||
|
|
|
|
|
|
|
|
|
|
|
|
|
|
|
|
|
|
|
|||||
|
|
|
|
|
|
15% |
7% |
8% |
9% |
|
|
34% |
|
19% |
|||||||||
|
20% |
|
|
|
|
|
|
|
|
||||||||||||||
|
|
|
|
|
|
|
|
|
|
|
|
13% |
|||||||||||
Equities |
|
|
|
|
|
18% |
23% |
18% |
21% |
3% |
|
||||||||||||
0% |
|
|
|
|
|
|
|
|
|
|
|
6% |
|
6% |
|||||||||
|
|
|
|
|
|
|
|
|
|
|
|
|
|||||||||||
|
2Q17 |
3Q17 |
|
4Q17 |
1Q18 |
2Q18 |
3Q18 |
||||||||||||||||
|
|
|
|
|
|
|
|||||||||||||||||
|
|
|
|
<=-5% |
|
-5% to -2% |
|
-2% to +2% |
|
|
|
|
+2% to +5% |
|
|
|
>+5% |
||||||
|
|
|
|
|
|
|
|
|
|||||||||||||||
|
|
|
|
|
|
|
|
|
|||||||||||||||
|
|
|
|
|
|
|
|
|
|
|
|
|
|
|
|
|
|||||||
|
Source: Company Data, Bloomberg, Interfax, VTB Capital Research |
||||||||||||||||||||||
|
Net Income surprise distribution |
|
|
|
|
|
|
||||||||||||||||
|
100% |
|
|
|
|
|
|
|
|
|
|
|
|
|
|
|
|
|
|
||||
|
80% |
43% |
|
36% |
28% |
|
|
44% |
|||||||||||||||
|
46% |
|
|
|
|
|
|
|
|||||||||||||||
|
|
|
|
|
|
|
|
57% |
|
||||||||||||||
|
|
|
|
|
|
|
|
|
|
|
|
|
|
|
|
|
|
|
|
|
|
|
|
|
60% |
14% |
|
12% |
28% |
|
|
|
|
|
|
|
|||||||||||
|
40% |
12% |
|
|
|
|
|
|
|
|
|
15% |
|||||||||||
|
|
|
|
24% |
14% |
|
|
|
|
|
|
|
|||||||||||
|
14% |
|
13% |
|
15% |
||||||||||||||||||
|
|
|
|
|
|
19% |
|
|
7% |
|
|
|
|||||||||||
|
|
|
|
|
|
|
|
|
|
|
|
|
|
||||||||||
|
20% |
|
|
|
|
|
|
|
7% |
|
11% |
||||||||||||
|
|
|
|
|
|
|
|
|
|
|
|
|
|||||||||||
|
29% |
|
27% |
24% |
|
|
|||||||||||||||||
|
|
|
|
|
|
19% |
20% |
|
15% |
||||||||||||||
|
0% |
|
|
|
|
|
|
|
|
|
|
|
|
|
|||||||||
|
2Q17 |
3Q17 |
|
4Q17 |
1Q18 |
2Q18 |
3Q18 |
||||||||||||||||
|
|
|
|
|
|
|
|||||||||||||||||
|
|
|
<=-5% |
|
-5% to -2% |
|
-2% to +2% |
|
|
+2% to +5% |
|
|
>+5% |
||||||||||
|
|
|
|
|
|
||||||||||||||||||
|
|
|
|
|
|
||||||||||||||||||
Source: Company Data, Bloomberg, Interfax, VTB Capital Research
Real-time earnings tables are available online in the Earnings section of VTB Capital Research portal.
Periodical
Earnings Watch
3Q18 earnings review
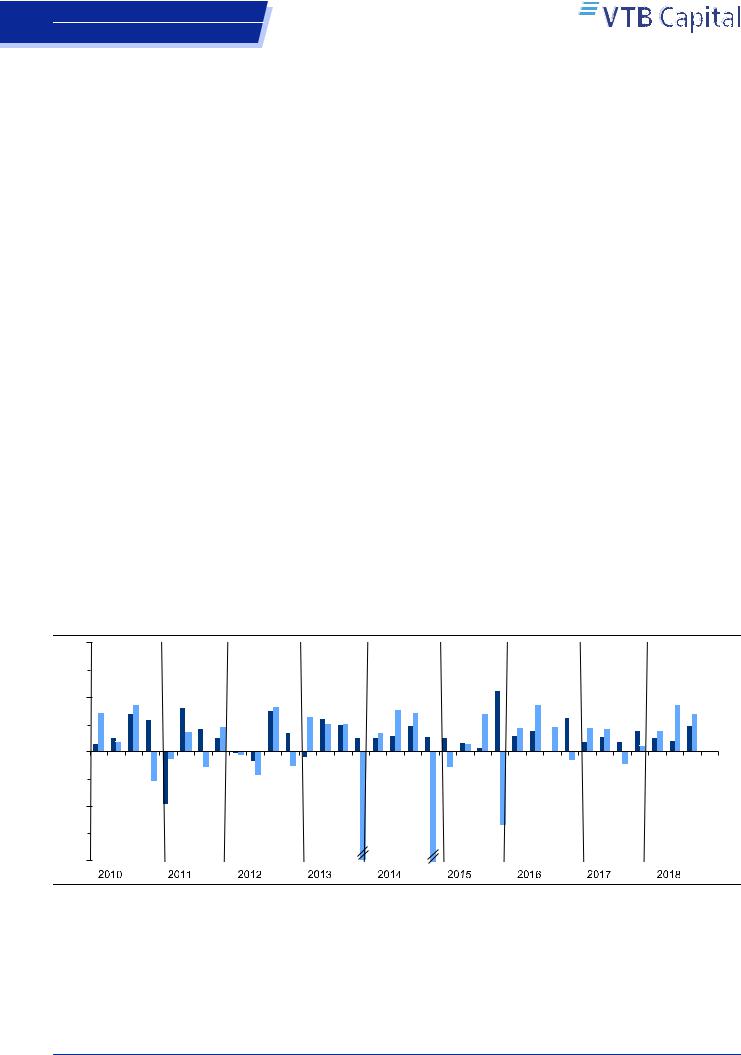
3Q18 earnings season has tailed off, leaving a robust set of numbers. A high share of companies from our universe significantly beat the consensus on their earnings, lifting the YoY RTS index EBITDA surprise to +3.5% from the negative zone. We have seen results considerably surpassing the Street for the second quarter in a row, with upside risks of the consensus rerating as analysts roll their forecasts for next year.
More than half the companies in of our universe managed to deliver positive surprises on EBITDA and net income. The 3Q18 RTS index EBITDA surprise was at 3.5%; it was negative in 3Q17.
Oil & gas names were supported by strong oil prices and a weak rouble. Gas producers underperformed the broader market, despite solid earnings. Lukoil outperformed the market, likely supported by the ongoing buyback.
Tech names mostly reported robust financial numbers, featuring EBITDAs and bottom lines ahead of Street forecasts, resulting in margins improvement in general. Yandex, Qiwi and EPAM outperformed as a result. However, we note that Luxoft dropped ahead of its results and continued to underperform after it updated its guidance for the next period. Meanwhile, Mail.ru group financials were significantly below expectations, but the stock managed to slightly outperform the market as the company raised its EBITDA guidance for FY18, despite the weakness in 3Q18.
Aeroflot reversed its pre-earnings rally and underperformed the market significantly following the results announcement, despite the company beating the consensus for the second quarter in a row. PhosAgro offered one of the strongest sets of quarterly results since its IPO, and then outperformed.
X5 Retail Group surged, posting strong financial results. The EBITDA margin improved YoY, consolidating above 7% for the second quarter. In addition, net debt/EBITDA fell below 2x as of September. Magnit missed the consensus on EBITDA and net income, and underperformed the market.
NLMK scored a noteworthy beat on EBITDA and net income, which were ahead of the consensus. Meanwhile, MMK underperformed on increased capex guidance, although exceeded market expectations on EBITDA and net income.
Sberbank earnings from continuing operations were ahead of the consensus (offering ROE 24.2%), with rouble volatility in 3Q18 supporting NIM and trading income. TCS Group was behind the market, despite above-consensus earnings, as the company significantly rallied ahead of results.
Inter RAO yet again managed to deliver double-digit profit growth, beating the consensus.
Ilya Piterskiy, Strategist
+7 495 660 67 47 // ilya.piterskiy@vtbcapital.com
Nikolay Mikheev, Strategist
+7 495 287 68 69 // nikolay.mikheev@vtbcapital.com
Prices cited in the body of this report are as of the last close before, or the close on, 04 Dec 2018 (except where indicated otherwise). VTB Capital analysts update their recommendations periodically as required. This research report was prepared by the analyst(s) named above who is(are) associated with JSC VTB Capital and is distributed by JSC VTB Capital and VTB Capital PLC and their non-U.S. affiliates outside the United States. This VTB Capital research report is distributed to investors located within United States by Xtellus Capital Partners, Inc. (“Xtellus”) as a “third-party research report” as defined in Rule 2241(a)(14) and Rule 2242(a)(17) of the U.S. Financial Industry Regulatory Authority. Please refer to the Disclosures section of this report for other important disclosures, including the analyst certification and information required by regulation.

vk.com/id446425943
Russia
Equities
Earnings Watch |
|
Table of contents |
|
3Q18 Earnings Season: Number of Positive Surprises Again More Than Half..... |
3 |
Post-results performance vs. RTS ........................................................................... |
4 |
Energy ..................................................................................................................... |
6 |
Metals & Mining ....................................................................................................... |
8 |
Transportation & Fertilizers...................................................................................... |
9 |
Consumer & Real Estate ....................................................................................... |
10 |
Media and IT.......................................................................................................... |
11 |
Telecoms & Conglomerates .................................................................................. |
12 |
Financials .............................................................................................................. |
13 |
Utilities................................................................................................................... |
14 |
Appendix A: Performance relative to RTS since 3Q18 release vs. 3Q18 EBITDA |
|
(NI for Banks) surprise........................................................................................... |
16 |
Appendix A: Performance relative to RTS since 3Q18 release vs. 3Q18 EBITDA |
|
(NI for Banks) surprise (continued)........................................................................ |
17 |
Appendix B: 3Q17-3Q18 consensus* earnings surprises...................................... |
18 |
Appendix B: 3Q17-3Q18 consensus* earnings surprises (continued) ................... |
19 |
Appendix C: 3Q17-3Q18 earnings highlights......................................................... |
20 |
Appendix C: 3Q17-3Q18 earnings highlights (continued)...................................... |
21 |
Appendix D: 3Q18 consensus data for companies mentioned .............................. |
22 |
Disclosures ............................................................................................................... |
23 |
5 December 2018 |
2 |
vk.com/id446425943 |
Earnings Watch |
Russia |
|
Equities |
|
3Q18 Earnings Season: Number of Positive Surprises Again More Than Half
45 companies from our sample deck reported their 3Q18 IFRS numbers from midOctober to end of November. Consensus forecasts were available for almost 40 of them (for the sources and dates of forecasts, please see Appendix D).
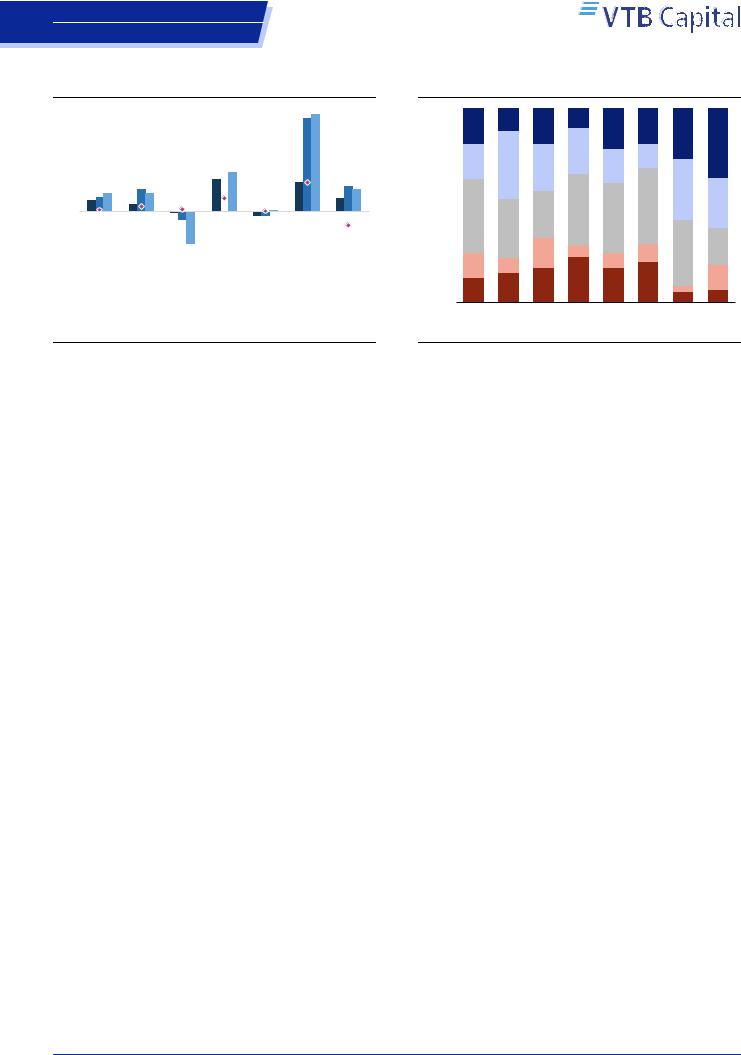
The share of positive EBITDA surprises was above 50% for second quarter in a row. 60% of the companies exceeded consensus expectations by more than +2% on EBITDA. It is worth noting that 37% of enterprises significantly beat (more than +5%) Street expectations. Meanwhile, the share of negative surprises increased as well, to almost +20%, becoming equal to the share of neutral numbers (Figure 3).
The RTS index EBITDA surprise was +3.5% in 3Q18. Despite it decreasing QoQ from more than 4% in 2Q18, the second quarter in a row above the post2010 median result since. A year ago, the RTS EBITDA surprise was in negative area, at -1.2% in 3Q17. As for individual stocks, tech names were ahead of the pack: YNDX (+18% surprise), LXFT (+16%), QIWI (+13%) and EPAM (+5%), except for MAIL (-12%), which missed Street expectations. IRAO (+14%) and NLMK (+12%) also delivered double digit surprises against consensus. MSNG* (+34%) and OGKB* (+11%) significantly surpassed our forecasts on EBITDA.
The share of positive surprises on net income stood near 60% QoQ. The distribution of positive, neutral (15% of companies) and negative (25%) surprises on net income was unchanged QoQ.
The 3Q18 net income surprises for the RTS index was at +5%. Among the positives, we note OGKB* (+44%), which significantly exceeded our expectations. NLMK (+24%) and RTKM (+21%) beat consensus forecasts. Tech names also delivered significant surpass on net income: QIWI (+19%), LXFT (+19%), YNDX (+19%) and EPAM (+10%), while MAIL (-13%) missed market’s expectations on net income. MGNT (-15%), AGRO (-28%) and ENRU (-38%) results also came below the Street’s forecasts. UPRO* (-26%) posted bottom line below our expectations.
Figure 1: RTS index sales and EBITDA surprises vs. consensus
10%

 Sales
Sales 
 EBITDA
5%
0%
-5% |
|
|
-10% |
-11% |
-24% |
|
|
1
0.8
0.6
0.4
0.2
0
-0.2
-0.4
-0.6
-0.8
-1
Source: Bloomberg, Interfax, Company data, VTB Capital Research
5 December 2018 |
3 |
vk.com/id446425943 |
Earnings Watch |
Russia |
|
Equities |
|
Figure 2: RTS by sector – surprises vs. cons
20%
15%
10%
5%
0%
-5%
-10%
Energy |
Materials |
Consumer |
Banks |
Exchange |
IT |
Telecoms |
 Sales
Sales  EBITDA
  NI
NI  Performace
Source: Bloomberg, Interfax, Company data, VTB Capital Research
Figure 3: EBITDA surprise distribution
100%
|
|
|
18% |
12% |
18% |
|
10% |
21% |
|
18% |
|
|
|
||||
|
|
|
|
|
|
|
26% |
|
|
||||||||
|
|
|
|
|
|
|
|
|
|
|
|
|
|
|
35% |
||
80% |
|
|
|
|
|
|
23% |
|
|
|
|
|
|
||||
18% |
|
|
|
|
|
|
|
12% |
|
|
|
||||||
|
|
|
35% |
|
|
|
|
18% |
|
|
|
|
|||||
|
|
|
24% |
|
|
|
|
|
|
|
|||||||
|
|
|
|
|
|
|
|
|
|
|
|
||||||
60% |
|
|
|
|
|
|
|
|
|
|
|
31% |
|
|
|||
|
|
|
|
|
|
|
|
|
37% |
|
|
|
39% |
|
|
26% |
|
|
|
|
38% |
|
24% |
|
|
|
|
|
|
|
|||||
|
|
|
|
|
36% |
|
|
|
|
|
|||||||
40% |
31% |
|
|
|
|
|
|
|
|||||||||
|
|
|
|
|
|
|
|
|
|
|
|
|
|||||
|
|
|
|
|
|
15% |
|
7% |
|
|
|
9% |
34% |
|
19% |
||
20% |
|
|
|
|
8% |
|
|
|
|||||||||
13% |
8% |
|
|
|
|
|
|
|
|
|
|||||||
|
|
|
13% |
15% |
18% |
|
23% |
18% |
|
21% |
3% |
|
13% |
||||
|
|
|
|
|
|
|
|
6% |
|||||||||
0% |
|
|
|
|
|
|
|
|
|
|
|
6% |
|
||||
4Q16 |
1Q17 |
2Q17 |
3Q17 |
4Q17 |
1Q18 |
2Q18 |
3Q18 |
||||||||||
|
|
|
|||||||||||||||
|
|
<=-5% |
|
-5% to -2% |
|
|
-2% to +2% |
|
|
+2% to +5% |
|
>+5% |
|||||
|
|
|
|
|
|||||||||||||
|
|
|
|
|
|||||||||||||
Source: Bloomberg, Interfax, Company data, VTB Capital Research
Post-results performance vs. RTS
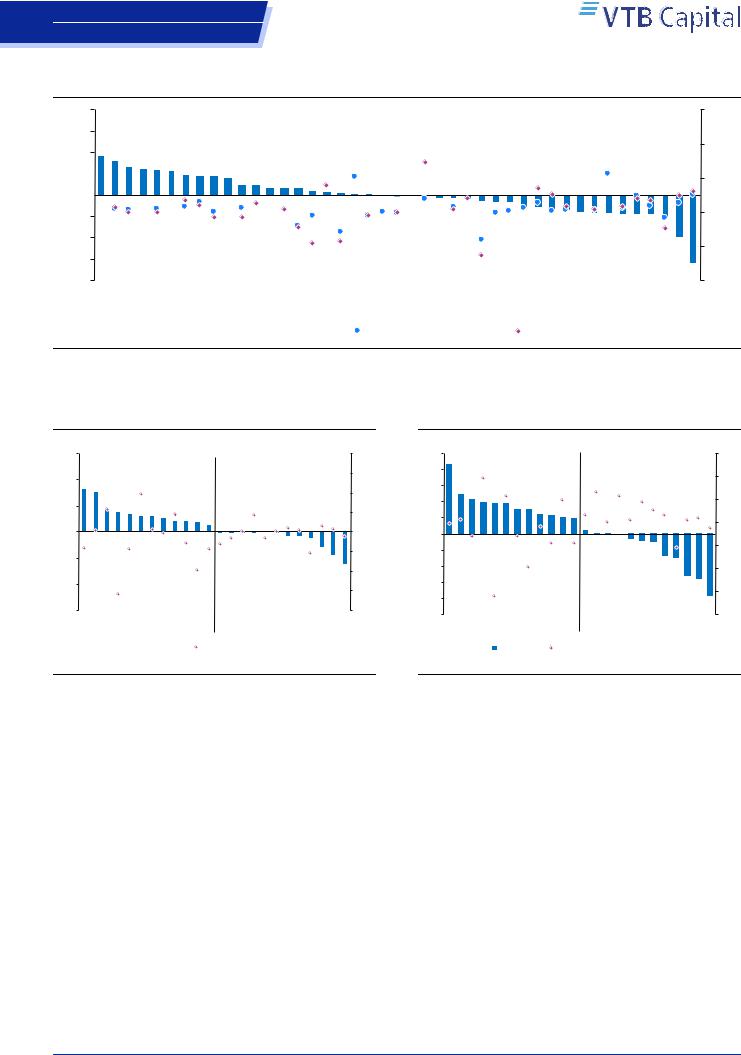
Top performers vs. the benchmark. Among companies from our deck of selected Russia stocks (with consensus or VTBC forecasts available), only ten outperformed (by more than +2%) the USD-valued RTS index one week after the publication of their 3Q18 IFRS numbers. Tech names were mostly leading this bunch: QIWI (+10%), YNDX (+6%), EPAM (+5%). FIVE (+8%), LKOH (+5%), PHOR (+4%) and PLZL (+4%) joined in. Eight of them (with available EBITDA forecasts) delivered an EBITDA surprise of above +2%. In addition to previously mentioned names, PHOR (+9% surprise), ALRS (+3%), FIVE (+3%) and LKOH (+2%) beat forecasts. Meanwhile, only six (with available net income) positively surprised on the bottom line.
Bottom performers. Twelve companies in our sample underperformed (by more than -2%) the USD-valued benchmark after their 3Q18 release. The exception came from LXFT (-16%), which significantly underperformed the broader market, despite its solid set of numbers. AFLT (-5%), IRAO (-5%), MAGN (-5%) were also behind the broader market, despite their results beating expectations. MGNT (-5%) also joined the laggards. Only one of the underperformers (with available EBITDA forecasts) delivered a significantly negative (more than -2%) EBITDA surprise to the market: MGNT (-5% surprise). It was also only one name (with available net income expectations), which missed the consensus on net income.
Performance of top/bottom surprises. Among the companies with positive surprises (more than +2%) on EBITDA, only seven of 20 names outperformed the USD-valued RTS index, with QIWI, FIVE, YNDX, EPAM and LKOH ahead of the pack (Figure 5). Meantime, only MGNT significantly underperformed the benchmark with a negative surprise.
5 December 2018 |
4 |
vk.com/id446425943 |
Earnings Watch |
Russia |
|
Equities |
|
Figure 4: 1W post-results performance relative to RTS since earnings release vs. EBITDA (NI) surprise*
20%
15%
10%
5% 


 0%
0% 


-5% -10% -15%
-20% QIWI FIVE LKOH NCSP TATN YNDX EPAM PHOR PLZL RUAL ALRS SBER SSA BSPB MAIL AGRO NLMK UPRO* TGKA*

 Performance vs RTS Index
ROSN VEON MOEX FEES OGKB* DSKY SIBN TCS ENRU CHMF
EBITDA Surprise (RHS)
TMKS
MBT RTKM TRNFP* NVTK RSTI AKRN* MSNG* MAGN NI Surpirse (RHS)
90%
60%
30%
0%
-30%
-60%
LXFT
AFLT
MGNT
GAZP
IRAO
Source: Bloomberg, Interfax, Company data, VTB Capital Research * VTB capital forecasts
Figure 5: Top/Bottom EBITDA surprises vs. 1W postresults price performance
60% |
|
20% |
40% |
|
15% |
|
|
|
|
|
10% |
20% |
|
5% |
|
|
|
0% |
|
0% |
-20% |
|
-5% |
|
|
|
|
|
-10% |
-40% |
|
-15% |
|
|
|
-60% |
|
-20% |
MSNG* TGKA* YNDX LXFT IRAO QIWI NLMK OGKB* PHOR RTKM |
AFLT GAZP TRNFP* TMKS VEON PLZL CHMF MOEX AGRO ROSN MGNT MAIL UPRO* ENRU |
|
|
EBITDA Surprise |
Performance vs RTS Index (RHS) |
|
||
|
||
Source: Bloomberg, Interfax, Company data, VTB Capital Research * VTB capital forecasts
Figure 6: Top/Bottom NI surprises vs. 1W post-results price performance
50% |
15% |
|
40% |
10% |
|
30% |
||
|
||
20% |
5% |
|
10% |
0% |
|
|
||
0% |
|
|
-10% |
-5% |
|
|
||
-20% |
-10% |
|
-30% |
-15% |
|
-40% |
||
|
||
-50% |
-20% |
|
OGKB* NLMK RTKM QIWI LXFT YNDX TRNFP* AFLT TCS |
IRAO EPAM GAZP BSPB LKOH MOEX TATN ROSN PLZL ALRS MAIL MGNT UPRO* AGRO ENRU |
|
NI Surprise |
Performance vs RTS Index (RHS) |
Source: Bloomberg, Interfax, Company data, VTB Capital Research * VTB capital forecasts
5 December 2018 |
5 |

vk.com/id446425943
Russia
Equities
Dmitry Loukashov, CFA, Equities Analyst +7 495 663 46 34 // dmitry.loukashov@vtbcapital.com
Ekaterina Rodina, Equities Analyst +7 495 663 47 33 // ekaterina.rodina@vtbcapital.com
Alexander Donskoy, Equities Analyst +7 495 660 67 88 // alexander.donskoy@vtbcapital.com
Artur Muradyants, Equity analyst +7 495 663 46 38 // artur.muradyants@vtbcapital.com
Aydar Safin, Equities Analyst +7 495 663 46 32 // aydar.safin@vtbcapital.com
Earnings Watch
Energy
Figure 7: 1W post-results performance relative to RTS since earnings release vs. EBITDA surprise
8%
|
7% |
|
|
|
|
|
|
|
|
|
|
|
|
LKOH |
|
|
|
|
|
|
|
|
||
release |
|
|
|
|
|
|
|
|
|
|
|
|
|
|
TATN |
|
|
|
|
|
|
|||
6% |
|
|
|
|
|
|
|
|
|
|
|
|
|
|
|
|
|
|
|
|
||||
|
|
|
|
|
|
|
|
|
|
|
|
|
|
|
|
|
|
|
|
|
|
|
||
5% |
|
|
|
|
|
|
|
|
|
|
|
|
|
|
|
|
|
|
|
|
|
|
|
|
|
|
|
|
|
|
|
|
|
|
|
|
|
|
|
|
|
|
|
|
|
|
|
|
|
since |
4% |
|
|
|
|
|
|
|
|
|
|
|
|
|
|
|
|
|
|
|
|
|
|
|
|
|
|
|
|
|
|
|
|
|
|
|
|
|
|
|
|
|
|
|
|
||||
3% |
|
|
|
|
|
|
|
|
|
|
|
|
|
|
|
|
|
|
|
|
|
|
|
|
|
|
|
|
|
|
|
|
|
|
|
|
|
|
|
|
|
|
|
|
|
||||
RTS |
2% |
|
|
ROSN |
|
|
|
|
|
|
|
|
|
|
|
|
|
|
|
|
||||
|
|
|
|
|
|
|
|
|
|
|
|
|
|
|
|
|||||||||
1% |
|
|
|
|
|
|
|
|
|
|
|
|
|
|
|
|
|
|
||||||
vs. |
|
|
|
|
|
|
|
|
|
|
|
|
|
|
|
|
|
|
||||||
|
|
|
|
|
|
|
|
|
|
|
|
|
|
|
|
|||||||||
0% |
|
|
|
|
|
|
|
|
|
|
|
|
|
|
|
|
SIBN |
|
|
|
|
|
||
performance |
|
|
|
|
|
|
|
|
|
|
|
TMKS |
|
|
|
|
|
|
||||||
-1% |
|
|
|
|
|
|
|
|
|
|
|
|
|
|
|
|
|
|
|
|||||
|
|
|
|
|
|
|
|
|
|
|
|
|
|
|
|
|
|
|
|
|||||
|
-2% |
|
|
|
|
|
|
|
|
|
|
|
|
|
|
|
|
|
|
|
|
|
|
|
|
|
|
|
|
|
TRNFP* |
|
|
|
|
|
|
|
|
||||||||||
|
|
|
|
|
|
|
|
|
|
|
|
|
|
|
|
|
||||||||
|
-3% |
|
|
|
|
|
|
|
|
|
|
|
|
NVTK |
|
|
|
|
|
|
|
|
||
Weekly |
|
|
|
|
|
|
|
|
|
|
|
|
|
|
|
|
|
GAZP |
|
|
|
|||
-4% |
|
|
|
|
|
|
|
|
|
|
|
|
|
|
|
|
|
|
|
|
||||
|
|
|
|
|
|
|
|
|
|
|
|
|
|
|
|
|
|
|||||||
-5% |
|
|
|
|
|
|
|
|
|
|
|
|
|
|
|
|
|
|
|
|
|
|
|
|
|
|
|
|
|
|
|
|
|
|
|
|
|
|
|
|
|
|
|
|
|
|
|
|
|
|
-6% |
|
|
|
|
|
|
|
|
|
|
|
|
|
|
|
|
|
|
|
|
|
|
|
|
|
|
|
|
|
|
|
|
|
|
|
|
|
|
|
|
|
|
|
|
|
|||
|
-6% |
-4% -2% |
0% |
2% |
4% |
6% |
8% |
|||||||||||||||||
|
|
|
|
|
|
EBITDA (NI for Banks) Surprise vs. Cons |
|
|
|
|||||||||||||||
Source: Bloomberg, Interfax, Company data, VTB Capital Research * VTB capital forecasts
Rosneft (+0.4% vs RTS a week after 3Q18 results) missed consensus on EBITDA and net income by -4% and -3% respectively. Rosneft's growing tax relief, including those at its HTR reserves, contributed significantly to the company's profitability. The most visible improvement was reflected in FCF, which rose to USD 4.3bn, according to the company’s official financial statements. However, adjusted for all accounting issues, we estimate the company posted USD 5.8bn of FCF in 3Q18.
Gazprom (-4.6%) numbers were strong, coming above both our forecast and the market consensus on EBITDA and net income. Strong sales volumes and prices supported revenues. In addition, the better than expected operating expenses had a positive effect on EBITDA. However, the relatively strong numbers and supportive statements from management on dividends last week did not help Gazprom, which dropped -2% on 30 November.
Novatek (-3.4%) posted higher than expected revenue (+5% above consensus). EBITDA and net income also exceeded forecasts by +2% and +5%, respectively. The positive inventory changes, along with a higher than expected FX gain, were the key factors for the difference with our forecast. The company printed FCF at USD 663mn (not accounting for changes in working capital), up +33% YoY. Despite healthy 3Q18 IFRS numbers, the stock underperformed the broader market over the week post-results.
Lukoil (+6.6%) offered strong numbers, with revenues and EBIDA above consensus by +5% and +2%. The solid set of numbers was thanks to strong oil prices in 3Q18 and growing production. In addition, weaker rouble helped as well. Below the operating level, Lukoil showed a better than expected income from associates. However, the bottom line came in line with the Street expectations. The stock came ahead of the market, likely supported by the ongoing buyback.
Gazprom Neft (-0.8%) beat the Street forecasts on EBITDA and net income by +4% and +3%, respectively. The key discrepancy to our forecast was from better than expected tax reliefs in the upstream segment, which also support FCF.
Tatneft (+5.7%) beat the consensus on EBITDA by +3%. EBITDA supported by 4.5% QoQ growth in crude production and only 1.8% QoQ growth in OPEX. However, net income came in line with the Street expectations.
5 December 2018 |
6 |

vk.com/id446425943 |
Earnings Watch |
Russia |
|
Equities |
|
TMK (-1.7%) revenue and EBITDA were broadly in line with consensus. Below the operating level, the company reported a significant loss related to the disposal of its production subsidiary in the Sultanate of Oman. Therefore, the company's bottom line dropped into negative territory in 3Q18. As a result, the stock underperformed the RTS.
Transneft (-3.2%) results were in line with our forecast on top line and EBITDA, but net income was reported more than 60% higher than we had expected, primarily due to the RUB 25.4bn revaluation gain. Nevertheless, we do not expect this to have any significant effect on future dividends, which are based on normalised net income adjusted for non-cash one offs, which is +15% above expectations.
5 December 2018 |
7 |