

BCG_Value_Creation_in_Mining_2019_watermark
.pdfvk.com/id446425943
Value Creation in Mining 2019
Return to Strategy

vk.com/id446425943
Boston Consulting Group (BCG) is a global management consulting frm and the world’s leading advisor on business strategy. We partner with clients from the private, public, and not-for-proft sectors in all regions to identify their highest-value opportunities, address their most critical challenges, and transform their enterprises. Our customized approach combines deep insight into the dynamics of companies and markets with close collaboration at all levels of the client organization. This ensures that our clients achieve sustainable competitive advantage, build more capable organizations, and secure lasting results. Founded in 1963, BCG is a private company with ofces in more than 90 cities in 50 countries. For more information, please visit bcg.com.

vk.com/id446425943
Value Creation in Mining 2019
RETURN TO STRATEGY
GUSTAVO NIEPONICE
THOMAS VOGT
ALEXANDER KOCH
January 2019 | Boston Consulting Group
vk.com/id446425943
CONTENTS
3EXECUTIVE SUMMARY
6THE ROAD TO RECOVERY
10FOLLOWING THE MONEY: CASH FLOW AND CAPITAL SPENDING
17 MOVING FORWARD: THE CRITICAL DECISIONS
23 APPENDIX
26FOR FURTHER READING
27NOTE TO THE READER
2 | Return to Strategy
vk.com/id446425943
EXECUTIVE SUMMARY
After a deep five-year slide, the mining industry began to recover in 2016, aided by substantial increases in commodity prices. Yet
by mid-2018, the rebound began to encounter significant headwinds.
•In 2016 and 2017, the median total shareholder return (TSR) of the 63 leading mining companies in our study was 41% and 23%, respectively. This, afer the industry had turned in the lowest median TSR of any industry sector from 2011 through 2015.
•In 2017 and 2018, revenues and margins grew simultaneously for the frst time in seven years. Cash fow from operations also increased.
•Higher cash fows and valuations bolstered companies’ balance sheets, enabling companies to pay down debt. More recently, however, concerns over future demand have dampened valuations, sending the 2018 TSR into negative territory.
•Operating costs are once again creeping up, owing to less favorable macroeconomics and to tightening supplier markets.
Mining companies have become more prudent in their cash allocation practices, despite the growth in cash reserves over the past two years. The companies have focused on completing ongoing capital projects and returning excess cash to shareholders, a shift that accelerated in 2018.
•Most operating cash fow was directed either at completing capital projects begun during the boom years or at pursuing more measured expansion and replacement projects.
•CapEx has dwindled considerably; as a proportion of cash fow from operations, it remains near ten-year lows for the companies in our study.
Boston Consulting Group | 3
vk.com/id446425943
•As project spending has declined, so has the capital intensity of projects being pursued. Companies with attractive projects and sufcient funding capacity are thus well positioned to pursue a countercyclical growth strategy.
Exploration is on the rebound. Since hitting a low point in 2016, exploration budgets have been growing, though they remain well below their 2012 peak. Juniors are once again playing a bigger role, now accounting for almost a third of total exploration expenditure.
•So far, however, discovery rates have remained under pressure. From 2002 to 2012, the number of giant and major discoveries declined, despite a tenfold increase in spending, and discoveries were generally lower grade. This trend appears to be holding: while unit discovery costs are declining, they remain high by historical standards.
•To succeed against these challenging odds, companies must adopt disciplined approaches to exploration strategy and management, look to innovative technologies to improve targeting and discovery rates, and redouble their eforts to attract and retain top talent.
M&A activity remains subdued, but a few acquirers have struck pay dirt.
•Although asset prices bottomed out in 2015, the anticipated rebound in M&A activity never materialized. The number of deals valued at more than $1 billion has declined; and among the majors, divestments outnumbered acquisitions.
•Still, some acquirers took advantage of poor market conditions and did particularly well, afrming BCG research showing that deals made in a downturn create more value.
One major lesson of the last cycle involves the importance of developing a value creation strategy that is independent of commodity prices. The tentative nature of the current recovery only underscores this lesson. To weather the full cycle, mining companies must explore holistic ways to activate the key drivers of TSR.
•Targets for productivity—a major path to proftable growth (which is itself a key contributor to long-term value)—must be set at ambitious levels.
•New and emergent technologies, such as machine learning and autonomous equipment, along with improvements in processing equipment and data analytics, ofer fresh and powerful ways to unlock value.
•Companies that take a value-driven approach to project evaluation, selection, and execution are stronger and more sustainable. For example, lean design principles can bolster construction planning and productivity.
4 | Return to Strategy
vk.com/id446425943
Mining executives should also consider new approaches to social and policy challenges—in particular, the resurgence of resource nationalism. Political and economic dynamics may be shifting more rapidly than they realize.
•In the near term, new regulations aimed at boosting citizens’ asset ownership have increased the complexity and uncertainty surrounding operations and planning.
•Longer term, companies should consider the impact of automation on labor needs, and the implications of these efects on local economies and on their relationships with governments. At the same time, the reduced environmental impact that emergent technologies promise can open new opportunities. These and other considerations will fgure in companies’ exploration and operational strategies.
Boston Consulting Group | 5

vk.com/id446425943
THE ROAD TO RECOVERY
The return to financial health has been a hard slog for mining companies. Starting
in 2011, the combined impact of waning price and production growth, sharp cost increases, and slackening capital discipline sent the industry into a steep slide. During the five-year period from 2011 through 2015, mining produced the lowest median total shareholder return (TSR) of any major industry. (See the appendix for an explanation of the components of TSR.) In all critical measures— revenues, margins, and cash flow—mining
companies suffered double-digit declines, hitting their lowest point since the global financial crisis in 2008.
In 2016, the industry finally turned around. The median TSR of the 63 leading mining companies in our study took a sharp turn upward that year, to 41%.1 In 2017, the median TSR was 23%. But after a promising start, 2018 has proved to be another difficult year—a reminder that the recovery is still a work in progress. (See Exhibit 1.)
Exhibit 1 | The Rebound in Median Mining Company TSR Looks Tentative
Median TSR (%)
100 |
|
|
89 |
|
97 |
|
|
|
|
|
|
|
|
|
|
44 |
60 |
|
|
|
|
|
|
|
|
|
|
|
|||
|
|
|
|
|
|
|
|
|
|
|
|
|
|||
|
|
|
|
|
|
|
|
|
|
|
|
|
|||
50 |
|
|
|
|
30 |
|
|
|
|
|
41 |
23 |
|
||
|
|
|
|
|
|
|
|
|
|
||||||
0 |
|
|
|
|
|
|
6 |
|
|
|
|
|
|||
|
|
|
|
|
|
|
|
|
|
|
|
||||
|
|
|
|
|
|
|
|
|
|
|
|
|
|||
|
|
|
|
|
|
|
|
|
|
|
|
|
|
||
|
|
|
|
|
|
|
|
|
|
|
|
|
|
||
|
|
|
|
|
|
|
|
|
–6 |
|
|
|
|
||
|
|
|
|
|
|
|
|
|
|
|
|
|
|
||
|
|
|
|
|
|
|
|
|
|
|
|
|
|
–23 |
|
–50 |
|
|
|
|
|
|
–29 |
|
–32 |
|
–36 |
|
|
||
|
|
|
|
|
|
|
|
|
|
|
|||||
|
|
|
|
|
|
|
|
|
|
|
|
||||
|
|
|
|
|
|
|
|
|
|
|
|
|
|||
|
|
|
|
|
|
|
|
|
|
|
|
|
|
|
|
|
|
|
|
–60 |
|
|
|
|
|
|
|
|
|
|
|
–100 |
|
|
2007 |
|
|
|
|
|
|
|
|
|
|
|
|
2005 |
2006 |
2008 |
2009 |
2010 |
2011 |
2012 |
2013 |
2014 |
2015 |
2016 |
2017 |
2018 |
|||
|
Sources: S&P Capital IQ; annual reports; BCG analysis.
Note: Sample comprised 63 leading companies with a market value greater than $5 billion (and at least 20% free float) at the end of 2017 and/or a market value greater than $5 billion at the end of 2007.
6 | Return to Strategy

vk.com/id446425943
Both Revenues and Margins Are Up
In 2017, for the first time in seven years, the revenues and margins of our sample companies grew simultaneously. From 2015 through
2017, EBITDA margin expanded by 5%, from
25% to 30%, although it fell short of the average margin of 35% logged during the preceding ten years. Many commodity prices retreated in 2018, even though the revenues and margins of our sample companies held steady for the most part. Meanwhile, absolute costs have begun to creep upward again, and they remain elevated as a percentage of revenues. (See Exhibit 2.)
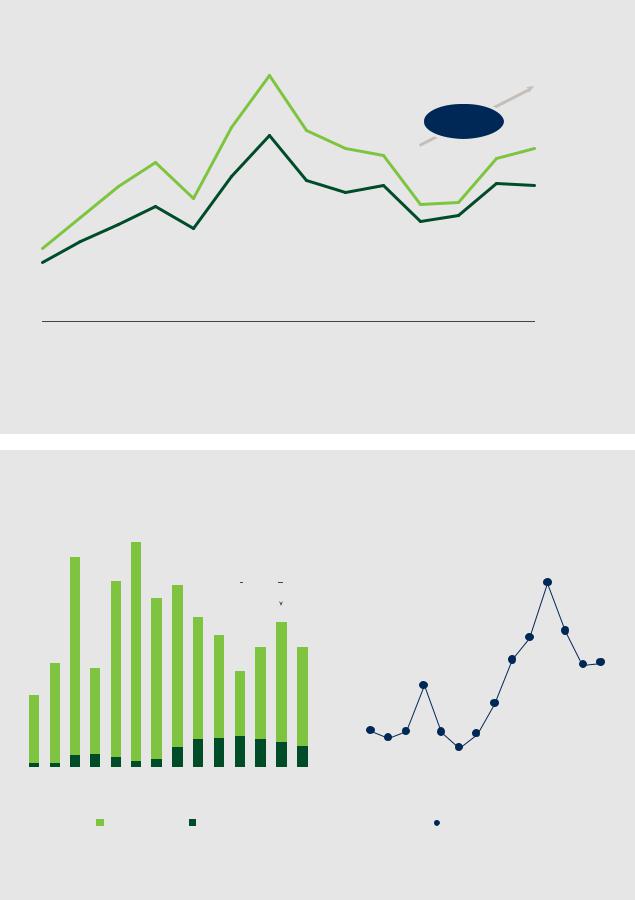
Over the past three years (since 2015), the combined figure for cash flow from operations and EBITDA has increased by around
40%. While these results are still well below their 2011 highs, they have clearly improved since the downturn. (See Exhibit 3.)
Robust EBITDA and cash flow growth have also driven valuations higher, which in turn has enabled companies to pay down debt.
From its low point in 2015, the aggregate enterprise value of our sample increased by nearly 50% by 2017, to $1.12 trillion. This increase helps explain the sharp drop in the ratio of net debt to enterprise value, which fell by almost half, from a peak of 32% in 2015 to
18% in 2017. (See Exhibit 4.) Diversified companies, along with copper and gold producers, enjoyed the biggest decline in gearing.
Hefty increases in commodity prices since 2015 were the main factor fueling these financial gains. Starting in late 2015, iron ore, copper, and thermal coal prices rose by double digits, as did prices of nickel, aluminum, and lead. Zinc more than doubled in price. Gold saw a more modest improvement, uranium sagged before picking up in 2018, and fertilizer minerals remained under continued pressure. Still, overall, commodity prices have played a major role in the industry’s rebound.
Valuations, on the other hand, retreated in 2018, partly as a result of concerns about easing demand and its dampening effect on commodity prices.
Costs Are Mounting
After declining for three years, operating costs are beginning to creep upward again. From 2012 through 2016, the per-unit cost of producing copper fell by 20%, but by 2017 it began rising again. The unit costs of iron ore and gold—the latter measured as all-in sustaining cost (AISC)—also declined, although costs for both (as well as for other minerals) have begun to increase. Exhibit 5 shows the trend for gold production costs.
Exhibit 2 | Both Revenues and Margins Increased—and So Did Costs
Margins remain below period
Revenues ($billions) |
|
|
|
|
|
|
|
|
|
|
average of 33% |
|||||
600 |
|
|
|
|
|
|
40 |
32 |
29 |
29 |
|
|
|
|
|
|
|
|
|
|
|
|
|
|
|
|
|
|
|||||
|
|
|
|
|
|
|
|
|
|
|
|
|||||
|
|
|
|
|
|
|
|
|
|
|
|
|
||||
|
|
|
|
|
|
|
|
|
30 |
30 |
EBITDA (%) |
|||||
|
|
|
|
|
|
|
|
|
|
|
||||||
400 |
|
|
|
|
|
39 |
|
|
|
|
25 |
|
|
|
|
|
|
|
|
|
|
|
|
|
|
26 |
|
|
|
|
|||
|
|
|
|
36 |
|
|
|
|
|
|
|
|
|
|||
|
|
|
|
32 |
|
|
|
|
|
|
|
|
|
|
|
|
|
|
|
38 |
|
|
|
|
|
|
|
|
|
|
|
|
|
|
|
|
|
|
|
|
|
|
|
|
|
|
|
|
|
|
200 |
34 |
38 |
|
|
|
|
60 |
68 |
71 |
71 |
75 |
74 |
70 |
70 |
Cost (%) |
|
|
|
|
64 |
|
61 |
|||||||||||
|
|
62 |
68 |
|
|
|
|
|
|
|
||||||
|
|
62 |
|
|
|
|
|
|
|
|
|
|
|
|||
|
66 |
|
|
|
|
|
|
|
|
|
|
|
|
|
||
|
|
|
|
|
|
|
|
|
|
|
|
|
|
|
||
|
|
|
|
|
|
|
|
|
|
|
|
|
|
|
|
|
0 |
|
|
|
|
|
|
|
|
|
|
|
|
|
|
|
|
|
2005 |
2006 |
2007 |
2008 |
2009 |
2010 |
2011 |
2012 |
2013 |
2014 |
2015 |
2016 |
2017 |
2018E1 |
|
|
Sources: S&P Capital IQ; annual reports; BCG analysis.
Note: Sample comprised 63 leading companies with a market value greater than $5 billion (and at least 20% free float) at the end of 2017 and/or a market value greater than $5 billion at the end of 2007.
1Trailing 12 months to Q3 2018 results.
Boston Consulting Group | 7
vk.com/id446425943
Exhibit 3 | EBITDA and Cash Flow from Operations Have Rebounded by About 40% Since 2015
$billions
234
|
|
185 |
182 |
|
+48% (EBITDA) |
|
||
|
|
|
165 |
|
+37% (CFFO1) |
164 |
||
|
|
|
158 |
|
|
156 |
||
|
|
151 |
178 |
|
|
EBITDA |
||
|
|
|
|
|
|
|
||
|
129 |
117 |
|
|
|
|
|
CFFO1 |
|
|
134 |
|
111 |
113 |
|
||
|
|
138 |
|
|
||||
|
99 |
130 |
131 |
130 |
||||
|
|
123 |
|
|
|
|
||
|
|
109 |
|
|
95 |
101 |
|
|
70 |
92 |
87 |
|
|
|
|
||
|
|
|
|
|
||||
|
|
|
|
|
|
|||
|
76 |
|
|
|
|
|
|
|
56 |
|
|
|
|
|
|
|
|
2005 |
2006 |
2007 |
2008 |
2009 |
2010 |
2011 |
2012 |
2013 |
2014 |
2015 |
2016 |
2017 |
2018E2 |
Sources: S&P Capital IQ; annual reports; BCG analysis.
Note: Sample comprised 63 leading companies with a market value greater than $5 billion (and at least 20% free float) at the end of 2017 and/or a market value greater than $5 billion at the end of 2007.
1Cash flow from operations.
2Trailing 12 months to Q3 2018 results.
Exhibit 4 | Valuations Have Improved, Strengthening Balance Sheets
|
|
|
|
Enterprise value ($billions) |
|
|
|
|
|
|
|
|
|
Leverage ratio (%) |
|
|
|
|
|
|||||||||||||
|
|
|
|
|
|
1,752 |
|
|
|
|
|
|
|
|
|
|
|
|
|
|
|
|
|
|
|
|
|
|
|
|
|
|
|
|
|
1,634 |
|
|
|
|
|
|
|
|
|
|
|
|
|
|
|
|
|
|
|
|
|
|
|
|
|
|
|
|
|
|
|
|
|
|
1,448 |
|
1,422 |
|
|
|
+49% |
|
|
|
|
|
|
|
|
|
|
|
|
|
32 |
|
|
|
|
|||
|
|
|
|
|
|
|
1,314 |
|
|
|
|
|
|
|
|
|
|
|
|
|
|
|
|
|
|
|
|
|
|
|||
|
|
|
|
|
|
|
|
|
|
|
|
|
|
|
|
|
|
|
|
|
|
|
|
|
|
|
|
|
|
|
||
|
|
|
|
|
|
|
|
|
1,172 |
|
|
|
|
|
|
|
|
|
|
|
|
|
|
|
|
|
|
|
|
|
|
|
|
|
|
|
|
|
|
|
|
|
|
|
1,123 |
|
|
|
|
|
|
|
|
|
|
|
22 |
|
24 |
|
|
|
|||
|
|
|
|
|
|
|
|
|
|
|
|
|
|
|
|
|
|
|
|
|
|
|
|
|
|
|
|
|
||||
|
|
|
|
|
|
|
|
|
|
1,033 |
|
|
|
|
|
|
|
|
|
|
|
|
|
|
|
|
|
|
|
|
||
|
|
|
|
|
|
|
|
|
|
|
|
|
|
|
941 |
|
|
|
|
|
|
|
|
|
|
|
|
|
|
|
||
|
|
|
|
|
|
|
|
|
|
|
|
|
934 |
|
|
|
|
|
|
|
|
|
|
|
19 |
|
|
|
|
|
|
|
|
|
816 |
|
|
|
|
|
|
|
|
|
|
|
|
|
|
|
|
|
|
|
|
|
|
|
|
|
|
18 |
18 |
|
|
|
|
|
769 |
|
|
|
|
|
|
752 |
|
|
|
|
|
|
|
14 |
|
|
|
|
|
|
|
|
|
|||||
|
|
|
|
|
|
|
|
|
|
|
|
|
|
|
|
|
|
|
|
|
|
|
|
|
|
|
|
|||||
|
|
|
|
|
|
|
|
|
|
|
|
|
|
|
|
|
|
|
|
|
|
|
|
|
|
|
|
|
|
|
|
|
560 |
|
|
|
|
|
|
|
|
|
|
|
|
|
|
|
|
|
|
|
|
|
|
|
11 |
|
|
|
|
|
|
|
|
|
|
|
|
|
|
|
|
|
|
|
|
|
|
|
|
|
|
|
|
|
|
|
|
|
|
|
|
|
|
|
|
|
|
|
|
|
|
|
|
|
|
|
|
|
|
|
|
|
|
6 |
5 |
6 |
|
6 |
|
5 |
|
|
|
|
|
|
|
|
|
|
|
|
|
|
|
|
|
|
|
|
|
|
|
|
|
|
|
|
|
|
|
|
|
|
|
|
|
|
|
|
||
|
|
|
|
|
|
|
|
|
|
|
|
|
|
|
|
|
|
|
|
|
|
3 |
|
|
|
|
|
|
|
|
|
|
|
|
|
|
|
|
|
|
|
|
|
|
|
|
|
|
|
|
|
|
|
|
|
|
|
|
|
|
|
|
|
|
|
|
|
|
|
|
|
|
|
|
|
|
|
|
|
|
|
|
|
|
|
|
|
|
|
|
|
|
|
|
|
|
||
2005 |
2006 |
2007 |
2008 |
2009 |
2010 |
2011 |
2012 |
2013 |
2014 |
2015 |
2016 |
2017 |
2018 |
2005 |
2006 |
2007 |
2008 |
2009 |
2010 |
2011 |
2012 |
2013 |
2014 |
2015 |
2016 |
2017 |
2018E1 |
|||||
|
|
|
|
|
Market value |
|
Net debt |
|
|
|
|
|
|
|
|
|
|
Debt/enterprise value |
|
|
|
|
|
|||||||||
|
|
|
|
|
|
|
|
|
|
|
|
|
|
|
|
|
|
|
|
|
||||||||||||
|
|
|
|
|
|
|
|
|
|
|
|
|
|
|
|
|
|
|
|
|
|
|
|
|
|
|
|
|
|
|
|
|
Sources: S&P Capital IQ; annual reports; BCG analysis.
Note: Sample comprised 63 leading companies with a market value greater than $5 billion (and at least 20% free float) at the end of 2017 and/or a market value greater than $5 billion at the end of 2007.
1Trailing 12 months to Q3 2018 results.
8 | Return to Strategy