

BlackRock - midyear investment outlook 2019_watermark
.pdfvk.com/id446425943
FOR PUBLIC DISTRIBUTION IN THE U.S., HONG KONG, SINGAPORE AND AUSTRALIA.
FOR INSTITUTIONAL, WHOLESALE, QUALIFIED INVESTORS AND PROFESSIONAL AND QUALIFIED CLIENTS IN OTHER PERMITTED COUNTRIES
Global
Investment
Outlook BlackRock
Investment
Institute
Midyear 2019
BIIM0719U-894993-1/16

vk.com/id446425943
FOR PUBLIC DISTRIBUTION IN THE U.S., HONG KONG, SINGAPORE AND AUSTRALIA.
FOR INSTITUTIONAL, WHOLESALE, QUALIFIED INVESTORS AND PROFESSIONAL AND QUALIFIED CLIENTS IN OTHER PERMITTED COUNTRIES
|
|
|
Philipp Hildebrand |
|
Jean Boivin |
Vice Chairman |
|
Head |
BlackRock |
|
BlackRock Investment |
|
|
Institute |
Investment themes |
3-6 |
Protectionist push |
|
Stretching the cycle |
|
Raising resilience |
|
Focus |
7-9 |
Geopolitics |
|
China’s economy |
|
Coping with low yields |
|
Forum debate |
10-11 |
Inflation |
|
Central banks |
|
Market views |
12-15 |
Asset view table |
|
The key change in our outlook is that we now see trade and geopolitical frictions as the principal driver of the global economy and markets. This leads us to downgrade our growth outlook further and take a modestly more defensive investing stance.
We expect a significant shift by central banks toward monetary easing to cushion the slowdown. This policy pivot should extend the long expansion, we believe, and has already triggered easier financial conditions. We remain positive on U.S. equities against a backdrop of reasonable valuations. Coupon income is key in a low-yield world, and we upgrade emerging market (EM) debt as a result. We believe markets are overly optimistic about China’s efforts to boost growth, however, leading us to downgrade China-linked EM and Japanese equities.
The European Central Bank (ECB) has put stimulus tools back on the table, while the Federal Reserve is poised to cut interest rates as insurance against a downturn. We expect the ECB to deliver on stimulus expectations. We close our underweight in European equities and upgrade the region’s bonds as a result. By contrast, we view the degree of Fed easing that markets are pricing in as excessive, given that we see limited near-term risks of recession. The possibility of a snapback in yields leads us to downgrade our tactical view on U.S. Treasuries.
The U.S. and China have entered into a strategic competition that we see as structural and persistent. The fallout is a potential rollback of decades-long globalization trends that gradually lowered inflation and expanded corporate profit margins. Could this eventually result in a supply shock that pushes down trend growth and ends disinflation? This is a scenario that markets are not prepared for — and could lead to negative returns in both equities and bonds. We prefer to dial down overall risk by raising some cash but still see an important role for long-term government bonds as portfolio stabilizers, especially on a medium-term horizon.
|
|
|
|
|
Elga Bartsch |
Mike Pyle |
Scott Thiel |
||
Head of Macro Research |
Global Chief Investment |
Chief Fixed Income |
||
|
Strategist |
Strategist |
||
BlackRock Investment |
BlackRock Investment |
BlackRock Investment |
||
Institute |
Institute |
Institute |
||
2 GLOBAL INVESTMENT OUTLOOK — SUMMARY |
BIIM0719U-894993-2/16 |

vk.com/id446425943
Buying time amid rising protectionism
Our June 12-13 Outlook Forum in London brought together roughly 100 BlackRock investment professionals to debate the prospects of the global economy, policy and markets. We give a flavor of the Forum’s discussions , and refresh our themes and asset views in this publication.
We update our three 2019 investment themes in light of our view that trade disputes and geopolitical tensions are now the key drivers for the global economy and markets. A U.S.-led protectionist push has increased downside risks to the global economy — and widened the range of potential outcomes ahead. We highlight how a significant dovish shift by central banks could nevertheless buy investors time, stretching this economic cycle and supporting risk assets. We explain how the uncertain global backdrop argues for a more overall defensive approach in portfolios. See the boxes on the right — and the following three pages for a deep dive on each theme.
Structural U.S.-China competition is at the center of geopolitical uncertainty. The tensions go beyond trade, extending to strategic concerns over domination of next-generation technologies and their implications for national security. See page 7. We explain the pivotal role of China’s economy and why we believe markets may be overestimating the country’s efforts to boost growth (page 8). We then examine how investors can deal with low for longer bond yields (page 9).
Our Outlook Forum featured two key debates. We discussed whether deglobalization could gradually reverse a long trend of subdued inflation, steady productivity growth and soaring corporate profit margins (page 10). And we debated how central banks can respond to the low-growth, low-inflation environment (page 11). Lastly, we detail our asset views for the next six to 12 months (pages 12-15).
FOR PUBLIC DISTRIBUTION IN THE U.S., HONG KONG, SINGAPORE AND AUSTRALIA.
FOR INSTITUTIONAL, WHOLESALE, QUALIFIED INVESTORS AND PROFESSIONAL AND QUALIFIED CLIENTS IN OTHER PERMITTED COUNTRIES
Protectionist push
Stretching the cycle
Raising resilience
We are downgrading our global growth outlook as trade disputes and broader geopolitical tensions stoke greater macro uncertainty. The range of potential economic and market outcomes further ahead has widened. We see a lull in China’s growth due to the fallout of U.S. tariffs.
Implication: We favor reducing risk amid rising protectionism, including raising some cash.
The decisively dovish shift by central banks has depressed long-term yields and should help extend the long expansion. This makes for a benign near-term environment for risk assets, in our view, although uncertainty around the outlook has risen.
Implication: We stay positive on U.S. equities and like
EM debt’s income potential in a low-yield world.
We believe portfolio resilience is crucial at a time of elevated macro uncertainty. We define resilience as the ability of a portfolio to withstand a variety of adverse conditions — both on a tactically defensive basis and strategically across cycles.
Implication: Government bonds play an important role in building portfolio resilience — even at low yield levels.
3 |
BIIM0719U-894993-3/16 |
3 |
vk.com/id446425943
FOR PUBLIC DISTRIBUTION IN THE U.S., HONG KONG, SINGAPORE AND AUSTRALIA.
FOR INSTITUTIONAL, WHOLESALE, QUALIFIED INVESTORS AND PROFESSIONAL AND QUALIFIED CLIENTS IN OTHER PERMITTED COUNTRIES
Themes
Protectionist push
Geopolitical tensions have heightened macro uncertainty, leading to a wider range of potential economic and market outcomes ahead. The escalation in trade conflicts between the U.S. and its major trading partners has become the primary risk to the long global expansion, in our view, rather than traditional late-cycle concerns relating to overheating or recession. In the near term, tariffs and the uncertainty around trade policy could deliver a one-off boost to prices, damage business confidence, and discourage capital spending. This comes at a time when our Inflation GPS already points to upside risk in U.S. inflation in coming months.
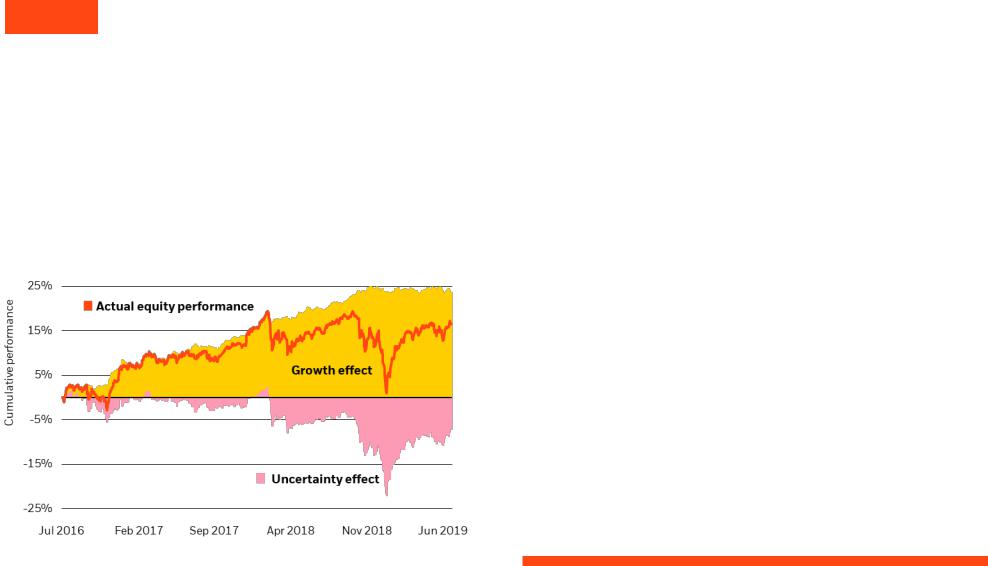
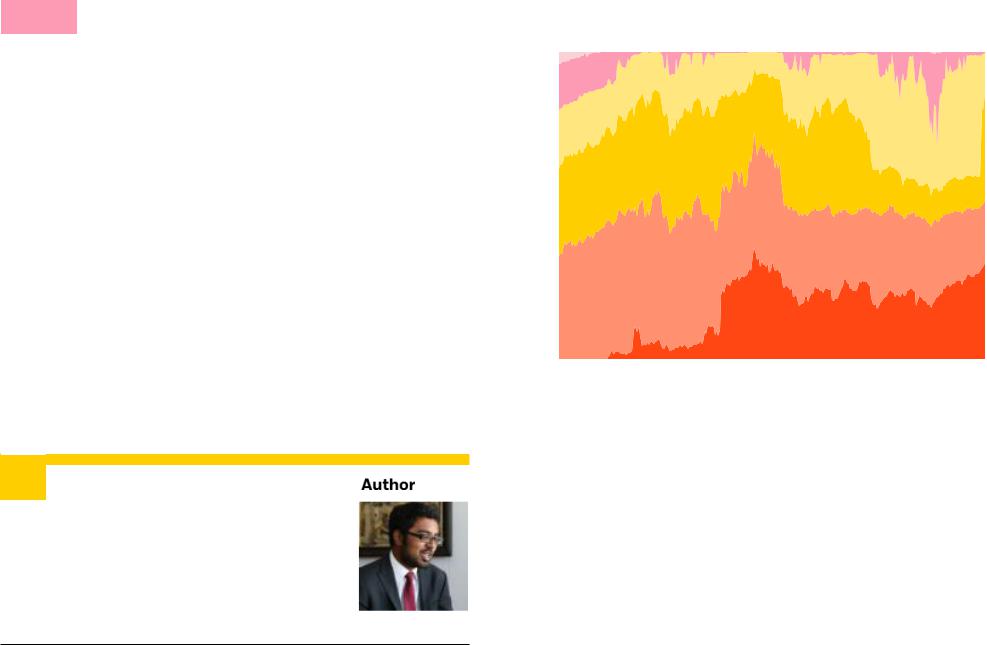
Nagging uncertainty
Estimated drivers of developed market equity performance, 2016-2019
Sources: BlackRock Investment Institute, with data from Refinitiv Datastream, July 2019.
Past performance is not a reliable indicator of current or future results. Notes: The chart shows the cumulative performance of the MSCI World Index rebased to 0 on July 1, 2016. The performance is broken down into the “growth effect” and “uncertainty effect”. We estimate the degree to which developed market real yields and equities move together as a simple measure of the growth effect — markets pricing in changes in growth expectations — drawing on the methodology used in the 2014 IMF paper News and Monetary Shocks at a High Frequency: A Simple Approach. We label the portion of equity returns unexplained by growth as the uncertainty effect. It is not possible to invest directly in an index. Indexes are unmanaged and not subject to fees.
4 GLOBAL INVESTMENT OUTLOOK — THEMES
The longer-term risk: The unraveling of global supply chains delivers a supply shock that saps productivity growth, reinforces a slowdown in potential output and leads to higher inflation. We find that the uncertainty stemming from the trade threats and tit-for-tat responses have already taken a toll on developed market equities. See the Nagging uncertainty chart. We break down the cumulative performance of DM equities by determining whether the joint moves in equities and government bond yields are driven by changes in growth expectations or factors unrelated to growth — which we attribute to uncertainty.
The uncertainty effect has hovered sideways since the start of the year and, therefore, may not have taken on board the escalation in trade tensions. This poses risks to equity markets as we expect the strategic tensions between the U.S. and China to persist, even if markets cheer a temporary truce on trade. See page 7. As a result, we favor moderately reducing portfolio risk overall. For U.S. dollar investors this may include an allocation to cash-like instruments.
Trade tensions have already caused global growth to slow and we expect further fallout that may weaken domestic spending. Yet central banks have been quick to pivot to more dovish policy stances. This indicates they are ready to provide more stimulus to reduce downside risks, even though it is not clear that monetary policy stimulus can effectively offset the protectionist push. We expect U.S. growth to cool to around trend-like levels just below a 2% annual rate. The eurozone is steadying after last year’s abrupt slowdown, in part caused by China.
China’s growth is finding its footing but looks to be at risk of staying sluggish due to the tariff fallout. We expect Beijing to be quick to roll out fiscal stimulus to help underpin growth if the economy wobbles but believe markets are overly optimistic about the effect. We expect any stimulus to stabilize growth, but not to accelerate it. See page 8. Overall, we see weaker growth in China and its fallout on the eurozone limiting any upside to global growth.
Our bottom line: We are downgrading our global growth outlook as trade disputes stoke greater macro uncertainty.
We favor reducing risk amid rising protectionism, including raising some cash for U.S.-dollar investors.
BIIM0719U-894993-4/16
vk.com/id446425943
FOR PUBLIC DISTRIBUTION IN THE U.S., HONG KONG, SINGAPORE AND AUSTRALIA.
FOR INSTITUTIONAL, WHOLESALE, QUALIFIED INVESTORS AND PROFESSIONAL AND QUALIFIED CLIENTS IN OTHER PERMITTED COUNTRIES
Themes
Stretching the cycle
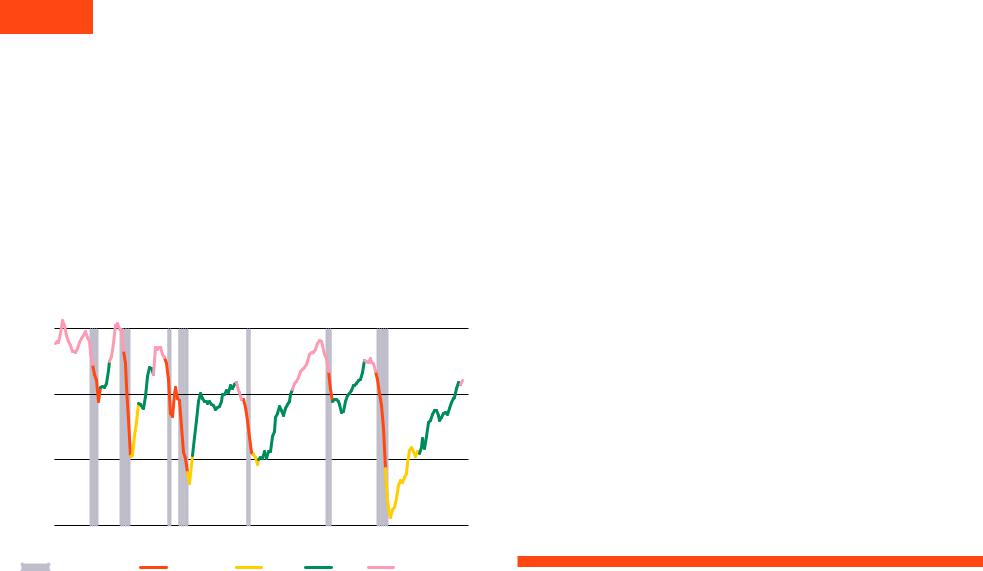
The record-long U.S. economic expansion looks unlikely to run out of steam any time soon. We see a limited near-term risk of the traditional catalysts that bring expansions to an end — financial vulnerabilities leading to dislocations or deleveraging, or economic overheating that prompts central banks to overtighten policy. The U.S. economy has only recently hit full capacity, entering the “late” stage of the cycle that can often run for an extended period. See the Stretching the cycle chart and our Putting economic cycles in context interactive graphic.
Our BlackRock macro dashboard indicates global growth should decelerate further but sees the global expansion running on for longer, with central banks helping support looser financial conditions.
Stretching the cycle
Output gap and stages of the U.S. business cycle, 1965-2019
|
4% |
|
|
|
|
|
Output gap |
0% |
|
|
|
|
|
|
|
|
|
|
|
|
|
-4% |
|
|
|
|
|
|
-8% |
|
|
|
|
|
|
1965 |
1975 |
1985 |
1995 |
2005 |
2015 |
|
U.S. Recession |
Recession |
Early |
Mid |
Late |
|
Sources: BlackRock Investment Institute, with data from Refinitiv Datastream, as of July 2019.
Notes: This chart shows an estimate of the U.S. output gap (that is, GDP as a percentage of potential GDP). We have classified different time periods as belonging to certain stages of the business cycle. The classification of the stage is done via a 'cluster analysis' that groups together time periods where economic series have behaved in similar ways.
The Fed appears ready to counter the downside risks to growth brought about by escalating trade conflicts. Other central banks, including the ECB, have joined the Fed in its commitment to cushion the economy against a slowdown. The Fed is poised to deliver insurance rate cuts as short-term U.S. interest rates still are in accommodative territory below our estimates of neutral rates — those that neither foster nor restrict economic growth.
We see the ECB providing additional stimulus — in the form of a shift in forward guidance, lower rates or a restarting of quantitative easing (QE) — ahead of the end of President Mario Draghi’s term in October. Elsewhere, the Bank of Japan is mulling more stimulus measures as inflation shows no sign of reaching target and the yen has remained strong. Yet it has limited policy room with already sizable asset purchases and a negative policy rate.
The decisively dovish turn in global monetary policy since the start of the year and resulting plunge in bond yields bode well for risk assets, in our view, barring any major escalation in geopolitical tensions. We see asset valuations as reasonable in both equity and credit markets, particularly in a world of structurally lower interest rates over the long run. This argues for maintaining sizable equity exposure, especially to U.S. stocks, and favors high-yielding EM debt because we see income as crucial in a low-yield world. See pages 13-14.
What are the key risks? Global trade and strategic tensions between the U.S. and China could escalate or broaden to the Americas, Europe or other Asian economies. This could hit market sentiment, lead to an extended lull in major economies and weigh on global growth. Even if monetary and fiscal policy support helps extend the life of this cycle, we could still face the prospect of slower growth and higher inflation. Heightened macro uncertainty could also herald a shift to a new regime of more frequent risk asset selloffs and higher financial market volatility. It is why we believe that building portfolio resilience is critical as this cycle continues to age.
Our bottom line: The extended expansion buys investors time to build more resilience into their portfolios.
We remain positive on U.S. equities and see credit as an attractive source of income in a low-yield world.
5 GLOBAL INVESTMENT OUTLOOK — THEMES |
BIIM0719U-894993-5/16 |

vk.com/id446425943
FOR PUBLIC DISTRIBUTION IN THE U.S., HONG KONG, SINGAPORE AND AUSTRALIA.
FOR INSTITUTIONAL, WHOLESALE, QUALIFIED INVESTORS AND PROFESSIONAL AND QUALIFIED CLIENTS IN OTHER PERMITTED COUNTRIES
Themes
Raising resilience
Portfolio resilience is always crucial. Yet greater resilience is called for in a period of elevated macro uncertainty or at a vulnerable stage of the cycle. This is what we refer to as conditional resilience — conditional on how investors assess the current state of the markets. It is about taking a modestly defensive posture against concerns that currently are running higher than usual.
Returns and uncertainty
Expected U.S. dollar-based returns across asset classes on a 10-year horizon
return |
15% |
|
|
|
|
|
|
|
|
|
|
|
|
|
25% |
|
|
|
|
|
|
|
|
|
|
|
|
|
|||||
10% |
|
|
|
|
|
|
|
|
|
|
|
|
|
20% |
||
annualized |
|
|
|
|
|
|
|
|
|
|
|
|
|
|||
5% |
|
|
|
|
|
|
|
|
|
|
|
|
|
15% |
||
Expected |
|
|
|
|
|
|
|
|
|
|
|
|
|
|||
0% |
|
|
|
|
|
|
|
|
|
|
|
|
|
10% |
||
|
|
|
|
|
|
|
|
|
|
|
|
|
|
|||
|
-5% |
|
|
|
|
|
|
|
|
|
|
|
|
|
5% |
|
|
Long-term Treasuries |
DM ex-U.S. govt bonds U.S. inflationlinked bonds |
|
U.S. Treasuries |
U.S. credit |
|
USD EM debt |
U.S. high yield |
U.S. equities |
U.S. small caps |
EM equities |
|
||||
|
|
|
|
|
Local EM debt |
European equities |
||||||||||
|
|
|
Interquartile range |
|
Mean return uncertainty |
Mean expected return |
|
|
||||||||
|
|
|
|
|
|
|||||||||||
|
|
|
|
|
|
|||||||||||
This information is not intended as a recommendation to invest in any particular asset class or strategy. Forecasts are not a reliable indicator of future performance. Source: BlackRock Investment Institute, July 2019. Data as of
February 28, 2019. Notes: The chart shows BlackRock’s capital market assumptions (CMAs), or expected nominal returns across asset classes on a 10-year horizon, in U.S. dollar terms. Our CMAs generate market, or beta, geometric return expectations. Asset return expectations are gross of fees. See page 16 for a list of indices used. The bars represent the uncertainty around our mean return estimates. The lighter, larger bar is based on the 25th and 75th percentile of expected return outcomes — the interquartile range — of thousands of potential return pathways generated by a Monte Carlo simulation. The darker, smaller bar shows the distribution of values around BlackRock’s mean expected returns. The difference in the size of mean return uncertainty between assets comes down to particularities of each asset class, including the ability to estimate returns and data availability. Indices are unmanaged and used for illustrative purposes only. They are not intended to be indicative of any fund or strategy’s performance. It is not possible to invest directly in an index.
6 GLOBAL INVESTMENT OUTLOOK — THEMES
Our market views (pages 12-15) reflect such a stance because of rising protectionism and geopolitical frictions. Lowering risk is one dimension of conditional resilience; seeking protection is the other. We believe government bonds play an important role in portfolios by serving as a buffer against selloffs of risk assets. We see them as crucial diversifiers. See page 9.
Unconditional resilience refers to investors acknowledging there is always fundamental uncertainty about long-term returns, irrespective of the stage of the economic or market cycle they believe they are in. Relying on historical data alone is not enough to inform views for strategic, or long-term, investing horizons, in our view.
Consider the different paths of two economies that looked very similar at the end of the 19th century: the U.S. and Argentina. With the benefit of hindsight, it's easy to suppose that the choice between them was obvious. But for investors at the time, armed only with what they had observed until then, it would not have been. Fundamental uncertainty is greater than what a look in the rear view mirror implies.
Risks tied to deglobalization and climate change — such as those detailed in Getting physical of April 2019 — represent such long-term uncertainty. This is why our approach to portfolio construction looks at multiple potential return pathways.
In a world where powerful long-term trends are playing out over decades, assuming certainty about average long-term returns seems problematic. We incorporate uncertainty in our long-term return expectations as a result. See the Returns and uncertainty chart.
The wider uncertainty bands, such as for U.S. small cap or EM equities, represent asset classes where we have lower conviction about our mean return estimates. An asset allocation process that incorporates such uncertainty results in a more diverse portfolio than typical approaches that assume long-run returns are known with precision, in our view.
Our bottom line: Embracing inherent uncertainty about the future is the cornerstone of our revamped approach to portfolio construction and our capital market assumptions – and fundamental to creating portfolio diversification.
Government bonds can play a key role in building portfolio resilience – tactically and strategically.
BIIM0719U-894993-6/16
vk.com/id446425943
FOR PUBLIC DISTRIBUTION IN THE U.S., HONG KONG, SINGAPORE AND AUSTRALIA.
FOR INSTITUTIONAL, WHOLESALE, QUALIFIED INVESTORS AND PROFESSIONAL AND QUALIFIED CLIENTS IN OTHER PERMITTED COUNTRIES
Focus
Geopolitics
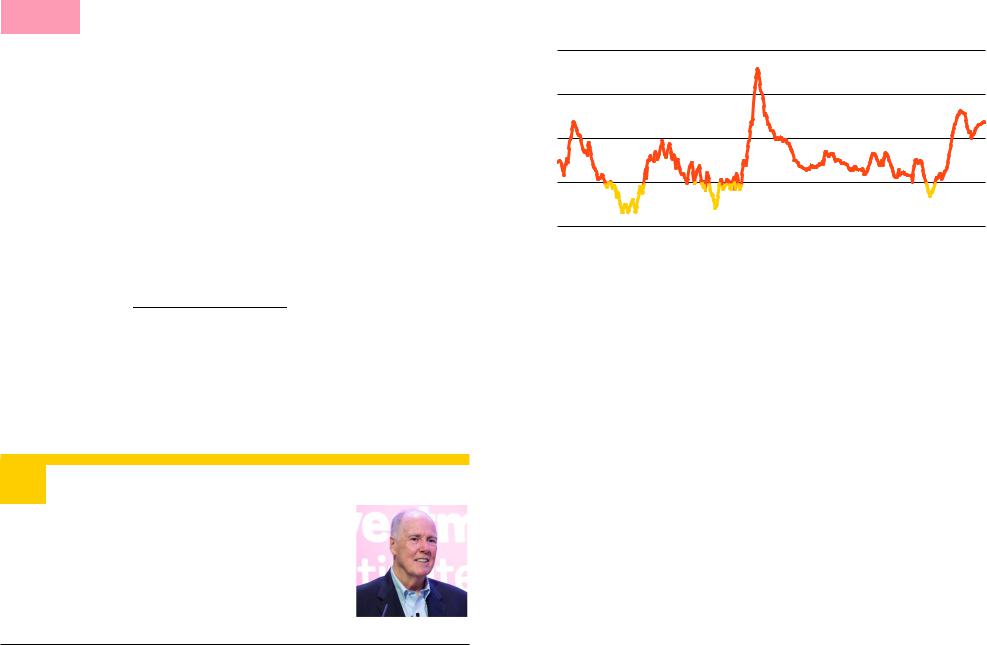
We see geopolitical risk as a material market factor in 2019. The market impact of geopolitical risks has historically tended to be more acute when economies are slowing, our research suggests. See Gauging geopolitics of June 2019 for details. The U.S. has become an exporter of geopolitical and economic uncertainty as the administration implements its “America First” approach. We believe this represents a transition away from the largely cooperative post-Cold War period to a more competitive international environment, with the return of Great Power politics.
Tough rhetoric from both the U.S. and China, tit-for-tat tariffs and tensions over U.S. restrictions on Chinese tech signal an economic conflict that will be difficult to meaningfully resolve — temporary trade truces notwithstanding. We see tensions between the U.S. and China as structural and long-lasting, with economic and security interests increasingly intertwined. Market attention to the U.S.-China competition risk on our Geopolitical risk dashboard has been rising, as the countries compete to dominate the industries of the future. See the Rising up chart.
We see the U.S.-Mexico trade relationship as durable but believe the recent U.S. threat to impose tariffs on imports dims prospects for the passage of the revamped North America trade deal before the 2020 elections — and reduces incentives for other countries to negotiate trade agreements with the U.S. Global trade tensions could rise further if the U.S. implements tariffs on imported autos and parts from Europe or Japan — or resorts more often to tariffs to achieve political goals.
“ |
Author |
The U.S. has become an exporter of |
|
|
geopolitical and economic uncertainty |
|
as the administration implements its |
|
“America First” approach. |
|
Tom Donilon |
|
Chairman, BlackRock Investment Institute |
”
Rising up
BlackRock Geopolitical Risk Indicator for U.S.-China competition, 2005-2019
|
6 |
|
|
|
|
|
|
|
|
4 |
|
|
|
|
|
|
|
Score |
2 |
|
|
|
|
|
|
|
|
|
|
|
|
|
|
|
|
|
0 |
|
|
|
|
|
|
|
|
-2 |
|
|
|
|
|
|
|
|
2005 |
2007 |
2009 |
2011 |
2013 |
2015 |
2017 |
2019 |
Source: BlackRock Investment Institute, with data from Refinitiv, July 2019. Notes: We identify specific words related to geopolitical risk in general and to our top-10 risks. We then use text analysis to calculate the frequency of their appearance in the Refinitiv Broker Report and Dow Jones Global Newswire databases as well as on Twitter. We then adjust for whether the language reflects positive or negative sentiment, and assign a score. A zero score represents the average BGRI level over its history from 2003 up to that point in time. A score of one means the BGRI level is one standard deviation above the average. We weigh recent readings more heavily in calculating the average. We recently improved the methodology of our global BGRI, tying it closely to our other risks and updating the keywords. The chart may look different from previous updates as a result. The BGRI’s risk scenario is for illustrative purposes only and does not reflect all possible outcomes as geopolitical risks are ever-evolving.
Global trade is not the only geopolitical risk facing markets. In the Gulf, the U.S. has intensified its maximum pressure campaign against Iran, affecting both the Iranian economy and currency. We for now believe this is unlikely to spiral into general conflict, but worry that escalation on both sides has increased the risk of significant incidents.
Our indicators also point to heightened market attention to the risk of European fragmentation. The Oct. 31 deadline for Brexit is a risk on the horizon, and uncertainty over the long-term UK-European Union (EU) relationship is elevated. European parliamentary elections delivered a mixed result that saw anti-EU populist and other parties gain at the expense of mainstream ones. Another lingering risk: Tensions related to Italian budget talks are likely to bubble up in coming months.
7 GLOBAL INVESTMENT OUTLOOK — FOCUS |
BIIM0719U-894993-7/16 |
vk.com/id446425943
FOR PUBLIC DISTRIBUTION IN THE U.S., HONG KONG, SINGAPORE AND AUSTRALIA.
FOR INSTITUTIONAL, WHOLESALE, QUALIFIED INVESTORS AND PROFESSIONAL AND QUALIFIED CLIENTS IN OTHER PERMITTED COUNTRIES
Focus
China’s economy
Economic activity in China has faltered on the back of an escalation in trade tensions, and we see limited near-term upside in growth. Policy stimulus is likely to help offset any trade shocks but not deliver a meaningful growth boost. Why? The fallout from the U.S.-China rivalry threatens a renewed downturn. Confidence in both the corporate and household sector is currently running low — one reason why the current recovery appears anemic, even after significant stimulus in late 2018. See the Turning it around chart.
We expect Chinese policymakers to revert to trusted tools such as infrastructure spending and other fiscal stimulus to counter the slowdown. We see significant monetary easing or a sharp currency depreciation as unlikely. This would run counter to Beijing’s prime objective to maintain financial stability and prevent a rerun of the destabilizing capital outflows seen in 2015-2016.
How big could the trade shock get? Estimates of the net impact on economic growth vary and are often based on models that find it difficult to quantify the fallout of trade disruptions. This suggests risks could be skewed to the downside. The shake-up of longstanding supply chains could disrupt corporate spending plans, while a softer job market could pressure consumer spending.
Authors
|
|
|
Elga Bartsch |
Ben Powell |
|
Head of Macro Research |
Chief Asia-Pacific Strategist |
|
BlackRock Investment Institute |
BlackRock Investment Institute |
|
Turning it around
China fiscal and monetary stimulus and trade tensions gauge, 2014-2019
1.5 |
|
|
|
|
6% |
ofshareweightedasStimulus |
levelgaugeTensions |
Fiscal impulse |
|
|
|
|
|
|
|
|
|
|
|
|
0.75 |
|
|
|
|
3% |
|
|
Credit impulse |
|
|
|
|
|
0 |
|
|
|
|
0% |
|
-0.75 |
|
|
|
|
-3% |
GDP |
|
|
|
U.S.-China tensions gauge |
|
||
|
|
|
|
|
||
-1.5 |
|
|
|
|
-6% |
|
2014 |
2015 |
2016 |
2017 |
2018 |
2019 |
|
Sources: BlackRock Investment Institute, National Bureau of Statistics of China and the People's Bank of China, with data from Refinitiv Datastream, July 2019. Notes: The fiscal impulse is defined as the 12-month change in the annual fiscal deficit as a percentage of GDP. The fiscal deficit includes spending from China's general government fund. The credit impulse is defined as the 12-month change in the rate of broad credit growth as a share of GDP. We weight both the fiscal and credit impulse to reflect their respective contributions to GDP growth – as estimated in a December 2017 IMF paper. The trade tensions gauge measures the principal driver of U.S.- and China-sensitive financial instruments, including U.S. tech shares, the MSCI China, copper, USD/CNY, EM credit spreads and U.S. high-yield spreads. We strip out the influence of global growth (with our G7 Growth GPS) and market liquidity (U.S. interest rate volatility) to gain a measure of to what extent markets are pricing in U.S. -China tensions. The index is expressed as a z-score (five-week moving average), in standard deviations above or below the historical mean.
A. more subdued outlook for Chinese growth could cut short the boost in activity we had expected for the rest of the world, particularly the eurozone and EMs. European manufacturing activity and capital spending are closely correlated with export orders from China, as we have previously shown.
The uncertain macro outlook keeps us broadly underweight Chinese and Chinarelated assets in the short run (see pages 12-14). Yet we see the gradual opening up of China’s onshore markets — and their increasing weight in global bond and equity indexes — as important sources of diverse returns for investors in the medium term. Consumer-oriented services such as advertising, healthcare, or insurance have room to grow and are now more accessible to foreign investors.
8 GLOBAL INVESTMENT OUTLOOK — FOCUS |
BIIM0719U-894993-8/16 |
vk.com/id446425943
FOR PUBLIC DISTRIBUTION IN THE U.S., HONG KONG, SINGAPORE AND AUSTRALIA.
FOR INSTITUTIONAL, WHOLESALE, QUALIFIED INVESTORS AND PROFESSIONAL AND QUALIFIED CLIENTS IN OTHER PERMITTED COUNTRIES
Focus
Coping with low yields
The plunge in bond yields, including 10-year German bunds trading at record low negative levels, is creating more challenges for investors in an already yield-starved world. About half of developed market bonds currently yields less than 1%, with more than a quarter in negative territory. See the Sub-zero chart. This raises questions about the role that government bonds play in a portfolio.
We believe government bonds retain a core role for their diversification benefits. Even at these low yields — and with lower prospective returns – government bonds can act as ballast. They help offset the impact of equity selloffs in an environment of rising macro uncertainty, we believe. That diversification benefit outweighs the yield pickup from credit — a view reflected in our long-term allocation preferences. Yet we also note that the cost of this protection is higher and the risk/reward tradeoff is different on a near-term horizon. For that reason, we have downgraded U.S. Treasuries and are overall more positive on credit on a tactical basis. See pages 12 and 13 for details
We see more uncertainty about inflation in the medium term at a time when inflation expectations have plunged. The reasons are expansionary monetary and fiscal policies, combined with a possible gradual reversal of the globalization trends that have long kept a lid on prices. The latter is subject of internal debate at BlackRock. See page 10. All in all, we believe inflation-protected securities can play a more sizeable role within long-term government bond allocations.
Sub-zero
Developed market government bond yield distribution, 2014-2019
Over 4%
100%
3% to 4%
75% |
|
|
|
|
2% to 3% |
|
|
|
|
1% to 2% |
|
||
|
|
|
|
|
||
50% |
|
|
|
|
|
|
|
|
|
|
Zero to 1% |
|
|
|
|
|
|
|
|
|
25% |
|
|
|
|
|
|
|
|
|
|
Negative |
|
|
|
|
|
|
|
|
|
0% |
|
|
|
|
|
|
|
|
|
|
|
|
|
2014 |
2015 |
2016 |
2017 |
2018 |
2019 |
|
Past performance is not a reliable indicator of current or future results. Source: BlackRock Investment Institute, with data from J.P. Morgan and Refinitiv Datastream, July 2019. Notes: The chart areas show the share of bonds by market value within the J.P. Morgan Global Developed Bond Index with yields in each range. Indexes are unmanaged. It is not possible to invest directly in an index.
“Expected correlations between key asset classes are the main driver of building resilient portfolios. It’s not just about returns.
Vivek Paul
Portfolio research, BlackRock Investment Institute
U.S. Treasuries can provide diversification for long-term eurozone investors. The drop in German bund yields suggests that some eurozone government bond yields may be getting closer to an effective lower bound. This means they offer diminishing room for diversification, having less room to gain when equities slide. We view U.S. Treasuries as an alternative if eurozone rates fall further. This is about increasing diversification; not about capitalizing on higher yields as hedging costs for eurozone investors quickly wipe out any yield pickup. We again see the balance of risks tilted the other way in the short term and have upgraded eurozone
sovereigns in light of imminent ECB easing (pages 12 ands 13).
”
9 GLOBAL INVESTMENT OUTLOOK — FOCUS |
BIIM0719U-894993-9/16 |
vk.com/id446425943
FOR PUBLIC DISTRIBUTION IN THE U.S., HONG KONG, SINGAPORE AND AUSTRALIA.
FOR INSTITUTIONAL, WHOLESALE, QUALIFIED INVESTORS AND PROFESSIONAL AND QUALIFIED CLIENTS IN OTHER PERMITTED COUNTRIES
Forum debate
Inflation
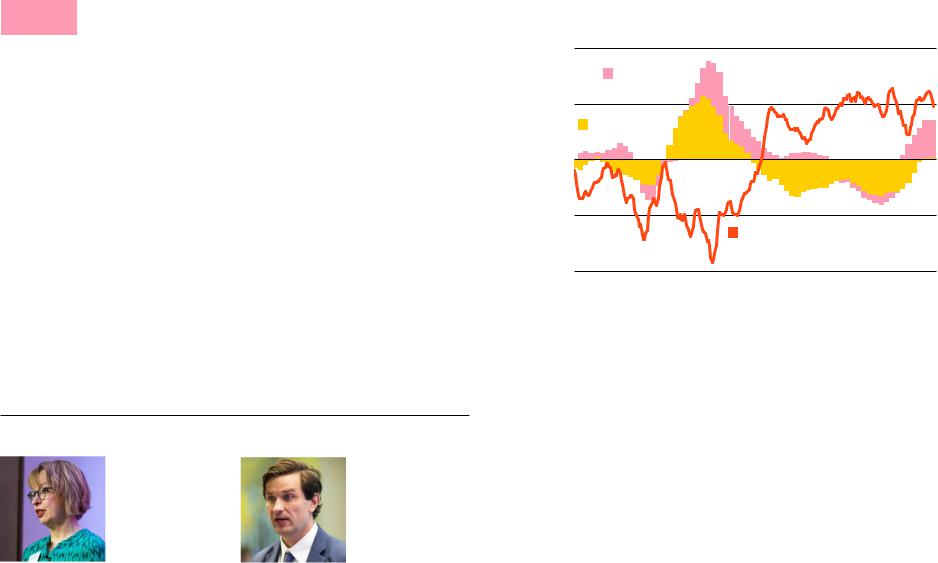
Low inflation has been a hallmark of globalization as the world’s productive capacity has increased rapidly. Investors have become used to a world where inflation is low and inflation surprises are almost always to the downside. Our gauge of inflation shocks in the top chart below shows how inflation has mostly come in below expectations since the 1980s. This has arisen in an environment largely devoid of negative macro supply shocks — such as the oil shocks of the 1970s — that push growth lower and inflation higher. And growth disappointments have tended to come with lower inflation — characteristic of demand shocks.
Lowflation regime
U.S. inflation shocks and the government bond-equity correlation, 1965-2019
|
3 |
|
|
|
|
|
|
points |
|
|
|
|
|
|
|
Percentage |
0 |
|
|
|
|
|
|
|
|
|
|
|
|
|
|
|
-3 |
|
|
|
|
|
|
|
0.8 |
|
|
|
|
|
|
Correlation |
0 |
|
|
|
|
|
|
|
|
|
|
|
|
|
|
|
-0.8 |
|
|
|
|
|
|
|
1965 |
1974 |
1983 |
1992 |
2001 |
2010 |
2019 |
“ |
Long term, I don’t see deglobalization as |
|
|
||
an inflation shock. It is more a price-level |
|
|
|
shock that’s negative for growth. |
|
|
Rupert Harrison |
|
|
Head of Research, Diversified Strategies |
|
|
BlackRock Multi-Asset Strategies |
|
|
|
|
How does a U.S.-China trade war end? Both could declare victory, or it could lead to a cold war that destroys the benefits of globalization.
Stanley Fischer
Senior Advisor
BlackRock Investment Institute
”
As a result, bonds have tended to cushion portfolios during equity selloffs in this period. The bottom chart shows the negative correlation between stock and bond returns has occurred during a period of low inflation. The risk? Trade protectionism and deglobalization could unwind some of these benefits over time and serve as a negative supply shock that raises prices, slows productivity growth and lowers economic output — an outcome investors haven’t had to worry about for decades.
This has important portfolio construction implications. It means that we could see periods of lower growth and higher inflation, pushing bond and equity returns lower. This would reduce the desirability of holding bonds in a portfolio to offset pullbacks in equities.
Not all of us are convinced. Another camp believes deglobalization will force a gradual realignment of global supply chains and the abandonment of manufacturing capacity, leading to disinflation. The debate shows there’s much uncertainty around long-term inflation risks, even if we see them tilted upwards.
Sources: BlackRock Investment Institute, U.S. Bureau of Economic Analysis and U.S. Bureau of Labor Statistics, with data from Haver Analytics and Refinitiv Datastream, July 2019. Notes: The top chart shows We the difference between the actual and expected inflation outcomes. We use a statistical model to estimate inflation expectations back to 1965, drawing on the relationship between the actual U.S. Consumer Price Index (CPI), GDP and policy interest rates over trailing three-year periods. We use these regressions to estimate the expected annual inflation rate in three months' time. The bottom chart shows the correlation of the U.S. 10-year Treasury and the S&P 500 Index over rolling three-year periods based on monthly readings. A correlation reading of 1 suggests the two move in lockstep, and a reading of -1 suggests their movements are completely opposite.
Repeated downside inflation surprises have convinced markets price pressures are a thing of the past. We believe risks to inflation are more two-way and could surprise on the upside, marking a regime change from recent decades.
10 GLOBAL INVESTMENT OUTLOOK — DEBATE |
BIIM0719U-894993-10/16 |