

Gazprom_investor_day_2019_presentation_watermark
.pdfvk.com/id446425943
FROM PEAK
INVESTMENTS
TO HIGHER FCF

vk.com/id446425943
DISCLAIMER
This presentation, including a hard copy of these slides, the information communicated during any delivery of the presentation, both oral and written, and any question and answer session and any document or material distributed at or in connection with the presentation and all information contained therein including any information provided by or obtained from third parties (together, "Presentation") has been prepared by PJSC Gazprom and its consolidated subsidiaries (together, the "Company") solely for the purpose of presenting information about the Company to a number of parties who have expressed an interest in obtaining information about the Company. By attending the presentation, you agree to be bound by the following terms. This Presentation may not be reproduced, retransmitted or further distributed to the press or any other person or published, in whole or in part, for any purpose. Failure to comply with this restriction may constitute a violation of the applicable securities laws. This Presentation does not constitute or form part of any offer or invitation to sell or issue, or any solicitation of any offer to purchase or subscribe for, any shares or other securities representing shares in the Company, nor shall it, any part of it or the fact of its Presentation or distribution form the basis of, or be relied on in connection with, any contract or investment decision. No reliance may be placed for any purposes whatsoever on the information or opinions contained in this Presentation, or any other material discussed at the presentation or on its completeness, accuracy or fairness. The information in this Presentation should not be treated as giving investment advice. To the extent available, the industry, market and competitive position data contained in this Presentation come from official or third party sources. Care has been taken to ensure that the facts stated in this Presentation are accurate, and that the opinions expressed are fair and reasonable. However, the contents of this Presentation have not been verified by the Company. To the extent third party industry publications, studies and surveys generally state that the data contained therein have been obtained from sources believed to be reliable, but that there is no guarantee of the accuracy or completeness of such data. Accordingly, undue reliance should not be placed on any of the industry, market or competitive position data contained in this presentation. The information contained herein is subject to change without notice. None of the Company or any of its managers or directors are under an obligation to update or keep current the information contained in this Presentation. Accordingly, no representations or warranties of any kind are made by any person as to the accuracy of such statements, estimates or projections, or that any of the events expressed or implied in any such statements, estimates, opinions or projections will actually occur. The Company is not under any obligation, and expressly disclaims any intention, to update or revise any such statements, estimates or projections. No statement in the Presentation is intended as a profit forecast or a profit estimate. Neither the Company, any third party, nor any of their respective directors, officers, partners, employees, agents, affiliates, representatives or advisors, accept any duty or responsibility to you, whether in contract or in tort (including without limitation, negligence and breach of statutory duty), misrepresentation, restitution or otherwise (in each case whether caused by negligence or otherwise) and shall, to the fullest extent permissible by law, not be liable in respect of any loss, damage or expense of whatsoever nature, howsoever caused, whether by any use you may choose to make of the Presentation or any reliance placed upon the Presentation or its contents or which is otherwise consequent upon the provision of the Presentation to you.
This presentation includes "forward-looking statements," which include all statements other than statements of historical facts, including, without limitation, any statements that are preceded by, followed by or include the words "targets," "believes," "expects," "aims," "intends," "will," "may," "anticipates," "would," "plans," "could" or similar expressions or the negative thereof. Such forward-looking statements involve known and unknown risks, uncertainties and other important factors beyond the Company's control that could cause the actual results, performance or achievements of the Company to be materially different from future results, performance or achievements expressed or implied by such forward-looking statements. Such forward looking statements are based on numerous assumptions regarding the Company's present and future business strategies and the environment in which the Company will operate in the future. By their nature, forward-looking statements involve risks and uncertainties because they relate to events and depend on circumstances that may or may not occur in the future. Accordingly, any reliance you place on such forward-looking statements will be at your sole risk. These forward-looking statements speak only as at the date as of which they are made, and neither the Company or any of its respective agents, employees or advisors intends or has any duty or obligation to supplement, amend, update or revise any of the forward-looking statements contained herein to reflect any change in the Company's expectations with regard thereto or any change in events, conditions or circumstances on which any such statements are based. In addition, even if the Company's results of operations, financial condition and liquidity and the development of the industry in which the Company operates are consistent with the forward-looking statements contained in this Presentation, those results or developments may not be indicative of results or developments in future periods. The information and opinions contained in this Presentation are provided as at the date of this Presentation and are subject to change without notice. No person is under any obligation to update or keep current the information contained herein.
2 |
|
STRATEGY |
|

vk.com/id446425943
PRESENTATION SPEAKERS
|
|
|
|
|
|
|
|
GAS |
BUSINESS |
EXPORT |
|
OIL BUSINESS |
FINANCE |
|
|
DEVELOPMENT |
|
|
|
|
|
|
|
STRATEGY |
|
|
|
|
|
|
|
|
|
|
|
|
|
|
|
MR. OLEG AKSYUTIN |
MSR.ELENAALEXANDERBURMISTROVAMEDVEDEV |
MR. ALEXEY YANKEVICH |
MR. ANDREY KRUGLOV |
||||
Member of the Management |
DireceputoryChairmGeneral,n of the |
Member of the Management |
Deputy Chairman of the |
||||
Committee, Head of |
ManagementGazprom ExportCommittee, |
Board and CFO, Gazprom Neft |
Management Committee, CFO, |
||||
Department, Gazprom |
Gazprom |
|
|
Gazprom |
|||
SLIDE 4 |
SLIDE 17 |
SLIDE 27 |
SLIDE 43 |

vk.com/id446425943
GAS BUSINESS
DEVELOPMENT
STRATEGY
MR. OLEG AKSYUTIN
Member of the Management
Committee, Head of Department,
Gazprom
vk.com/id446425943
NATURAL GAS IS THE RESOURCE OF THE FUTURE
|
BY 2035, NATURAL GAS DEMAND WILL |
|
|
|
|
BY 2035, THE SHARE OF NATURAL GAS |
||||||||||||||
|
INCREASE BY A THIRD AND OVERTAKE COAL |
|
IN THE GLOBAL FUEL MIX WILL REACH ¼ |
|||||||||||||||||
|
|
|
|
|
|
|
|
|
|
|
|
|
|
|
|
|
|
|||
|
|
|
|
|
|
|
|
|
|
|
|
|
|
|
|
|
|
|
|
|
|
|
|
|
|
|
|
|
|
|
|
|
|
|
|
|
|
|
|
|
|
|
|
|
|
|
|
|
+33% |
|
|
|
|
|
|
|
|
|
23 % |
|
||
|
|
|
|
|
|
|
|
|
|
|
|
|
|
|
||||||
|
GAS |
|
20181 |
|
|
|
|
|
|
|
|
|
|
|
|
|
|
|
||
|
|
|
|
|
|
|
|
|
|
|
|
|
|
|
|
|
|
|
||
|
|
2035 |
|
|
|
|
|
|
|
|
|
|
|
|
|
|
|
|
|
|
|
|
|
|
|
|
|
|
|
|
|
|
|
|
|
|
|
|
|
|
|
|
|
|
|
|
|
|
|
|
|
|
|
|
|
|
14.4 |
25 % |
||||
|
|
|
|
|
|
|
|
|
|
|
|
|
|
|
||||||
|
|
|
|
|
|
|
|
|
|
|
|
|
|
|
||||||
|
|
|
|
|
|
|
|
|
|
|
|
|
|
|
|
|
bn toе |
|
|
|
|
|
|
|
|
|
|
|
|
|
|
|
|
|
|
|
|
|
|
|
|
COAL |
|
2018 |
|
|
|
|
|
|
|
|
|
|
|
|
|
|
|
|
|
|
|
|
|
|
|
|
|
|
|
|
|
|
|
|
|
|
17.3 |
||||
|
2035 |
|
|
|
|
|
|
|
|
|
|
|
2018 |
|||||||
|
|
|
|
|
|
|
|
|
|
|
|
|
|
|||||||
|
|
|
|
|
|
|
|
|
|
|
|
|
|
|
|
|
bn toе |
|||
|
|
|
|
|
|
|
|
|
|
|
|
|
|
|
|
|
|
|
|
|
|
|
|
|
|
|
|
|
|
|
|
|
|
|
|
|
|
|
|
|
|
|
|
|
|
|
|
|
|
|
|
|
|
|
|
|
|
|
|
|
|
|
|
OIL |
|
2018 |
|
|
|
|
|
|
|
|
|
|
|
|
|
|
|
|
|
|
|
|
|
|
|
|
|
|
|
|
|
|
|
|
|
|
|
|
|
|
|
2035 |
|
|
|
|
|
|
|
|
|
|
|
|
|
|
|
|
|
||
|
|
|
|
|
|
|
|
|
|
|
|
|
|
|
|
|
|
|
|
|
|
|
|
|
|
|
|
|
|
|
|
|
|
|
|
|
|
|
2035 |
||
|
|
|
|
|
|
|
|
|
|
|
|
|
|
|
|
|
|
|||
|
|
|
|
|
|
|
|
|
|
|
|
|
|
|
|
|
|
|||
|
|
|
|
|
|
|
|
|
|
|
|
|
|
|
|
|
|
|
||
|
bn toe 0 |
1 |
2 |
3 |
4 |
|
|
|
5 |
|
|
|
|
Natural gas |
|
|
Othеr еnеrgy sourcеs |
|||
|
|
|
|
|||||||||||||||||
|
|
|
|
|
|
|
|
|
|
|
|
|
|
|
|
|
|
|
||
|
|
Sources: Gazprom, Cedigaz, GECF, IHS Markit, IEA, Wood Mackenzie |
|
|
|
|
|
|
||||||||||||
1 |
The data for 2018 is preliminary; data is rounded |
|
|
|
|
|
|
|
|
|
||||||||||
NATURAL GAS CONSUMPTION WILL INCREASE BY 1.3 TCM; ~30% OF INCREASE WILL ORIGINATE IN CHINA
tcm |
|
|
|
|
|
|
|
|
5.5 |
|
|
|
|
2035 |
|||
|
|
|
|
|||||
|
|
|
|
|
||||
|
|
|
|
|
|
5.1 |
||
|
|
|
|
|
CHINA |
|||
|
|
|
|
|
|
|
||
4.5 |
|
|
|
|
|
|
|
|
|
|
|
Othеr |
|
|
|
+1.3 |
|
|
|
|
|
|
|
|||
|
|
|
|
|
||||
|
|
|
|
|
|
|
|
|
|
|
|
|
countriеs |
3.8 |
|||
|
|
|
|
|
||||
|
|
|
|
|
||||
3.5 |
|
|
|
|
2018 |
|||
|
|
Consumption |
|
|
|
|
|
|
|
|
|
|
|
|
|
|
|
|
|
|
in 2018 |
|
|
|
|
|
2.5 |
|
|
|
|
|
|
|
|
|
|
|
|
|
|
|
|
|
5 |
|
STRATEGY |
|

vk.com/id446425943
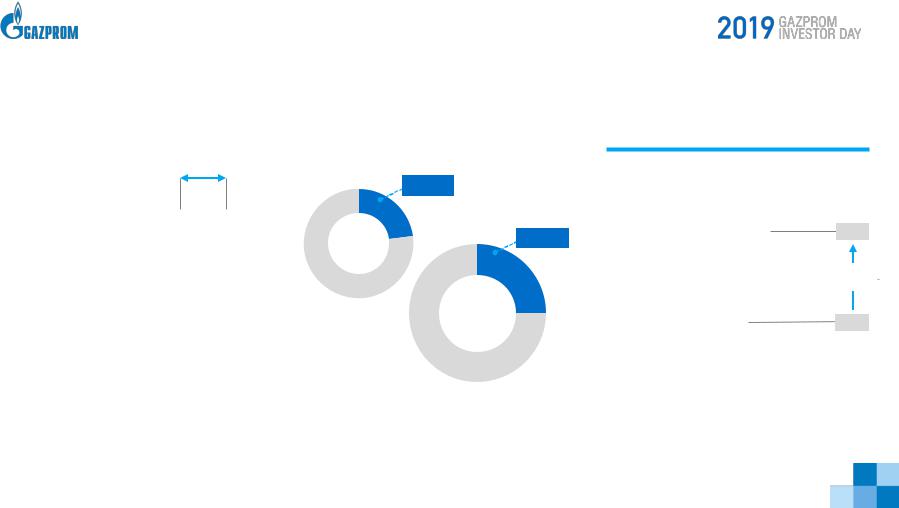
GAZPROM: THE GLOBAL ENERGY MARKET LEADER
|
|
|
|
|
NATURAL GAS |
35 tcm |
|
|
|
|
|
RESERVES |
17% of global reserves |
|
|
|
|
|
||
|
|
|
|
|
NATURAL GAS |
497.6 bcm |
|
|
|
|
|
||
|
|
|
|
|
||
|
|
|
|
|
PRODUCTION |
12% of global volumes |
#1 |
|
SHARE OF |
100% |
|||
|
CONVENTIONAL |
|||||
IN THE WORLD |
PRODUCTION |
|
||||
|
|
|||||
|
|
|
|
|
EXPORTS |
201.8 bcm1 |
|
|
|
|
|
|
|
|
|
1967 |
|
2003 |
|
2009 |
2018 |
|
|
|
|
|||||
|
START OF THE RUSSIAN |
|
START OF RISK- |
|
FIRST RUSSIAN LNG |
|
|
|
|
|
|
|
|||
|
GAS SUPPLIES TO |
|
FREE SUPPLIES |
|
PLANT LAUNCH |
|
|
|
|
|
|
||||
|
EUROPE |
|
|
|
|
|
|
1Pipeline exports to far-abroad countries
2The quoted figures indicate annual transportation volumes after reaching design capacity
EXPANSION OF RISK-FREE |
ENTRY TO THE CHINESE |
EXPORT ROUTES TO EUROPE |
MARKET VIA THE PIPELINE |
NORD STREAM 22 |
|
+55 BCM |
POWER OF SIBERIA |
TURKSTREAM |
+38 BCM |
|
|
+31.5 BCM |
|
DIVERSIFICATION AND IMPROVEMENT OF EXPORT EFFICIENCY
2019 |
2020-2035 |
|
|
|
FURTHER STRENGTHENING OF LEADING |
|
POSITION AMONG GLOBAL ENERGY COMPANIES |
|
6 |
|
STRATEGY |
|
vk.com/id446425943
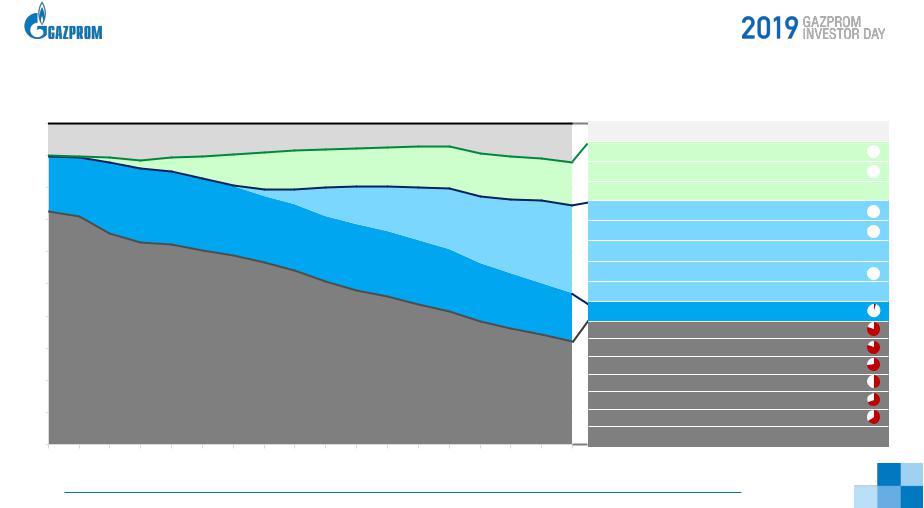
NATURAL GAS PRODUCTION STRATEGY: GROWTH AND DIVERSIFICATION
100% |
|
|
|
|
|
|
|
|
OTHER REGIONS |
|
|
90% |
|
|
|
|
|
|
|
|
EAST SIBERIA AND THE FAR EAST |
|
|
80% |
|
|
|
|
|
70% |
|
|
YAMAL |
|
|
|
|
|
(TO BE LAUNCHED) |
|
|
60% |
|
|
|
|
|
|
|
|
YAMAL |
|
|
50% |
|
|
(IN OPERATION) |
|
|
40% |
|
NADYM–PUR–TAZ |
|
||
30% |
|
|
|
|
|
20% |
|
|
|
|
|
10% |
|
|
|
|
|
0% |
|
|
|
|
|
0% |
2020 |
|
|
2035 |
|
2018 |
2025 |
2030 |
|||
|
2035 |
||||
|
1 |
As of 2018 |
7 |
2 |
This category also includes production of associated gas by Gazprom Neft |
|
|
Depletion level1
Orenburg, Astrakhan, Shtokman and other regions2
Chayanda, Kovykta
Kirinskoye, Yuzhno-Kirinskoye
other fields
Malyginskoye
Tambeyskoye
Kharasaveyskoye (cenoman-aptian and neocom-jur.) 
Bovanenkovo (neocom-jurassic)
other fields
Bovanenkovo (cenoman-aptian)
Urengoyskoye (cenoman)
Medvezhye (cenoman)
Yamburg (cenoman)
Zapolyarnoye (cenoman)
Yubileynoye
Yamsoveyskoye
other fields
STRATEGY
vk.com/id446425943
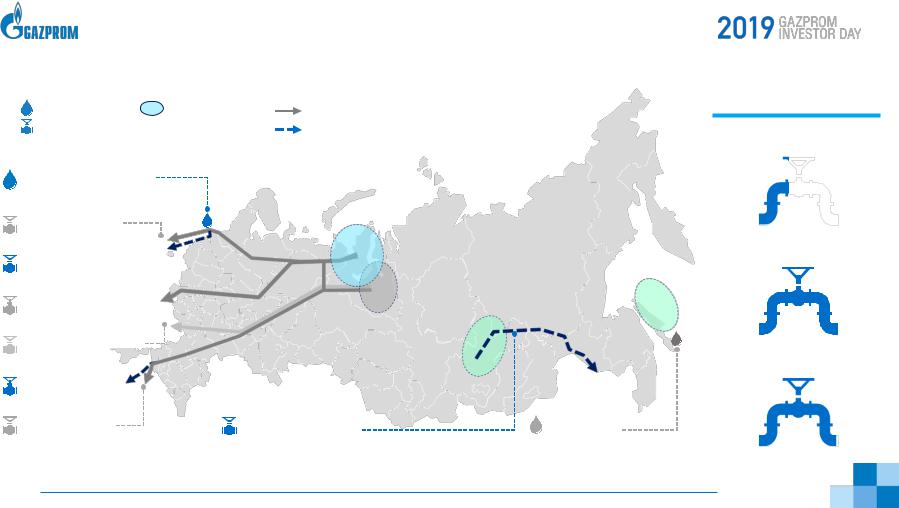
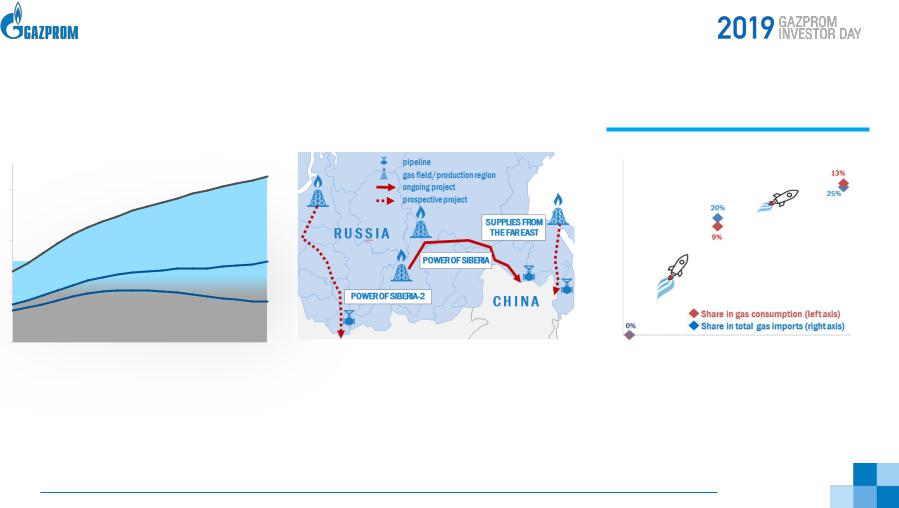
KEY EXPORT ROUTES: LOOKING WEST AND EAST
LNG plant |
Production region |
Existing project |
Export pipeline |
1.5 mtpa Nominal capacity |
Project under construction |
|
|
|
LNG Portovaya CS
1.5 mtpa
Nord Stream1
55 bcm
Nord Stream 2
55 bcm
Yamal – Europe
33 bcm
Central Corridor2
n/a
TurkStream 
31.5 bcm
Blue Stream
16 bcm
YAMAL
EAST SIBERIA AND THE FAR EAST
NADYM–PUR–TAZ
Power of Siberia |
Sakhalin–2 |
38 bcm |
9.6 mtpa |
1 The sum оf pipeline transport capacities does not equal to Gazprom’s full export capacity due to only largest infrastructureprojects being shown on the graph.
2 Capacity of the Central Corridor remains unclear due to lack of accurate data on current state of the Ukrainian pipeline system.
3 As for 20.02.2019, construction status of Nord Stream 2, TurkStream (offshore part), “Chayanda field – Russia-China border” part of Power of Siberia pipeline.
8
PIPELAY COMPLETION3
NORD STREAM 2: >30 %
TURKSTREAM:
100%
POWER OF SIBERIA: >99%
STRATEGY
vk.com/id446425943
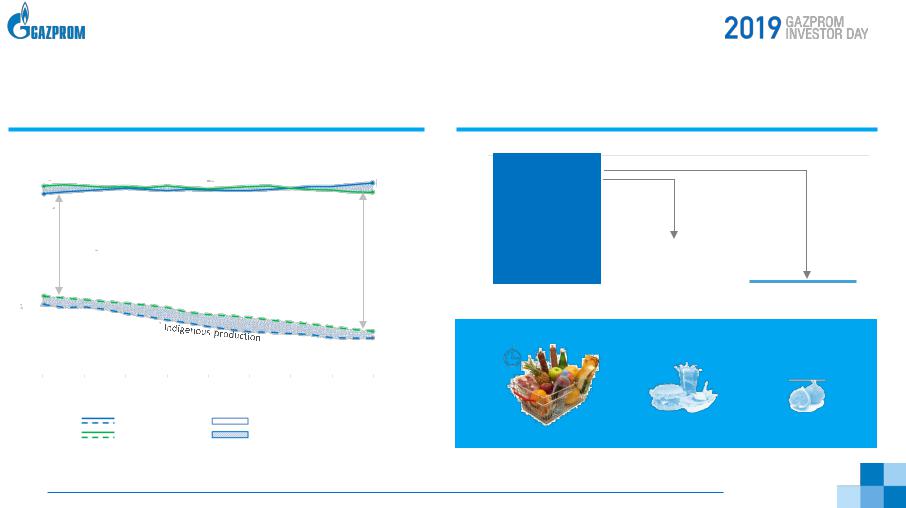
GAZPROM IN EUROPE: STRENGTHENING PARTNERSHIP
EUROPEAN GAS DEMAND AND IMPORTS OUTLOOK
bcm |
|
|
|
|
|
|
|
|
|
|
|
|
|
|
600 |
550 |
|
|
Natural gas demand |
|
|
|
559 |
||||||
500 |
527 |
|
|
|
|
|
|
|
|
532 |
||||
|
|
|
|
|
|
|
|
|
|
|
|
|||
400 |
|
|
|
322-324 |
|
|
|
|
|
|
407-454 |
|
|
|
|
|
|
|
|
|
NATURAL GAS IMPORTS |
|
|
|
|||||
|
|
|
|
|
bcm |
|
|
bcm |
|
|
||||
300 |
|
|
|
|
|
|
|
|
|
|
|
|||
|
|
|
|
|
|
|
|
|
|
|
|
|
||
|
228 |
|
|
|
|
|
|
|
|
|
|
|
||
200 |
203 |
|
|
|
|
|
|
|
|
|
||||
|
|
|
|
|
|
|
|
|
125 |
|||||
|
|
|
|
|
|
|
|
|
|
|
|
|
||
100 |
|
|
|
|
|
|
|
|
|
|
|
105 |
||
|
|
|
|
|
|
|
|
|
|
|
|
|
||
0 |
|
|
|
|
|
|
|
|
|
|
|
|
|
|
|
|
|
|
|
|
|
|
|
|
|
|
|
||
2019 |
2021 |
2023 |
2025 |
2027 |
2029 |
2031 |
2033 |
2035 |
||||||
|
|
|
|
|
|
Wood Mackenzie |
|
Minimum imports |
|
|
||||
|
|
|
|
|
|
HIS Markit |
|
Maximum imports |
|
|
||||
9 |
Sources: Gazprom, Wood Mackenzie, IHS Markit |
|
EUROPEAN IMPORTS IN 2018
bcm
200 1
201.8 |
|
|
|
|
|
|
|
|
|||
.75 |
|
|
|
|
|
|
|
|
|
|
|
|
|
|
|
|
|
|
|
|
|
||
150 |
|
|
|
|
|
|
|
|
|
|
|
|
|
|
|
3:1 |
|
|
|
|
|
||
100.5 |
|
|
|
|
|
|
|
|
|
||
|
|
|
|
|
|
55:1 |
|
|
|||
|
|
|
|
|
|
|
|
|
|||
|
|
|
|
|
|
|
|
|
|||
|
|
|
|
|
|
|
|
|
|
|
|
.25 |
|
|
|
Other countries |
|
|
|
|
|||
50 |
|
|
|
Gazprom supply |
|
|
|
|
|||
|
|
|
|
|
|
|
|
|
|||
0 |
|
|
|
|
countries |
|
|
|
|
||
|
|
|
|
|
|
|
|
|
|
||
1 |
2 |
|
US LNG |
|
|||||||
|
|
|
Pipeline gas from Russia* |
LNG, total imports** |
|
||||||
|
|
|
|
|
|
|
|||||
|
|
|
DAILY RATION |
1 FAST-FOOD MEAL |
1 FIG |
|
|||||
|
FIGURATIVE |
|
|
|
|
|
|
|
|||
|
|
|
2500 kcal |
|
~900 kcal |
~46 kcal |
|
||||
|
|
|
|
|
|
|
|
|
|
|
|
1 |
Including Turkey and excluding the Baltic states |
|
2 |
Total LNG imports include supplies from projects in the US |
STRATEGY |
|
|
vk.com/id446425943
GAZPROM AND CHINA: MARKET LEADERS MEET
CHINA — WORLD’S GAS IMPORTER #1 |
GAZPROM’S SUPPLY TO CHINA |
|
|
|
|
|
|
|
bcm |
|
|
600 |
|
|
400 |
|
IMPORTS |
|
|
|
|
UNCONVENTIONAL PRODUCTION1 OR |
|
200 |
|
IMPORTS |
|
|
CONVENTIONAL PRODUCTION |
0 |
|
|
2018 |
2025 |
2035 |
By 2035, gas consumption in China more than doubles. Unclear future of unconventional gas production reveals huge potential for additional gas imports
•The largest gas sales agreement in history
•New projects are coming
•Proximity of resource base to the market
•Risk-free supplies
•Strong political ties
Sources: Gazprom, IEA, Wood Mackenzie, IHS Markit
1 |
Unconventional production includes shale gas, coal bed/mine methane, coal to gas and do not include tight gas |
10 |
|
GAZPROM — TO BECOME #1 CHINA SUPPLIER
15% |
|
|
|
|
30% |
|
|
||||
10% |
|
|
|
|
20% |
5% |
|
|
|
|
10% |
|
|
|
|
||
|
Share in gas consumption (left axis) |
|
|
|
|
0% |
Share in total gas imports (right axis) |
|
|
0% |
|
|
|
|
|
||
2018 |
2025 |
2035 |
|||
2019 - start of Gazprom’s supply to China
2035 - Gazprom’s market share in China
•in gas consumption 13%
•in gas imports > 25%
STRATEGY