

Goldman Sachs - economic report_watermark
.pdfvk.com/id446425943N te: The following is a redacted version of the original report published July 11, 2019 [26 pgs].
EquityGlobal Macro
ResResearchr
ISSUE 80 | July 11, 2019 | 6:20 PM EDT
TOPof
MIND
DISSECTING THE MARKET DISCONNECT
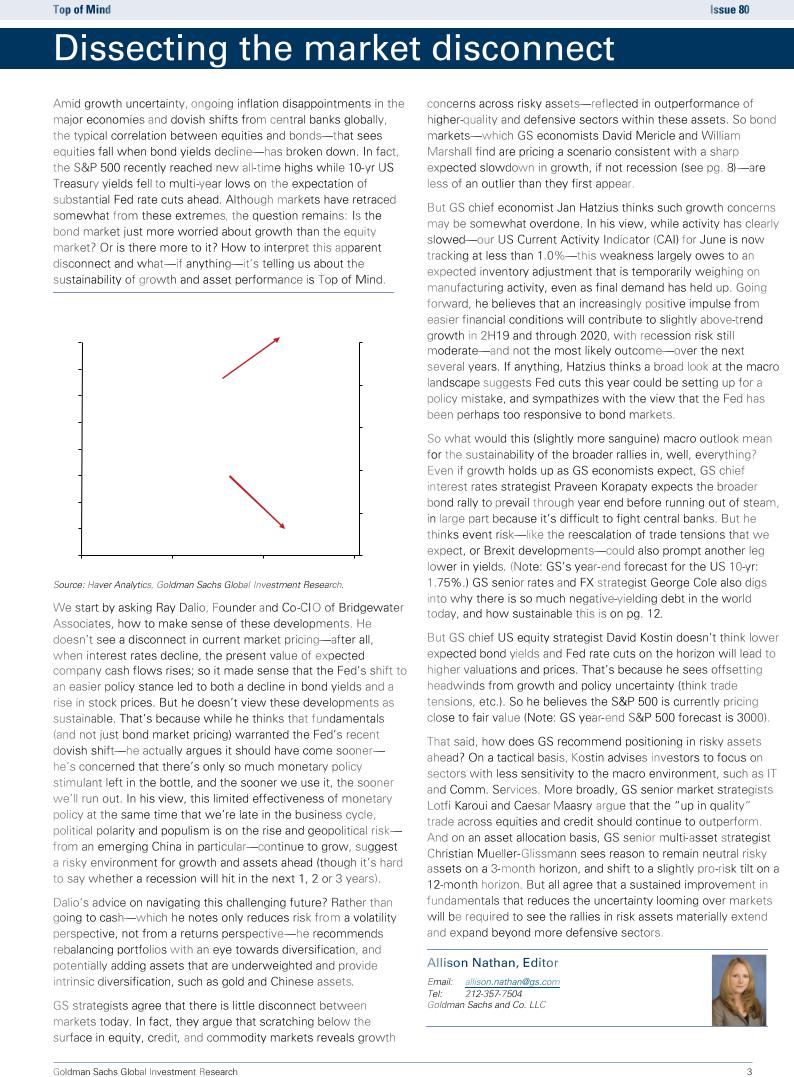
Amid growth uncertainty, inflation disappointments and dovish central bank shifts, the typical correlation between equities and bonds—that sees equities fall when bond yields decline—has broken down. How to interpret this apparent disconnect and what it’s telling us about growth and future asset performance is Top of Mind. We speak with Bridgewater’s Ray Dalio, who thinks recent price action makes sense given the Fed’s easier stance, but that limits on further monetary policy easing— among other political and geopolitical factors—will ultimately bring about a major negative shift in growth and markets. GS strategists agree that there’s no disconnect in markets because under the surface risky assets have reflected growth concerns—
not just bonds. But GS Chief Economist Jan Hatzius argues that the bond market is too concerned about growth, and perhaps not concerned enough about the direction of Fed policy, with the costs of easing now potentially outweighing the benefits. We share our views on how to position here (focus on “up in quality” for now), as does Dalio (diversify!).
“When the Fed shifted to a much easier stance, it made sense that both interest rates fell—which was good for bonds—and stock prices rose. But the power to do this is limited. Think of central banks cutting interest rates and purchasing financial assets (QE) as shooting doses of stimulants into their economies and markets. There is now only a limited amount of stimulant left in the bottle, and the sooner we use it, the sooner it will run out.
- Ray Dalio
To the extent that there is some difference of view between bond market and equity market investors—with
the bond market more pessimistic about growth than the |
|
stock market—I would side a bit more with the stock |
|
market. That’s because it seems to me that the growth |
|
outlook, while clearly not as strong as in 2017/2018, is |
|
still pretty decent. |
“ |
|
|
- Jan Hatzius
WHAT’S INSIDE
INTERVIEWS WITH:
Ray Dalio, Founder and Co-CIO, Bridgewater Associates
Jan Hatzius, Chief Economist, Goldman Sachs
Praveen Korapaty, Chief Interest Rates Strategist, Goldman Sachs
BREAKING DOWN BOND MARKET PRICING
William Marshall and David Mericle, GS Macro Research
LOWER RATES MAY NOT MEAN HIGHER STOCKS
David Kostin, GS US Equity Strategy Research
CARRY AND QUALITY OVER “BETA”
Lotfi Karoui and Caesar Maasry, GS Markets Research
THE BEARISH BULL MARKET IN EVERYTHING
Christian Mueller-Glissmann, GS Multi-Asset Strategy Research
IS NEGATIVE-YIELDING DEBT SUSTAINABLE?
George Cole, GS Europe Markets Research
...AND MORE
Allison Nathan | allison.nathan@gs.com
David Groman | david.groman@gs.com
Investors should consider this report as only a single factor in making their investment decision. For Reg AC certification and other important disclosures, see the Disclosure Appendix, or go to www.gs.com/research/hedge.html.
The Goldman Sachs Group, Inc.
vk.com/id446425943
65 |
|
|
|
Manufacturing Survey Tracker |
|
|
|
||||
|
|
|
|
|
|
|
|||||
60 |
|
|
|
ISM Manufacturing Index |
|
|
|
||||
|
|
|
|
|
|
|
|
|
|
|
|
55 |
|
|
|
|
|
|
|
|
|
|
|
50 |
|
|
|
|
|
|
|
|
|
|
|
45 |
|
|
|
|
|
|
|
|
|
|
|
40 |
|
|
|
|
|
|
|
|
|
|
|
35 |
|
|
|
|
|
|
|
|
|
|
|
30 |
|
|
|
|
|
|
|
|
|
|
|
2008 |
2009 |
2010 |
2011 |
2012 |
2013 |
2014 |
2015 |
2016 |
2017 |
2018 |
2019 |
30 |
|
|
|
|
|
|
|
|
|
20 |
|
|
|
|
|
|
|
|
|
10 |
|
|
|
|
|
|
|
|
|
0 |
|
|
|
|
|
|
|
|
|
|
|
|
|
|
|
|
Corp outlook |
||
-10 |
|
|
|
|
|
|
|
|
|
|
|
|
|
|
Large manufacturers |
|
|
||
-20 |
|
|
|
|
Large nonmanufacturers |
|
|||
|
|
|
|
Small manufacturers |
|
|
|||
|
|
|
|
|
|
|
|||
|
|
|
|
|
Small nonmanufacturers |
|
|||
-30 |
|
|
|
|
|
|
|
|
|
2010 |
2011 |
2012 |
2013 |
2014 |
2015 |
2016 |
2017 |
2018 |
2019Q3 |
|
|
|
|
|
|


4 |
|
8 |
|
|
|
6 |
More central banks easing |
3 |
|
|
|
|
|
|
|
|
|
4 |
|
2 |
|
|
|
|
|
2 |
|
1 |
|
0 |
|
0 |
|
-2 |
|
|
|
|
|
|
GDP |
-4 |
|
-1 |
Potential Growth |
|
|
New Forecast |
-6 |
|
|
|
|
||
|
|
|
|
|
Old Forecast |
|
|
-2 |
|
-8 |
|
2010 |
2011 |
2012 |
2013 |
2014 |
2015 |
2016 |
2017 |
2018 |
2019 |
2020 |
2021 |
15 |
16 |
17 |
18 |
19 |
|
|
|
|
|
|
|
|
|
|
|
|
|
|
|
|
|
vk.com/id446425943
The stock-bond disconnect
10-year US Treasury yield, %; S&P 500, index (rhs)
3.4 |
|
|
S&P 500 |
3000 |
|
|
(rhs) |
||
|
|
|
|
|
3.2 |
|
|
|
|
|
|
|
|
2800 |
3 |
|
|
|
|
2.8 |
|
|
|
2600 |
|
|
|
|
|
2.6 |
|
|
|
|
2.4 |
|
|
|
2400 |
|
|
|
|
|
2.2 |
|
|
|
|
|
|
|
US 10y |
2200 |
2 |
|
|
Yield |
|
|
|
|
|
|
1.8 |
|
|
|
2000 |
Apr-18 |
Oct-18 |
Apr-19 |
Oct-19 |
|
vk.com/id446425943
vk.com/id446425943

vk.com/id446425943
vk.com/id446425943
vk.com/id446425943
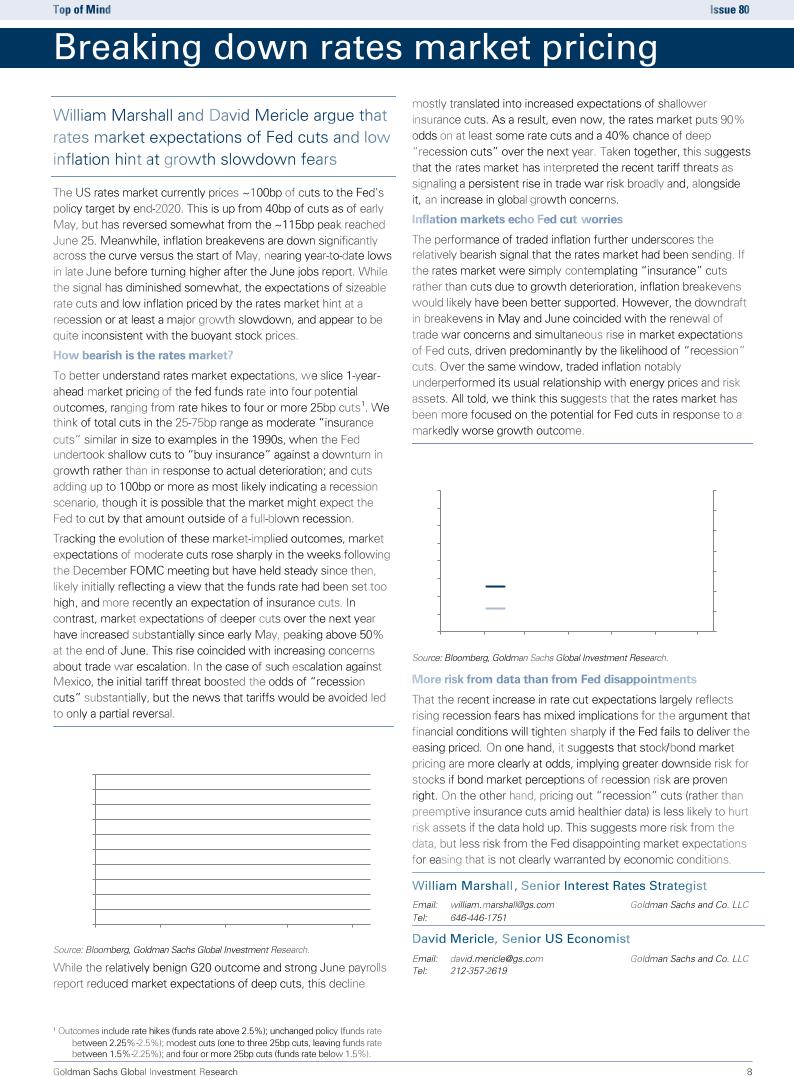
Rising odds of recession cuts
Market-implied probability of policy actions over the next 12 months, %
100% |
≥ 100bp of cuts |
|
|
|
|
90% |
|
|
|
||
25 to 75bp of cuts |
|
|
|
||
|
|
|
|
||
80% |
No Change |
|
|
|
|
70% |
Hike |
|
|
|
|
|
|
|
|
|
|
60% |
|
|
|
|
|
50% |
|
|
|
|
|
40% |
|
|
|
|
|
30% |
|
|
|
|
|
20% |
|
|
|
|
|
10% |
|
|
|
|
|
0% |
|
|
|
|
|
Oct-18 |
Dec-18 |
Feb-19 |
Apr-19 |
Jun-19 |
|
|
|
|
|
|
|
Moving in tandem
10-year US inflation breakeven, %; probability Fed does not cut by ≥100bp, % (rhs)
2.0 |
|
|
100% |
|
2.0 |
|
|
90% |
|
|
|
|
||
1.9 |
|
|
80% |
|
|
|
|
||
1.9 |
|
|
70% |
|
|
|
|
||
1.8 |
|
|
|
|
1.8 |
|
|
60% |
|
10y Inflation Breakeven |
|
|||
|
50% |
|||
1.7 |
|
|
||
|
|
|
||
1.7 |
Probability that Fed does not |
40% |
||
cut by ≥100bp (rhs) |
||||
|
||||
|
|
|||
1.6 |
|
|
30% |
|
Jan-19 |
Feb-19 Mar-19 |
Apr-19 May-19 Jun-19 |
Jul-19 |
|

18
|
1913: Federal |
16 |
Reserve System |
created |
|
14 |
|
12
|
US |
Panic of 1796- |
|
|
depression |
||
|
1797; US real |
||
10 |
(late 1780s) |
||
estate collapse |
|||
|
|||
|
1790: |
and ensuing |
|
|
8.7% |
depression |
|
|
|
1798: |
|
8 |
|
8.1% |
6
4 |
1792: |
1821: |
|
4.7% |
|||
|
4.6% |
||
|
First |
Panic of 1819 |
|
|
Bank of |
||
|
following the end |
||
|
the |
||
2 |
United |
of the War of |
|
|
States |
1812 and mis- |
(1791) |
management of the |
|
Second Bank of |
||
|
||
|
the United States |
Panic of 1837 |
Panic of 1857 |
|
followed by |
followed by |
|
depression |
depression |
|
('37-'43); key |
('57-'60); key |
|
causes were |
causes were |
|
restrictive |
declining |
|
lending |
international |
|
policies in |
economy, |
|
Great Britain, |
failure of a |
|
decline in |
large US bank, |
|
cotton prices, |
and downturn |
|
speculative |
in the railroad |
|
lending |
industry |
|
1842: |
1861: |
|
6.6% |
||
6.6% |
||
|
||
|
The Great |
|
|
Railroad Strike |
|
|
1877: |
|
|
4.5% |
|
1864: |
|
|
|
5.3% |
1869: |
|
|
US |
||
1835: |
4.2% |
||
Civil War |
|||
4.0% |
Gold |
||
(1860-1865); |
|||
|
crash |
||
|
US forced off of |
||
US |
|
||
the gold |
|
||
economic |
|
||
standard |
|
||
boom |
|
||
|
|
Panic of 1907; failed attempt to corner the market on the stock of a large company generated bank losses, a crisis in confidence in banks, and bank runs
1907:
3.3%
1900:
2.9%
0
|
Fed Chairman Volcker increased the |
|
1981: |
|
|
|
|
|||
|
fed funds rate to a peak of 20% in |
15.8% |
|
|
|
|
||||
|
1981 to get double-digit |
inflation |
|
|
|
|
|
|
|
|
|
|
under control |
|
|
|
|
|
|
|
|
|
|
|
|
|
|
1984: Volcker hiked rates to |
||||
|
|
|
|
|
|
13.9% |
restrain the economic |
|||
|
|
|
|
|
|
|
|
recovery and ensure |
||
|
|
|
|
|
|
inflation would remain low |
||||
|
|
2nd oil shock and Iran |
|
|
Recession following |
|||||
|
|
hostage crisis |
|
|
||||||
|
|
|
|
|
|
oil shock |
|
|||
|
|
('79-'80) |
|
|
|
|
|
|||
|
|
|
|
|
|
|
|
|
||
Depression |
|
|
|
|
Unexpected rate-hiking |
|||||
of 1920-21; |
|
1st oil shock |
|
|
||||||
|
|
|
cycle as economic growth |
|||||||
Fed hiked |
|
('73-'74) |
|
|
||||||
|
|
|
improved following '91 |
|||||||
rates to |
|
|
|
|
||||||
|
|
|
|
|
|
recession |
|
|||
control post- |
Fed hiked as |
|
|
1994 |
|
|||||
|
|
|
|
|
||||||
war inflation; |
economy heated up |
|
|
|
|
|
||||
|
|
7.9% |
Start of a rate- |
|||||||
returning |
|
|
|
|
||||||
1969: |
|
|
|
|
hiking cycle as |
|||||
soldiers |
|
|
|
|
||||||
|
7.9% |
|
|
|
|
inflation crept up |
||||
weighed on |
|
|
|
|
|
|||||
|
|
|
|
|
|
with recovery |
||||
wages |
|
|
|
|
|
|
|
|||
|
|
|
|
|
|
|
|
from '01 |
||
|
|
Vietnam war; |
|
|
|
|
|
|||
1920: |
Great |
|
|
1986: |
|
|
recession |
|||
US combat |
|
|
|
|
||||||
|
|
|
|
|
|
|||||
5.6% |
Depression |
|
|
7.0% |
|
2004 |
|
|||
involvement |
|
|
|
|
||||||
|
('29-'41) |
|
|
|
|
4.7% 2010: |
||||
|
('65-'73) |
|
|
Low in |
|
|||||
|
1932: |
|
|
|
||||||
|
|
1971: |
policy-rate |
|
|
2.5% |
||||
|
4.3% |
|
|
|
||||||
|
|
5.5% |
|
|
cycle 1993: |
|
QE2 |
|||
|
|
|
|
|
|
|||||
|
|
|
US |
|
|
5.5% |
|
|
Fed tapering, |
|
|
|
|
abrogation |
|
|
|
|
|||
|
|
|
Low in policy- |
|
hiking, runoff |
|||||
1915: |
|
|
of Bretton |
|
|
|||||
|
|
|
rate cycle |
|
|
|
||||
3.7% |
|
|
Woods |
|
|
|
|
|
||
|
|
|
|
following |
'91 |
|
July 2019: |
|||
WWI |
|
|
|
|
|
|
||||
|
|
|
|
|
recession |
|
|
|||
|
|
|
|
|
|
|
2.1% |
|||
('14-'18) |
|
|
|
|
|
|
|
|||
|
|
|
|
|
|
|
|
|
||
|
|
2003: |
|
|
|
|
|
|
||
|
|
|
|
|
|
|
|
|
||
|
|
1945: |
3.4% |
|
|
|
2008: |
2012: |
|
|
|
|
Low in policy-rate |
|
2.3% |
2016: |
|||||
|
|
1.7% |
|
|||||||
|
|
cycle following tech |
|
GFC |
1.6% |
1.5% |
||||
|
WWII ('39-'45) |
|
||||||||
|
bubble bursting |
|
QE1 |
QE3 |
|
|||||
com/id446425943.vk
vk.com/id446425943