

GS A TMT investor s guide to Growth and Value_watermark-1
.pdfvk.com/id446425943
3 December 2018 | 12:01AM EST
A TMT investor’s guide to Growth and Value
After two years of steady outperformance – and increasingly concentrated investor positioning – TMT Growth stocks have sharply underperformed their Value peers during the past few months. To help understand whether this is a buying opportunity or the beginning of an extended period of Value outperformance, we study the performance of Growth vs. Value within S&P 500 TMT since 1990. Five lessons:
Ben Snider
+1(212)357-1744 | ben.snider@gs.com Goldman Sachs & Co. LLC
David J. Kostin
+1(212)902-6781 | david.kostin@gs.com Goldman Sachs & Co. LLC
Arjun Menon, CFA
+1(212)902-9693 | arjun.menon@gs.com Goldman Sachs & Co. LLC
1.Growth and Value stocks outperform in cycles. These cycles typically last 12 months and amount to 30 percentage points of outperformance, although the recent Growth outperformance cycle has been substantially stronger.
2.Sharp rotations from TMT Growth to Value are not uncommon. The recent 14 pp Growth underperformance falls short of the median calendar year drawdown of
17pp since 1990. These drawdowns carry little signal for forward returns.
3.From a macro perspective, the key driver of Growth vs. Value performance is the pace of economic growth. Growth stocks fare best when economic growth is healthy but modest. Value stocks outperform alongside major GDP accelerations and decelerations. Value stocks also outperform when interest rates move sharply, but otherwise exhibit a weaker relationship with rates than most investors believe.
4.The valuation spread between TMT Growth and Value stocks has historically carried little signal for future returns. However, TMT Growth stocks currently carry their largest premium over Value stocks outside of the Tech Bubble.
5.Earnings revisions exhibit a clear historical relationship with TMT Growth vs. Value returns. The recent underperformance of Growth stocks coincided with a negative shift in earnings expectations. Going forward, the path of earnings growth will be a key determinant of Growth stock outor underperformance.
Today, the near-term outlook for pure Growth and Value strategies is muddy.
Instead, we recommend a more selective approach that tilts toward companies with
steady secular growth and improving earnings expectations while avoiding stocks
with extremely elevated valuations.
Ryan Hammond
+1(212)902-5625 | ryan.hammond@gs.com Goldman Sachs & Co. LLC
Cole Hunter, CFA
+1(212)357-9860 | cole.p.hunter@gs.com Goldman Sachs & Co. LLC
Nicholas Mulford
+1(212)357-6308 | nicholas.mulford@gs.com Goldman Sachs & Co. LLC
Goldman Sachs does and seeks to do business with companies covered in its research reports. As a result, investors should be aware that the firm may have a conflict of interest that could affect the objectivity of this report. Investors should consider this report as only a single factor in making their investment decision. For Reg AC certification and other important disclosures, see the Disclosure Appendix, or go to www.gs.com/research/hedge.html. Analysts employed by non-US affiliates are not registered/qualified as research analysts with FINRA in the U.S.

vk.com/id446425943
Goldman Sachs
TMT Growth vs. Value in 5 lessons
In this report we examine the performance of S&P 500 TMT Growth vs. Value since 1990 and highlight five key lessons to help investors identify the determinants of performance going forward.
1.Growth and Value alternate outperformance in cycles. In general, these cycles last 12 months and amount to 30 percentage points of outperformance. During the last five years, however, Growth has benefited from two distinct outperformance cycles, each of which lasted longer and amounted to a larger magnitude of outperformance than usual.
2.Sharp rotations from Growth to Value are not uncommon. Since 1990 the median calendar year has included a TMT Growth vs. Value drawdown of 17 percentage points, larger than the 14 pp underperformance suffered by Growth stocks during the past few months. These drawdowns do not always signal the end of Growth outperformance cycles, but neither do they consistently represent opportunities to buy the dip.
3.From a macro perspective, the key driver of TMT Growth vs. Value performance is the pace of economic growth. When economic growth is healthy but modest, investors allocate a scarcity premium to stocks able to generate strong idiosyncratic growth. When the pace of economic growth changes sharply, however, Value stocks tend to outperform; they fall less as the economy descends into recession and rise more as the economy accelerates in recovery. Sharp moves in interest rates also tend to spur Value outperformance, but rates are much less relevant to Growth vs. Value returns than most investors believe.
4.Valuations are also less important for TMT Growth vs. Value performance than many investors believe. In contrast to equity market-wide Growth vs. Value performance, the dispersion of valuation multiples has historically provided little signal for future TMT Growth vs. Value returns. However, today’s valuation spread between TMT Growth and Value stocks is the largest outside of the Tech Bubble. Then, extreme Growth stock valuations preceded a period of Value outperformance that lasted nearly three years.
5.In contrast to valuations, earnings revisions have exhibited a clear historical relationship with TMT Growth vs. Value returns. Put simply, when the earnings growth outlook for Growth stocks is improving more than the outlook for Value stocks, Growth stocks outperform. The recent sell-off in TMT Growth stocks coincided with a negative turn in earnings revisions, and the path of earnings will likely be the key driver of TMT Growth vs. Value performance going forward.
In recent years we have consistently recommended that investors focus on firms with strong growth and deprioritize stock valuations in their selection processes. Today, the backdrop of decelerating economic and earnings growth would typically support further Growth stock outperformance. However, extremely elevated valuations, concentrated investor positioning, and recent earnings weakness complicate the picture.
Rather than pure Growth or Value strategies, the current environment supports a more selective approach. We recommend investors tilt toward companies with steady secular
3 December 2018 |
2 |

vk.com/id446425943
Goldman Sachs
growth as well as other “quality” attributes like strong balance sheets and high pricing power. At the same time, investors should return their focus to valuations and avoid stocks with extremely elevated multiples. Earnings revisions have historically been a key determinant of performance, and fundamental analysis looks particularly important today.
For the purposes of this report, we examine the performance of Growth and Value by tracking portfolios of equal-weighted S&P 500 TMT stocks. Each of these portfolios is rebalanced monthly to contain quartiles of stocks selected using a combination of trailing and forward growth and valuation metrics. We define the TMT universe to include the current GICS Information Technology and Communication Services sectors and the equivalent historical categorizations prior to the recent GICS reclassification.
Appendix A provides a detailed explanation of how we define Growth and Value for the purposes of this analysis and compares performance with other measures such as the Russell Growth and Value indices.
Appendix B contains a list of the 20 largest S&P 500 TMT stocks currently ranking in the top quartile of Growth and the 20 largest ranking as Value.
Appendix C shows how companies move between Growth and Value by tracking the growth rankings of the largest TMT stocks at various points in history through subsequent years.
Appendix D contains a list of “GARP” stocks that currently rank in the top half of S&P 500 TMT stocks based on growth and also the bottom half based on valuations.
Exhibit 1: The 15 largest S&P 500 TMT stocks and their current quartile rankings as Growth and Value
First quartile for Growth indicates fastest growth; first quartile for Value indicates lowest valuation
|
|
Mkt |
YTD |
Growth |
|
Valuation |
||
|
|
Trailing |
Cons 2019 |
|
Fwd |
EV/ |
||
Company |
Ticker |
cap (bn) |
return |
sales |
earnings |
|
P/E |
EBITDA |
3m revision |
Current quartile |
|
to cons. |
(1=highest) |
|
2019 EPS |
Growth |
Value |
|
|
Netflix Inc. |
NFLX |
$126 |
50 % |
37 % |
55 % |
86x |
15x |
(4.3)% |
|
1 |
4 |
|
|
|
Adobe Inc. |
ADBE |
122 |
42 |
24 |
17 |
32 |
38 |
3.8 |
|
1 |
4 |
|
|
|
Microsoft Corp. |
MSFT |
845 |
31 |
16 |
14 |
25 |
15 |
3.3 |
|
2 |
3 |
|
|
|
Mastercard Inc. |
MA |
202 |
31 |
21 |
17 |
27 |
20 |
0.4 |
|
1 |
4 |
|
|
|
Cisco Systems Inc. |
CSCO |
216 |
27 |
5 |
13 |
15 |
11 |
1.8 |
|
3 |
2 |
|
|
|
Visa Inc. |
V |
247 |
23 |
12 |
16 |
26 |
13 |
(0.0) |
|
1 |
3 |
|
|
|
Verizon Communications |
VZ |
246 |
18 |
5 |
1 |
13 |
8 |
(0.8) |
|
4 |
2 |
|
|
|
Walt Disney |
DIS |
173 |
9 |
8 |
3 |
16 |
11 |
(1.1) |
|
4 |
2 |
|
|
|
Apple Inc. |
AAPL |
867 |
8 |
16 |
12 |
13 |
10 |
(1.2) |
|
2 |
2 |
|
|
|
Intel Corp. |
INTC |
220 |
6 |
12 |
1 |
11 |
7 |
6.8 |
|
4 |
1 |
|
|
|
Alphabet Inc. |
GOOGL |
662 |
4 |
24 |
11 |
24 |
12 |
(1.3) |
|
2 |
3 |
|
|
|
Oracle Corp. |
ORCL |
191 |
3 |
4 |
8 |
14 |
10 |
0.4 |
|
4 |
2 |
|
|
|
Comcast Corp. |
CMCSA |
180 |
0 |
5 |
9 |
15 |
8 |
0.1 |
|
2 |
1 |
|
|
|
AT&T Inc. |
T |
222 |
(17) |
2 |
3 |
9 |
6 |
0.5 |
|
3 |
1 |
|
|
|
Facebook Inc. |
FB |
334 |
(21) |
42 |
1 |
19 |
10 |
(10.3) |
|
2 |
2 |
|
|
|
|
|
|
|
|
|
|
|
|
|
|
|
|
|
|
S&P 500 TMT median |
|
$23 |
6 % |
9 % |
9 % |
17x |
13x |
(0.2)% |
|
|
|
|
|
|
|
|
|
|
|
|
|
|
|
|
|
|
|
Source: FactSet, Goldman Sachs Global Investment Research
3 December 2018 |
3 |
vk.com/id446425943
Goldman Sachs
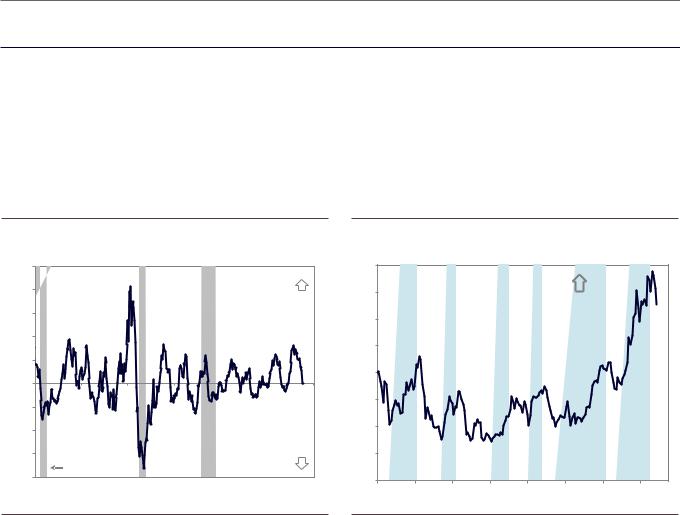
Growth and Value outperform in cycles
The horse race between TMT Growth and Value stocks has been remarkably
evenly matched. Since 1990, TMT Growth stocks have outperformed Value stocks in 49% of months and 54% of quarters. However, the periods of Growth and Value outperformance each fall into cycles. These cycles are also fairly even, both in duration and magnitude. Exhibit 4 shows the 10 Growth outperformance cycles and 10 Value outperformance cycles since 1990, which each have typically lasted for roughly 12 months and 30 percentage points of outperformance.
Exhibit 2: Growth and Value outperform in cycles |
Exhibit 3: Indexed TMT Growth vs. Value performance |
100 pp |
|
|
|
|
|
|
140 |
|
|
|
|
|
|
|
|
80 pp |
|
|
|
|
Growth |
|
|
|
|
|
|
|
|
|
|
|
|
|
|
outperforming |
|
130 |
S&P 500 TMT |
|
|
|
|
|
|||
|
|
|
|
|
|
|
|
Growth |
|
|
|||||
|
|
|
|
|
|
|
|
Growth vs. Value |
|
|
|
|
|||
60 pp |
|
|
TMT Growth vs. Value |
|
120 |
indexed |
|
|
outperforming |
|
|||||
|
|
|
|
|
|
|
|
||||||||
|
|
|
|
|
|
|
performance |
|
|
|
|
|
|||
40 pp |
|
|
Rolling 12-month return |
|
|
|
|
|
|
|
|||||
|
|
|
|
|
|
110 |
|
|
|
|
|
|
|
||
|
|
|
|
|
|
|
|
|
|
|
|
|
|
||
20 pp |
|
|
|
|
|
|
|
|
|
|
|
|
|
|
|
0 pp |
|
|
|
|
|
|
100 |
|
|
|
|
|
|
|
|
|
|
|
|
|
|
|
|
|
|
|
|
|
|
||
(20)pp |
|
|
|
|
|
|
90 |
|
|
|
|
|
|
|
|
|
|
|
|
|
|
|
|
|
|
|
|
|
|
||
(40)pp |
|
|
|
|
|
|
80 |
|
|
|
|
|
|
|
|
|
|
|
|
|
|
|
|
|
|
|
|
|
|
||
(60)pp |
|
|
|
|
Value |
|
70 |
|
|
|
|
Growth |
|
|
|
|
|
|
|
|
|
|
|
|
|
|
outperformance |
|
|||
|
Recession |
|
|
|
outperforming |
|
|
|
|
|
|
|
|||
(80)pp |
|
|
|
|
|
|
|
|
|
cycles |
|
|
|||
|
|
|
|
|
|
60 |
|
|
|
|
|
|
|||
|
|
|
|
|
|
|
|
|
|
|
|
|
|||
1990 |
1995 |
2000 |
2005 |
2010 |
2015 |
2020 |
|
|
|
|
|
|
|
||
2004 |
2006 |
2008 |
2010 |
2012 |
2014 |
2016 |
2018 |
||||||||
|
|
|
|
|
|
|
|||||||||
Source: Goldman Sachs Global Investment Research |
Source: Goldman Sachs Global Investment Research |
The most recent cycle of Growth stock outperformance has been more extended
than usual. Between September 2016 and July 2018, S&P 500 TMT Growth stocks outperformed Value stocks by nearly 50 percentage points, more than any cycle outside of the stretch from the end of 1997 to early 2000. Although it is too soon to know whether this most recent cycle has ended, the current stretch of 26 months would match the length of the cycle in the late 1990s and fall eight months short of the record-long stretch of Growth stock outperformance from mid-2013 through early 2016.
3 December 2018 |
4 |

vk.com/id446425943
Goldman Sachs
Exhibit 4: Recent Growth outperformance cycle has been longer than average
GROWTH outperformance cycles
|
|
Cycle |
Growth |
Cycle dates |
length |
vs. Value |
|
Start |
End |
(months) |
return |
Apr-92 |
Feb-94 |
22 |
46 pp |
Jun-94 |
Jul-95 |
13 |
34 |
Jul-96 |
Jul-97 |
12 |
23 |
Dec-97 |
Feb-00 |
26 |
112 |
Oct-02 |
Nov-03 |
13 |
42 |
Aug-04 |
Mar-06 |
19 |
31 |
May-07 |
Apr-08 |
11 |
24 |
Jan-10 |
Feb-11 |
13 |
23 |
Jan-12 |
Nov-12 |
10 |
18 |
Jun-13 |
Apr-16 |
34 |
30 |
|
|
|
|
Growth cycle median |
13 |
30 pp |
|
Sep-16 |
Current |
26 |
33 pp |
VALUE outperformance cycles
|
|
Cycle |
Value |
Cycle dates |
length |
vs. Growth |
|
Start |
End |
(months) |
return |
Feb-94 |
Jun-94 |
4 |
13 pp |
Jul-95 |
Jul-96 |
12 |
34 |
Jul-97 |
Dec-97 |
5 |
42 |
Feb-00 |
Oct-02 |
32 |
299 |
Nov-03 |
Aug-04 |
9 |
29 |
Mar-06 |
May-07 |
14 |
41 |
Apr-08 |
Jan-10 |
21 |
25 |
Feb-11 |
Jan-12 |
11 |
13 |
Nov-12 |
Jun-13 |
7 |
19 |
Apr-16 |
Sep-16 |
5 |
10 |
|
|
|
|
Value cycle median |
10 |
27 pp |
|
Source: Goldman Sachs Global Investment Research
3 December 2018 |
5 |
vk.com/id446425943
Goldman Sachs
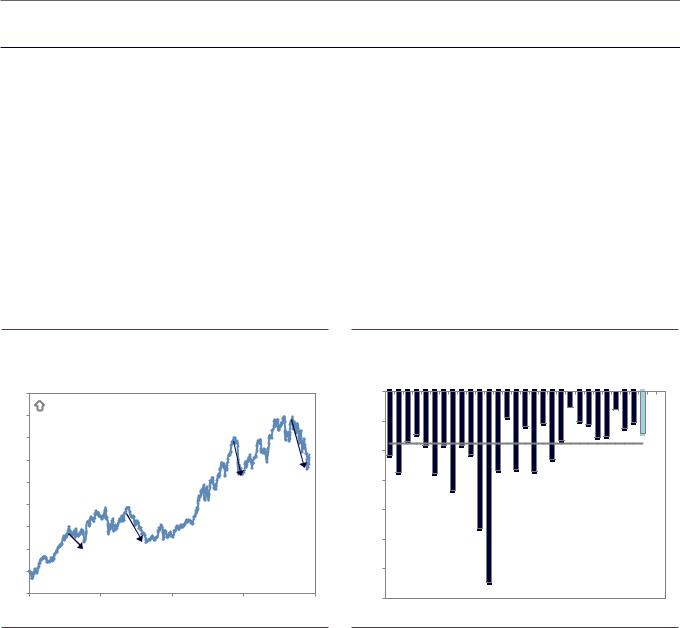
Growth vs. Value corrections are not unusual
Between late July and mid-November TMT Growth stocks underperformed Value stocks by 14 percentage points. This drawdown propelled the latest wave of proclamations by market observers that investors should rotate their portfolios and expect the beginning of a new Value outperformance cycle.
What the commentators overlook, however, is that such Growth vs. Value drawdowns are a regular occurrence and that the most recent episode is not exceptional in a historical context. Since 1990, TMT Growth stocks have experienced a stretch of underperformance relative to Value stocks averaging 17 percentage points each year. During the current economic cycle the typical annual drawdown has been a more moderate 11 percentage points. These drawdowns include a 10 pp episode in November-December 2017, a stretch of 12 pp underperformance between May and August of 2016, and a 6 pp drawdown in 3Q 2015.
Exhibit 5: Recent drawdown of TMT Growth stocks is not unusual |
Exhibit 6: In the typical year Growth stocks lag Value by 17 pp at |
|
some point |
180 |
Growth |
|
|
|
|
|
|
|
|
170 |
outperforming |
|
|
|
|
|
|
|
|
160 |
TMT Growth vs. Value |
|
|
|
|
|
|
||
150 |
indexed performance |
|
|
|
140 |
|
|
2017 |
2018 |
|
|
-14pp |
||
|
|
2016 |
-10pp |
|
130 |
|
|
||
|
|
|
||
|
-12pp |
|
|
|
|
|
|
|
|
120 |
|
|
|
|
110 |
|
|
|
|
|
2015 max |
|
|
|
100 |
drawdown |
|
|
|
|
-6pp |
|
|
|
90 |
|
|
|
|
2015 |
2016 |
2017 |
2018 |
2019 |
0 pp |
|
|
|
|
|
(10)pp |
|
|
|
|
|
|
|
|
|
|
(14) |
(20)pp |
|
|
|
Median since 1990 = |
|
|
|
|
|
|
17 pp |
(30)pp |
|
|
|
|
|
(40)pp |
|
|
|
|
|
|
|
|
TMT Growth vs. Value |
||
(50)pp |
|
|
maximum calendar year |
||
|
|
|
drawdown |
||
|
|
|
|
||
(60)pp |
|
|
|
|
|
(70)pp |
|
|
|
|
|
1990 |
1995 |
2000 |
2005 |
2010 |
2015 |
Source: Goldman Sachs Global Investment Research |
Source: Goldman Sachs Global Investment Research |
Unfortunately for investors, historical Growth vs. Value drawdowns give little indication of what to expect going forward. Following 16 other Growth vs. Value corrections since 1990, Growth stocks went on to outperform in exactly half of subsequent six-month periods. In the other half of episodes Value stocks outperformed.
3 December 2018 |
6 |

vk.com/id446425943
Goldman Sachs
Exhibit 7: No clear pattern following Growth stock drawdowns
S&P 500 TMT Growth vs. Value corrections and subsequent performance
|
Date of 10pp+ |
Return following -10pp threshold |
|
Subseq. 6m trough |
|
|||
|
correction |
1-mo |
3-mo |
6-mo |
|
Add’l decline |
Days |
|
|
Sep. 1993 |
8 pp |
0 pp |
16 pp |
|
(1)pp |
54 |
|
|
Oct. 1995 |
3 |
(15) |
(12) |
(23) |
71 |
|
|
|
Feb. 1997 |
(4) |
10 |
14 |
(7) |
14 |
|
|
|
Sep. 1997 |
(10) |
(23) |
(21) |
(25) |
56 |
|
|
|
Apr. 1999 |
1 |
8 |
11 |
(6) |
1 |
|
|
|
Mar. 2000 |
(14) |
(8) |
(5) |
(19) |
47 |
|
|
|
Feb. 2004 |
(1) |
0 |
(12) |
(16) |
119 |
|
|
|
May. 2006 |
(7) |
(16) |
(18) |
(20) |
118 |
|
|
|
Nov. 2007 |
10 |
6 |
9 |
(2) |
52 |
|
|
|
Sep. 2008 |
(12) |
(10) |
(3) |
(15) |
25 |
|
|
|
Aug. 2011 |
5 |
5 |
(2) |
(6) |
119 |
|
|
|
Jun. 2012 |
6 |
10 |
10 |
0 |
0 |
|
|
|
Mar. 2013 |
(0) |
(3) |
(3) |
(8) |
70 |
|
|
|
Mar. 2014 |
(1) |
2 |
1 |
(5) |
22 |
|
|
|
Aug. 2016 |
0 |
2 |
4 |
(2) |
4 |
|
|
|
Dec. 2017 |
3 |
9 |
16 |
0 |
0 |
|
|
|
|
|
|
|
|
|
|
|
|
Average |
(1)pp |
(1)pp |
0 pp |
|
(10)pp |
48 |
|
|
Median |
(0) |
1 |
(0) |
(7) |
50 |
|
|
|
|
|
|
|
|
|
|
|
Source: Goldman Sachs Global Investment Research
3 December 2018 |
7 |
vk.com/id446425943
Goldman Sachs
Macro drivers of TMT Growth vs. Value returns
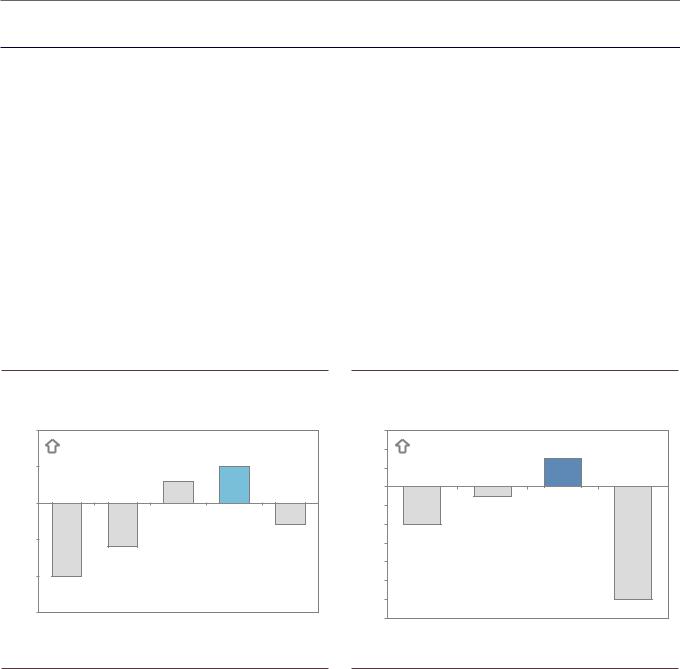
From a macro perspective, the most important driver of TMT Growth vs. Value performance is economic growth. Growth stocks typically fare best when economic activity is moderate and stable or slowing. In these environments, investors allocate a scarcity premium to firms able to generate growth without the help of a strong economy.
Examining the performance of TMT Growth vs. Value alongside the ISM Manufacturing index makes this dynamic clear. Since 1990, Growth stocks have fared best relative to Value stocks when the ISM has ranged between 53-58, indicating healthy economic expansion, while Value stocks have fared best alongside ISM readings that were weak (<52) or exceptionally strong (>58). Similarly, the best phase of the business cycle for Growth stocks, as measured by the ISM, has been when the index was between its peak and 50, indicating a backdrop of positive but decelerating economic growth. The ISM Manufacturing index most recently registered a 57.7 reading for October, having apparently peaked at 61.3 in August.
Exhibit 8: TMT Growth vs. Value performance and ISM level |
Exhibit 9: Growth stocks fare best when economic growth is |
|
positive but decelerating |
1.0 pp |
|
|
|
|
0.6 pp |
|
|
|
|
|
|
Growth |
|
|
|
0.4 pp |
Growth |
|
0.3 % |
|
|
outperforming |
|
0.5 % |
|
outperforming |
|
|
||||
0.5 pp |
|
|
|
0.2 pp |
|
|
|
|
||
|
0.3 % |
|
|
|
|
|
|
|||
|
|
|
|
|
|
|
|
|
||
|
|
|
|
|
0.0 pp |
|
|
|
|
|
0.0 pp |
|
|
|
|
(0.2)pp |
(0.4)% |
(0.1)% |
|
|
|
|
|
|
|
|
(0.4)pp |
|
|
|
||
|
|
|
|
(0.3)% |
|
|
|
|
||
(0.5)pp |
|
|
|
(0.6)pp |
|
|
|
|
||
|
|
|
|
|
|
|
|
|||
|
|
|
|
|
|
|
|
|
||
|
(0.6)% |
Median monthly TMT |
|
(0.8)pp |
Median monthly TMT |
|
|
|||
(1.0)pp |
|
Growth vs. Value return |
|
|
|
|
||||
|
by ISM level |
|
(1.0)pp |
Growth vs. Value return |
|
|
||||
(1.0)% |
|
|
|
|
||||||
|
|
|
|
|
by ISM cycle phase |
|
(1.2)% |
|||
|
|
|
|
|
(1.2)pp |
|
||||
|
|
|
|
|
|
|
|
|
||
(1.5)pp |
|
|
|
|
(1.4)pp |
|
|
|
|
|
<50 |
50 - 52 |
53-55 |
56-58 |
>58 |
Trough to 50 |
50 to peak |
Peak to 50 |
50 to trough |
||
|
||||||||||
|
|
|
|
|
|
|||||
|
|
ISM level range |
|
|
|
|
ISM cycle phase |
|
||
Source: ISM, Goldman Sachs Global Investment Research |
|
|
Source: ISM, Goldman Sachs Global Investment Research. |
|
||||||
Comparing TMT Growth vs. Value returns with other measures of macro growth tells a similar story. During the last 30 years, TMT Growth stocks have outperformed Value stocks the most when our economists’ US Current Activity Indicator, a monthly tracker of economic activity, indicated a real pace of growth between 1% and 3%.
3 December 2018 |
8 |
vk.com/id446425943
Goldman Sachs
Exhibit 10: The ISM cycle appears to have peaked |
Exhibit 11: Investors reward growth stocks in mediocre economic |
|
growth environments |
70 |
|
|
|
|
|
|
1.5% |
|
|
|
|
|
ISM manufacturing index |
|
|
|
|
|
|
|
Growth |
||
65 |
|
|
|
|
|
|
1.0% |
|
0.7 |
outperforming |
|
|
61 |
|
|
61 |
|
|
61 |
|
|
|
|
|
59 |
|
59 |
|
|
|
|
|
|||
60 |
|
58 |
|
58 |
0.5% |
|
|
0.2 |
|
||
|
58 |
|
|
|
|
|
|||||
|
|
|
|
|
|
|
58 |
|
|
|
|
55 |
|
|
|
|
|
|
0.0% |
|
|
|
|
50 |
|
|
|
|
|
|
(0.5)% |
|
|
|
(0.1) |
|
|
|
|
|
|
|
TMT Growth vs. Value |
|
|||
|
|
|
|
|
|
|
|
|
|
||
45 |
|
|
|
|
|
|
(1.0)% |
|
median quarterly return |
|
|
|
|
|
|
|
|
|
and US economic growth |
||||
|
|
|
|
|
|
|
|
|
|||
40 |
|
|
|
|
|
|
(1.5)% |
(1.5) |
|
|
|
|
|
|
|
|
|
|
|
|
|
|
|
35 |
|
|
|
|
|
|
(2.0)% |
0% to 1% |
1% to 2% |
2% to 3% |
>3% |
|
|
|
|
|
|
|
|
||||
30 |
|
|
|
|
|
|
|
|
Quarterly real US economic growth |
|
|
1985 |
1990 |
1995 |
2000 |
2005 |
2010 |
2015 |
2020 |
|
|
|
|
Source: ISM, Goldman Sachs Global Investment Research |
|
|
Source: Goldman Sachs Global Investment Research |
|
|
||||||
History lies at odds with the perception of most investors that rising interest rates benefit Value stocks. Conceptually, investors argue that rising discount rates should be particularly harmful for growth stocks because so much of their expected cash flows lie far into the future. However, historical correlations show a different story.
Surprisingly, the performance of TMT Growth vs. Value has typically exhibited a weak but positive correlation with US interest rates, meaning more often than not Growth stocks have outperformed alongside rising interest rates. This relationship is evident using both short-term and long-term interest rates, both in nominal and real (inflation-adjusted) terms. The exception is the inverse relationship with the Treasury yield curve slope, indicating that Value stocks have historically outperformed when the yield curve steepens, although this correlation was particularly weak.
3 December 2018 |
9 |
vk.com/id446425943
Goldman Sachs
Exhibit 12: Growth generally outperforms alongside rising rates, but the relationship is weak
Correlations of weekly returns during the last 15 years
0.15
Correlation with TMT |
TMT Growth typically |
outperforms Value |
|
Growth vs. Value |
as macro variable rises |
0.10
0.05
0.00
(0.05)
Real 10-year |
Nominal 2-year |
Nominal 10-year |
Trade-weighted |
Treasury yield |
Treasury yields |
Treasury yields |
Treasury yields |
US dollar |
curve slope |
Source: Goldman Sachs Global Investment Research
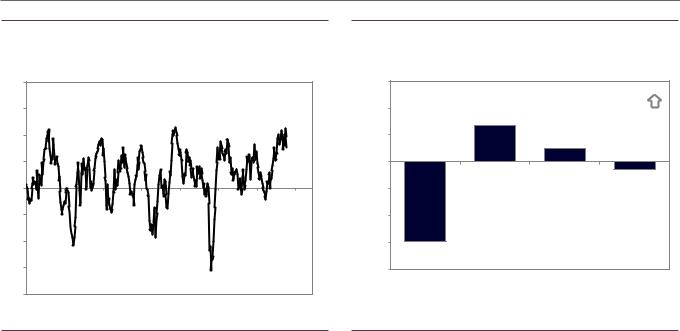
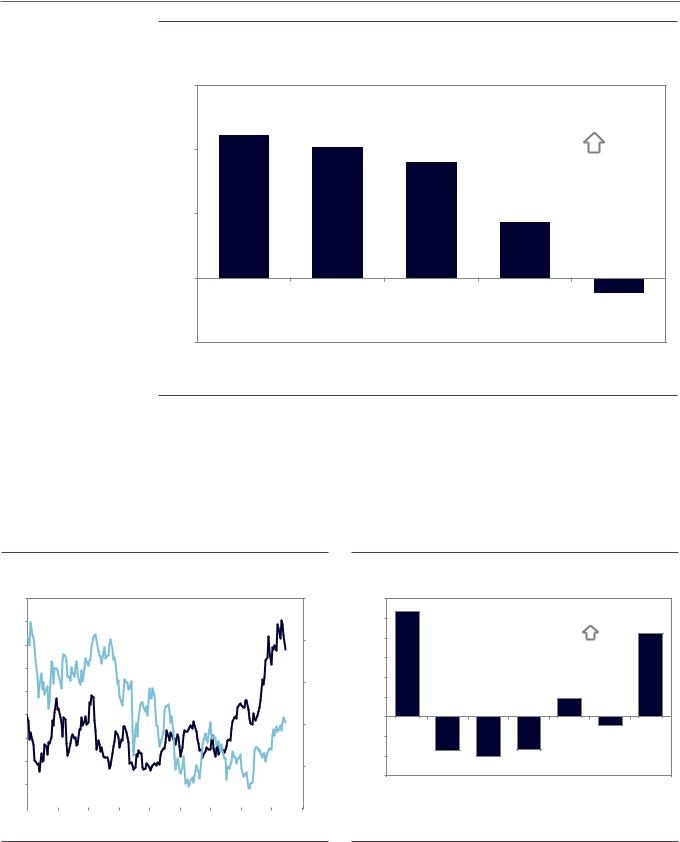
One exception to the pattern is during periods when interest rates move sharply. Value stocks typically outperform when 10-year US Treasury yields rise or fall by more than 20 basis points in a month. However, rather than the interest rates driving performance, it seems likely that the sharp moves in rates accompany a sharp market adjustment in expected economic growth, reflecting the strong relationship between Growth vs. Value performance and the economy discussed above.
Exhibit 13: TMT Growth vs. Value performance and interest rates |
Exhibit 14: Value typically outperforms when rates move sharply |
150 |
|
6% |
0.6 % |
|
|
|
|
|
|
140 |
|
|
0.5 % |
|
|
|
Value outperforming |
|
|
|
|
|
|
|
|
|
|
||
|
|
|
|
|
|
|
|
|
|
|
TMT Growth vs. Value |
5% |
0.4 % |
TMT Value vs. Growth |
|
|
|
||
130 |
median monthly return |
|
|
|
|||||
indexed performance |
|
|
|
|
|
||||
|
|
0.3 % |
vs. changes in 10-year |
|
|
|
|||
|
(left axis) |
|
|
|
|
||||
120 |
|
|
US Treasury yields |
|
|
|
|||
|
|
0.2 % |
|
|
|
||||
|
|
4% |
|
|
|
|
|
|
|
110 |
|
|
|
|
|
|
|
|
|
|
|
0.1 % |
|
|
|
|
|
|
|
|
|
|
|
|
|
|
|
|
|
100 |
|
3% |
0.0 % |
|
|
|
|
|
|
|
|
|
|
|
|
|
|
|
|
90 |
|
|
(0.1)% |
|
|
|
|
|
|
80 |
|
2% |
(0.2)% |
|
|
|
|
|
|
|
|
|
|
|
|
|
|
||
|
|
(0.3)% |
|
|
|
|
|
|
|
70 |
10-year US Treasury yield |
|
|
|
|
|
|
|
|
|
(100) to |
(20) to |
(10) to |
(5) to |
5 to |
10 to |
20 to |
||
|
(right axis) |
|
(20) |
(10) |
(5) |
5 |
10 |
20 |
100 |
|
|
|
|||||||
60 |
|
|
|
|
|
|
|
|
|
|
1% |
Monthly change in 10-year US Treasury yield (bps) |
|
|
|
|
|
|
|
|
|
|
|||
2002 |
2004 |
2006 |
2008 |
2010 |
2012 |
2014 |
2016 |
2018 |
2020 |
|
||
Source: Goldman Sachs Global Investment Research Source: Goldman Sachs Global Investment Research
3 December 2018 |
10 |